
Trump-Xi Day 2: zero binding deals on tariffs, semiconductors, or Taiwan; S&P -1.24%, 10Y +14 bps to 4.60%, stagflation pricing confirmed. WTI +4.26% to $105.48 on Hormuz collapse — ~10% weekly gain compounds the tariff-inflation stack. Warsh sworn in as Fed Chair with >50% 2026 rate-hike odds; June 16 FOMC is his first test. Chip leaders MU, INTC, AMD down 5–7% on NVDA pre-positioning and unresolved China export overhang. Ackman disclosed MSFT at 21x, exited GOOGL; MSFT +3.05% vs. Nasdaq -1.54%.
TABLE OF CONTENTS
A. EXECUTIVE SUMMARY
B. MARKET DATA
C. HIGH-IMPACT STORIES (5)
D. MODERATE-IMPACT STORIES (5)
E. ECONOMY WATCH (5)
F. EARNINGS WATCH (1)
G. WHAT’S NEXT
H. CHART OF THE DAY
A. EXECUTIVE SUMMARY -> TOP
MARKET SNAPSHOT
The S&P 500 fell -1.24% Friday after the Trump-Xi Beijing summit concluded without binding agreements on tariffs, semiconductor export controls, or Taiwan — invalidating the high-expectations framework priced in over two days of diplomatic buildup. Simultaneously, WTI crude surged +4.26% to $105.48 on Strait of Hormuz supply disruptions and stalled US-Iran talks, and Kevin Warsh was sworn in as Fed Chair, driving the 10-year yield up 14 bps to 4.601% and pushing rate-hike probability above 50% for 2026 for the first time. The cross-asset signature — equities, bonds, gold, and copper all falling while oil, the dollar, and yields rose — is a stagflation pricing event, not a growth scare: markets are assigning durable inflation risk to an unresolved tariff stalemate and an energy shock that will embed in CPI through at least June. Breadth was near-uniform: 10 of 11 sectors closed red, with Basic Materials (-4.30%) and Utilities (-2.70%) leading losses while Energy (+1.36%) was the sole beneficiary of the Hormuz supply shock.
TODAY AT A GLANCE
• Trump-Xi summit stalemate: Day 2 produced zero binding agreements on tariffs, semiconductor export controls, or Taiwan. Boeing’s aspirational 750-jet figure was absent from Beijing’s official readout; no formal contracts executed. The next potential diplomatic window is a fall 2026 Xi-US visit — months of continued tariff compounding, export-control uncertainty, and Nvidia China-revenue impairment ahead.
• Oil shock escalates: WTI +4.26% to $105.48 on Strait of Hormuz supply collapse — ~10% weekly gain. IEA projects global undersupply through October. Three transmission channels active: direct CPI energy inflation, margin compression across airlines/trucking/retail, and regressive consumer confidence destruction. The $100+ WTI environment will begin fully embedding in June CPI (released July).
• Warsh era begins at maximum contradiction: Kevin Warsh sworn in as the 17th Fed Chair (54-45, narrowest modern confirmation) inheriting CPI 3.8%, PPI 6.0%, WTI $105, and CME markets pricing >50% probability of a 2026 rate hike — a sharp reversal from <3% just 72 hours earlier. His first FOMC meeting is June 16-17; his first public communication will set the H2 rate trajectory for every rate-sensitive sector.
• Semiconductor sector -5% to -7%: MU -6.62%, INTC -6.18%, AMD -5.69% as profit-takers reduced crowded positions ahead of Nvidia Q1 FY2027 earnings May 20 AMC. The sector has been the primary engine of S&P 500 YTD returns; simultaneous broad declines have material index-level drag. China export-control overhang remains structurally unresolved through at least the fall diplomatic window.
• Ackman discloses MSFT, exits GOOGL fully: Pershing Square built a Microsoft stake since February at ~21x forward earnings — a relative-value AI bet against premium multiples — while fully exiting Alphabet. MSFT +3.05% against -1.54% Nasdaq on the disclosure. The complete GOOGL exit implies Ackman views the Google Search/Gemini AI competitive threat as structural, not cyclical.
• Tariff front-running data continues to accumulate: Empire State Manufacturing 19.6 (4-year high vs. 7.5 est.) with prices-paid spiking to 62.6; Industrial Production +0.7% led by auto +3.7% surge; Atlanta Fed GDPNow tracking Q2 at 3.99%. The apparent economic strength is front-running artifact — a demand air-pocket risk when orders normalize in Q3 that paradoxically gives Warsh a day-one data set that argues against accommodation.
KEY THEMES
1. Stagflation signal confirmed, not debated — Friday’s cross-asset print is the cleanest stagflation signature since H2 2022: equities, bonds, gold, and copper falling simultaneously while oil, the dollar, and long-end yields rose. Three independent inflation channels are now active and compounding — the Hormuz oil shock, the tariff stalemate on Chinese goods, and tariff-front-running-driven prices-paid acceleration (Empire State 62.6, a 12-point spike) — none of which are near-term reversible without diplomatic breakthroughs that today’s summit outcome makes meaningfully less likely.
2. Warsh inherits maximum policy contradiction on day one — Trump installed a hawkish Fed Chair to fight inflation while relying on tariffs that generate it. Warsh’s first policy communication must navigate a trap: validating the bond market’s >50% hike-odds pricing risks alienating an administration that expects accommodation; deferring to “data dependency” risks bond-market credibility when the data unambiguously argue against easing. Every rate-sensitive sector — REITs, utilities, homebuilders, long-duration tech — sits in binary suspension pending his first statement.
3. China trade stalemate creates a structural portfolio bifurcation — The summit’s non-outcome bifurcates the S&P 500 into two sustained camps with months of runway: beneficiaries of continued trade disruption (Energy +33% YTD, domestic-focused industrials, MSFT-type relative-value tech) vs. persistent losers (semiconductor export-control names, silver/copper/Basic Materials, Tesla China-revenue exposure). With the next formal diplomatic window not until fall 2026, this is not a one-day rotation but a structural allocation decision that portfolio managers must make under sustained uncertainty.
B. MARKET DATA -> TOP
Markets sold off broadly Friday after a US-China summit in Beijing delivered no concrete policy breakthroughs, sending the S&P 500 down 1.24% and the Nasdaq 100 shedding 1.54% in near-uniform weakness — 10 of 11 sectors closed red. Semiconductor leaders (Micron, Intel, AMD down 5–7%) led the decline as profit-takers locked in parabolic year-to-date gains ahead of NVIDIA’s May 20 earnings report. Energy was the lone exception, gaining +1.36% as WTI crude surged 4.26% on Strait of Hormuz supply disruptions and stalled US-Iran talks. The day’s defining tension: oil, the 10-year Treasury yield (+14 bps to 4.60%), and the dollar all rose simultaneously while equities fell — a stagflationary combination that bond markets are pricing in earnest, not dismissing as noise.
CLOSING PRICES – Friday, May 15, 2026:
MAJOR INDICES
Today’s broad selloff left market-structure signals partially constructive: Dow Theory bull confirmation emerges for the first time this cycle — both DJIA and DJTA remain within 2% of their 10-session highs despite the selloff, suggesting a correction within a trend rather than a breakdown. Less reassuring: S&P 500 has outpaced Russell 2000 by 3.0 percentage points over 10 sessions, crossing the narrow mega-cap leadership threshold for the first time this cycle. DJTA’s +0.38% gain against the Dow’s -1.07% decline is the session’s most telling anomaly — transports refusing to confirm the industrial selloff.
| Index | Close | Change | %Move | Why It Moved |
|---|---|---|---|---|
| S&P 500 | 7,408.50 | -92.74 | -1.24% | Trump-Xi summit yielded no policy breakthroughs; semiconductor profit-taking (chip leaders -5 to -7%) ahead of NVIDIA May 20 earnings amplified selling; 10Y yield surge (+14 bps) pressured valuations |
| Dow Jones | 49,526.11 | -537.35 | -1.07% | Same macro drivers; partially buffered by energy names (XOM +3.36%, CVX +2.39%); blue-chip mix less exposed to chip sector rout than Nasdaq |
| DJ Transportation | 20,134.2 | +76.8 | +0.38% | Bucked the selloff; bounced from 4-session lows as energy/freight transport stocks gained on crude oil surge; decoupled from broader equity weakness — the Dow Theory anomaly of the session |
| Nasdaq 100 | 29,125.20 | -455.10 | -1.54% | Chip sector rout led the decline; Micron, Intel, AMD surrendering 5–7% of parabolic YTD gains; summit disappointment amplified trade/export-control overhang for semiconductor names |
| Russell 2000 | 2,794.75 | -68.34 | -2.39% | Worst major index; small-caps more sensitive to rising rates and tariff uncertainty; higher 10Y yield weighs disproportionately on smaller, more leveraged balance sheets |
| NYSE Composite | 22,799.43 | -302.42 | -1.31% | Broad market selloff; energy sector names provided partial offset; overall breadth confirms a 10-of-11-sector red day driven by the yield spike and summit disappointment |
VOLATILITY & TREASURIES
VIX rose 6.72% to 18.42 while 10Y yields surged 14 bps — the classic inflation-fear signature; in a recession scare, bonds catch a bid and yields fall. Instead, the curve steepened (10Y +14.4 bps vs 2Y +8.3 bps), with the long end repricing durable inflation risk from an oil shock and tariff stalemate. The dollar’s simultaneous +0.49% gain confirms a flight-to-safety bid channeling into USD rather than Treasuries — bond markets are not providing refuge today.
| Instrument | Level | Change | Why It Moved |
|---|---|---|---|
| VIX | 18.42 | +1.16 (+6.72%) | Summit uncertainty and Hormuz geopolitical risk lifted the options fear gauge; elevated but contained — not a panic reading; consistent with inflation-driven uncertainty rather than recession fear |
| 10-Year Treasury Yield | 4.601% | +14.4 bps | Inflation expectations ratcheting higher: oil surge (+4.26%) + trade tariff stalemate signals persistent price pressure; term premium expanding as the long end sells off sharply |
| 2-Year Treasury Yield | 4.075% | +8.3 bps | Near-term rate path uncertainty re-emerges; smaller move than 10Y confirms steepening — markets pricing stagflation risk in the long end, not imminent Fed action in the short end |
| US Dollar Index (DXY) | 99.30 | +0.49 (+0.49%) | Safe-haven bid and higher US real yields attracting capital flows; dollar strengthening despite equity weakness confirms inflation concern narrative, not growth collapse |
COMMODITIES
Silver’s -10.51% is today’s starkest data point — its dual role as precious and industrial metal amplified both the safe-haven retreat (dollar up, yields up) and China demand disappointment from the failed Xi-Trump summit. Copper’s -5.03% echoes the same demand pessimism. Gold’s -3.02% loss despite active Hormuz tensions confirms that the yield surge and dollar strength overwhelmed the geopolitical safe-haven bid. Bitcoin’s -2.80% tracked equities cleanly with no independent catalyst.
| Asset | Price | Change | %Move | Why It Moved |
|---|---|---|---|---|
| Gold | $4,543.82/oz | -$141.48 | -3.02% | 10Y yield surge (+14 bps) and dollar strength (+0.49%) overrode safe-haven bid; rising real rates weigh on non-yielding gold despite Hormuz geopolitical tensions |
| Silver | $76.362/oz | -$8.966 | -10.51% | Dual hit: rising dollar/yields crushed its precious metal role while China demand disappointment from the Xi-Trump summit crushed its industrial demand component (solar, electronics); outsized loss versus gold signals acute industrial demand pessimism |
| Copper | $6.2788/lb | -$0.3327 | -5.03% | China demand pessimism from US-China summit with no trade breakthroughs; copper is the most China-linked major commodity — no policy relief from Beijing equals lower demand expectations |
| Platinum | $1,983.05/oz | -$108.35 | -5.18% | Sold alongside gold/silver complex on dollar strength and yield surge; auto sector uncertainty from tariff stalemate also pressures automotive platinum catalyst demand outlook |
| Bitcoin | $79,072.0 | -$2,279.0 | -2.80% | Risk-off mode tracking equities; pre-weekend position reduction; no crypto-specific catalyst — move proportional to equity selloff, confirming BTC acting as risk proxy today |
ENERGY
WTI and Brent surged in near-lockstep (+4.26%/+3.26%) with no meaningful spread widening — confirming a global supply shock, not a regional disruption: IEA data showed Hormuz flows down ~4 million bbl/day in March-April with US-Iran negotiations stalled. Critically, oil rising while equities fell is a supply shock/cost pressure read, not demand-driven growth optimism — this is the stagflationary fingerprint of the session. Henry Hub (+2.28%) and Dutch TTF (+5.8%) add breadth, confirming the energy complex is treating geopolitical risk as a sustained inflation trade.
| Asset | Price | Change | %Move | Why It Moved |
|---|---|---|---|---|
| Crude Oil (WTI) | $105.48/bbl | +$4.31 | +4.26% | Strait of Hormuz supply disruptions; IEA confirmed ~4 million bbl/day reduction in Hormuz flows (March-April); US-Iran talks stalled; WTI on track for ~10% weekly gain |
| Crude Oil (Brent) | $109.17/bbl | +$3.45 | +3.26% | Same Hormuz supply shock as WTI; near-lockstep movement confirms the disruption is global in scope; WTI/Brent spread holding stable |
| Natural Gas (Henry Hub) | $2.960/MMBtu | +$0.066 | +2.28% | Following crude complex higher on broader energy rally; geopolitical risk premium feeding across energy commodities; LNG export demand sensitivity adds upward pressure |
| Natural Gas (Dutch TTF) | $17.25/MMBtu | +$0.95 | +5.8% | European gas prices spiking sharply on Hormuz risk; Middle East supply uncertainty amplified for European buyers dependent on Gulf LNG; outpacing Henry Hub confirms a distinct European supply premium |
S&P 500 SECTORS
10 of 11 sectors red — the holdout, Energy (+1.36%, YTD +33.07%), exposes the session driver: an oil/geopolitical shock rotating capital into the one sector that benefits from higher crude, not broad risk-off. Basic Materials’ -4.30% is the sharpest anomaly: the 12-month leader (+47.10%) taking its worst daily hit as China demand hopes fade. Rate-sensitive pain is the session’s second vector — Utilities -2.70% and Real Estate -1.58% sold hardest among non-Materials sectors, confirming the 14-bps yield spike as the market’s secondary stress signal beneath the surface.
| Sector | 1-Day | 1-Week | 1-Month | 3-Month | 6-Month | YTD | 12-Month |
|---|---|---|---|---|---|---|---|
| Energy | +1.36% | +4.99% | +2.93% | +11.84% | +31.34% | +33.07% | +41.94% |
| Consumer Defensive | -0.45% | +0.88% | +4.07% | -4.28% | +11.32% | +10.38% | +10.16% |
| Financial | -0.72% | -0.82% | -1.52% | -1.69% | -1.33% | -3.87% | +8.01% |
| Communication Services | -0.97% | -0.94% | +4.49% | +12.14% | +12.48% | +7.96% | +38.82% |
| Healthcare | -1.41% | +0.21% | -2.10% | -7.01% | -3.82% | -5.12% | +15.06% |
| Real Estate | -1.58% | -2.95% | -1.41% | -1.13% | +3.23% | +5.77% | +6.15% |
| Technology | -1.79% | +0.53% | +12.40% | +20.96% | +14.36% | +17.59% | +43.07% |
| Consumer Cyclical | -2.07% | -3.12% | -0.61% | +0.85% | -3.57% | -2.56% | +6.02% |
| Industrials | -2.23% | -1.55% | +0.43% | -0.96% | +13.47% | +12.54% | +26.42% |
| Utilities | -2.70% | -3.11% | -6.02% | -5.70% | -1.16% | +3.66% | +15.12% |
| Basic Materials | -4.30% | -3.50% | -3.63% | -4.72% | +20.91% | +14.17% | +47.10% |
TOP MEGA-CAP MOVERS:
GAINERS
| Company | Ticker | Close | Change | Why It Moved |
|---|---|---|---|---|
| Exxon Mobil | XOM | $157.92 | +3.36% | WTI crude surged 4.26% on Strait of Hormuz supply fears; energy sector the sole S&P 500 beneficiary of today’s geopolitical oil shock |
| Microsoft | MSFT | $421.92 | +3.05% | Bill Ackman’s Pershing Square disclosed a new MSFT position while exiting Alphabet; high-conviction institutional catalyst lifted shares against the broader tech selloff |
| Chevron | CVX | $191.10 | +2.39% | Same crude surge catalyst as XOM; Chevron’s Gulf production exposure makes Hormuz supply disruption a direct revenue tailwind |
| Cisco Systems | CSCO | $118.21 | +2.32% | Continued momentum from Thursday’s 13.4% earnings surge (raised revenue and earnings outlook); investors extending the post-earnings re-rating into Friday |
| SanDisk | SNDK | $1,407.61 | +1.80% | NAND flash storage focus seen as less exposed to export-control overhang versus compute chips; bucked the semiconductor selloff as AI data center storage demand narrative remains intact |
DECLINERS
| Company | Ticker | Close | Change | Why It Moved |
|---|---|---|---|---|
| Micron Technology | MU | $724.66 | -6.62% | Profit-taking after parabolic YTD run; pre-NVIDIA May 20 earnings positioning amplifying rotation out of the chip complex; memory sector most exposed to China demand concerns from failed summit |
| Intel | INTC | $108.77 | -6.18% | Profit-taking after 214% YTD gain driven by Apple foundry deal speculation and AI server demand recovery; crowded-trade unwind ahead of NVIDIA’s May 20 earnings report |
| Advanced Micro Devices | AMD | $424.10 | -5.69% | Semiconductor profit-taking wave; AMD highly correlated with chip sector rotation; Hormuz geopolitical uncertainty raises cost pressure concerns for AI hardware supply chains |
| Lam Research | LRCX | $284.72 | -4.82% | Semiconductor equipment following the chip sector rout; capital equipment stocks amplify chipmaker moves in both directions; China demand exposure adds additional pressure |
| Tesla | TSLA | $422.24 | -4.75% | US-China summit delivered no trade policy breakthroughs; China is Tesla’s largest overseas market — a trade stalemate extending tariffs and uncertainty is a direct top-line risk |
C. HIGH-IMPACT STORIES -> TOP
BEARISH
1. Trump-Xi Day 2 Ends Without Tariff or Semiconductor Breakthroughs — S&P -1.24%, Nasdaq -1.54%, 10Y +14 bps as Stalemate Persists
The core facts:Day 2 of the Trump-Xi summit in Beijing concluded May 15 without formal agreements on tariffs, semiconductor export controls, or Taiwan. Trump claimed progress — including an aspirational commitment of up to 750 Boeing commercial jets — but Beijing’s official readout confirmed none of the specific deal terms, and no binding contracts were executed. On Taiwan, Trump deferred a decision on the $14 billion US arms package to “the next fairly short period.” The two sides agreed Xi will visit the US in fall 2026. Market reaction was immediate and broad: the S&P 500 fell -1.24%, the Nasdaq fell -1.54%, the Dow fell -0.7%, the 10-year Treasury yield surged 14 bps to 4.601%, and the dollar strengthened — a simultaneous equity-and-bond selloff consistent with a stagflation-fear signal, not a growth scare.
Why it matters:Markets entered the summit with high expectations — two days of diplomatic buildup, CEO delegations, and joint communiqués from Day 1 had priced in a substantive framework. The Day 2 outcome confirmed that the three most economically material issues remain entirely unresolved: tariffs (no rollback or pause extension announced), semiconductor export controls (no Chinese commitment to allow H200 purchases), and Taiwan (arms decision deferred). The fall Xi-US visit provides the next diplomatic window, but that is months away — during which time tariffs compound, export restrictions persist, and Nvidia’s China revenue remains impaired. The simultaneous decline in equities and bonds rules out the “flight to safety” read: this is pure inflation-fear and tariff-stalemate risk pricing, not recession hedging. Boeing’s aspirational 750-jet claim — versus Day 1’s unconfirmed 200-jet commitment, itself below the rumored 500-jet framework — signals that the administration is managing optics rather than delivering binding commercial outcomes.
What to watch:Xi’s fall US visit as the next potential formal tariff/semiconductor framework window; any follow-on Commerce Department action on semiconductor export controls in the next 30 days; Boeing for formal contract execution language — the gap between “commitment” and a binding purchase agreement is the single most measurable deliverable from the summit.
BEARISH
2. WTI Crude Surges +4.26% to $105.48 — Strait of Hormuz Fears Intensify as US-Iran Talks Stall and Summit Delivers No Enforceable Closure Agreement
The core facts:WTI crude oil surged +4.26% to $105.48/bbl on May 15, putting the benchmark on track for approximately a +10% weekly gain. Brent rose +3.26% to $109.17/bbl. The catalysts were compounding: US-Iran nuclear negotiations remain stalled with no credible timeline for a deal, the Trump-Xi summit’s Hormuz language was non-binding and absent from Beijing’s official readout, and the IEA has warned that global oil markets could remain materially undersupplied through October 2026. The Strait of Hormuz — which historically transited approximately 20 million barrels per day — has seen flows collapse to just over 2 million barrels per day since the conflict began, representing the largest sustained oil supply disruption since the 1970s energy crisis.
Why it matters:At $105+ WTI, the energy burden on US households is approaching levels historically associated with consumer spending deceleration. Three transmission channels are active simultaneously: (1) Direct cost inflation — energy-linked import prices are already running +16.3% MoM in April fuel imports; CPI’s energy component will remain elevated through at least June; (2) Margin compression — airlines, trucking, manufacturers, and retailers operating on thin margins face sustained cost headwinds with limited near-term relief; (3) Confidence destruction — elevated pump prices function as a regressive consumption tax, disproportionately impacting lower-income households and compressing retail sales in discretionary categories. Today’s +4.26% WTI move arrived on a day when both a new hawkish Fed Chair was sworn in and the 10-year yield surged 14 bps — the three-way combination of oil shock, tighter monetary leadership, and rising rates is the most challenging macro backdrop for equities since H2 2022.
What to watch:WTI for a break above $110/bbl — the level where energy economists begin modeling demand destruction as the supply-side adjustment mechanism; any US-Iran diplomatic breakthrough as the single most powerful catalyst for Hormuz reopening; June CPI (released July) for the first full monthly read of the $100+ WTI environment embedding in consumer prices.
BEARISH
3. 10-Year Treasury Yield Surges 14 bps to 4.601% — Rate-Hike Probability Breaches 50% for 2026 as Stagflation Signal Accelerates on Summit Failure and Oil Shock
The core facts:The 10-year Treasury yield surged 14.4 basis points on May 15 to 4.601%, its highest level in a year. The 30-year yield topped 5.1%, the highest in nearly a year. The 2-year yield rose only approximately 8 bps, steepening the yield curve — the long end pricing durable structural inflation, not near-term policy adjustment. CME FedWatch now prices more than 50% probability of at least one Fed rate hike before year-end 2026, a sharp reversal from under 3% probability as recently as 72 hours prior. The five-driver stack behind the move: (1) Trump-Xi Day 2 non-outcome leaves tariff inflation unresolved; (2) WTI +4.26% to $105.48 embeds energy inflation for months; (3) Kevin Warsh sworn in as hawkish Fed Chair; (4) Empire State prices-paid surging to 62.6; (5) April import prices having printed nearly double consensus (+1.9% vs. +1.0% est) on May 14.
Why it matters:A 14 bps single-session move in the 10-year well exceeds the 5 bps high-impact threshold and the yield-curve steepening carries direct consequences for every rate-sensitive sector. The simultaneous decline in equities and bonds — both falling on the same day — rules out a “flight to safety” interpretation. This is a stagflation signal: rising inflation expectations (oil + tariffs + prices-paid data) colliding with hawkish monetary leadership. The equity sectors most immediately impaired: (1) Homebuilders and REITs — 30-year mortgage rates will reprice above 7.5%, further suppressing housing transaction volumes in an already frozen market; (2) Utilities — DCF valuations compress mechanically with rising discount rates; (3) Long-duration growth equities — the Nasdaq’s -1.54% session reflects this repricing in real time. Rate-hike probability moving from under 3% to over 50% in less than a week is a structural repricing of H2 2026, not a single-day noise event.
What to watch:10Y yield for a sustained break above 4.75% as the equity market’s secondary pain threshold for rate-sensitive sector repricing; CME FedWatch September 2026 FOMC hike probability as the real-time market read on Warsh’s inaugural policy path; Warsh’s first public statement as Fed Chair — his framing of the current inflation environment will set the tone for June’s FOMC meeting.
UNCERTAIN
4. Kevin Warsh Officially Sworn In as 17th Federal Reserve Chair — Hawkish Regime Change Arrives as Markets Price 50%+ Rate-Hike Odds for 2026
The core facts:Kevin Warsh was officially sworn in as the 17th Federal Reserve Chair on May 15 as Jerome Powell’s term expired. Confirmed 54-45 — the narrowest margin in the modern era — Warsh is widely regarded as hawkish and skeptical of accommodation, with a track record of dissenting from the Bernanke Fed’s quantitative easing program. His first FOMC meeting is scheduled for June 16-17. On day one, Warsh inherits: CPI at 3.8% YoY, PPI at 6.0% YoY, April import prices at +4.2% YoY, WTI at $105.48/bbl, a 10-year yield at 4.601%, and CME FedWatch pricing >50% probability of a 2026 rate hike.
Why it matters:The institutional contradiction is at its maximum at the moment of Warsh’s installation: Trump selected a Fed Chair expected to cut rates to support growth; the data Warsh inherits argues unambiguously for policy tightening or an extended hold. Every rate-sensitive sector’s H2 2026 trajectory — REITs, utilities, homebuilders, long-duration tech — will be anchored to a single variable: does Warsh’s first public communication acknowledge the rate-hike scenario as live, or does he defer to data dependency in ways the equity market reads as dovish? A hawkish Warsh acknowledgment would validate the bond market’s current pricing and extend the 10Y’s rise toward 4.75%. A softer tone would create a short-term equity relief rally but risk credibility with bond markets already pricing tightening. The UNCERTAIN sentiment reflects genuine bi-directional uncertainty — not about the inflation data (which is unambiguously hot), but about how a brand-new Fed Chair navigates his first week of communications against a hostile data backdrop and an administration that expects accommodation.
What to watch:Warsh’s first public statement as Fed Chair — specifically whether he explicitly acknowledges the rate-hike scenario as a live possibility or defers to data dependence; June 16-17 FOMC meeting statement and dot plot as the definitive forward guidance from the new regime; 10Y yield as the real-time bond market verdict on each communication.
UNCERTAIN
5. Empire State Manufacturing Surges to 19.6 vs 7.5 est (4-Year High) — But Prices Paid Spike 12 Points to 62.6 and Delivery Times Hit 4-Year High; Tariff Front-Running Confirmed
The core facts:The Empire State Manufacturing Index surged to 19.6 for May — a 4-year high — against a consensus of 7.5. New Orders hit 22.7, also a 4-year high. However, prices paid spiked 12 points to 62.6, the sharpest back-to-back acceleration of 2026, and delivery times hit 20.4 (4-year high) while supply availability deteriorated further. The dual signal — strongest new orders and activity in four years alongside the fastest input cost acceleration in years — is the textbook footprint of tariff front-running: manufacturers pulling orders forward ahead of tariff enforcement, compressing supplier lead times and bidding up input costs simultaneously. With rate-hike odds breaching 50% for 2026 on the day of the Empire State release, the prices-paid component is the data point with the most direct monetary policy implication.
Why it matters:This week’s data stack — Import Prices +1.9% MoM, PPI +6.0% YoY, Retail Sales driven entirely by gasoline, Industrial Production led by auto front-running, Empire State prices-paid at 62.6 — converges on a single thesis: activity is being pulled forward, input costs are being bid up, and the apparent strength in economic output is a front-running artifact, not durable demand. For portfolio positioning, the Empire State data has three direct implications: (1) Manufacturing and industrial capex beneficiaries riding the front-running wave face a demand air-pocket when orders normalize — the 4-year high in new orders today represents future months’ demand consumed in advance; (2) The 62.6 prices-paid figure provides incoming Fed Chair Warsh a week-1 data point that argues against any accommodation; (3) Supply chain logistics names may benefit near-term from compressed delivery windows, but volume reversals are a H2 risk when front-running exhausts. Section E covers the full data narrative; this entry addresses the market-impact and policy implications.
What to watch:June Empire State report for the first evidence that front-running demand is exhausting; ISM Manufacturing prices-paid for May as the national-level confirmation of the regional NY signal; Q3 2026 GDP components — if front-running unwinds as expected, the Q2 GDPNow’s 4.0% tracking could see a sharp Q3 reversal.
D. MODERATE-IMPACT STORIES -> TOP
BEARISH
6. Semiconductor Sector Selloff — Intel -7%, AMD -5%, Micron -6%, Nvidia -4% as Profit-Takers Exit Parabolic YTD Gains Pre-NVDA Earnings; China Export Overhang Weighs
The core facts:The Philadelphia Semiconductor Index fell sharply on May 15 as institutional profit-takers reduced crowded positions ahead of Nvidia’s Q1 FY2027 earnings on May 20 AMC. Intel slumped -7% (up 214% YTD prior to today), AMD slid -5% (up 110% YTD), Micron Technology fell approximately -6%, and Nvidia declined -4%. Three compounding factors drove the selloff: (1) Pre-NVDA positioning — institutional investors reducing semiconductor exposure before the quarter’s largest single earnings catalyst; (2) Summit non-outcome — Day 2’s failure to secure semiconductor purchase agreements left China export-control overhang unresolved for NVDA, MU, and AMAT; (3) South Korea legislative risk — reports that Korean lawmakers are considering an AI-profit tax adding overhang to Samsung and SK Hynix, the primary HBM memory suppliers to US AI infrastructure.
Why it matters:The semiconductor sector has been the primary engine of the S&P 500’s YTD returns — Intel’s 214% YTD gain made it the index’s single best performer. When the market’s dominant sector experiences synchronized -5% to -7% declines, the index-level drag is material and the sentiment signal is amplified. Two dynamics run concurrently: (1) Rational risk reduction — with Nvidia reporting May 20, a miss on AI data center demand or an unexpected China revenue impairment would validate the profit-taking as prescient and could extend the sector selloff significantly; (2) Structural China uncertainty — the summit’s non-outcome means every chip name with China exposure (NVDA, MU, AMAT, LRCX) continues operating under export ambiguity through at least the fall Xi-US summit window. The Chinese technology companies’ “purchase hold” on H200 chips remains in effect, meaning Nvidia’s revenue recovery scenario is still conditional on future diplomacy, not current regulatory approvals.
What to watch:Nvidia Q1 FY2027 earnings May 20 AMC — data center revenue guidance and any language on China purchase commitments is the sector’s single most important near-term catalyst; Philadelphia Semiconductor Index for whether today’s selloff extends below the 20-day moving average, signaling a trend break rather than a healthy consolidation.
BULLISH
7. Ackman/Pershing Square Discloses Microsoft Stake Built Since February, Exits Alphabet Fully — MSFT +3.05% Against -1.54% Nasdaq as Relative-Value AI Thesis Takes Shape
The core facts:Bill Ackman disclosed on May 15 that Pershing Square Capital Management has been building a new Microsoft position since February, when the stock declined following its fiscal Q2 2026 earnings. The position was established at approximately 21x forward earnings — “broadly in line with the market multiple and well below Microsoft’s trading average over the last few years,” per Ackman. Simultaneously, Pershing Square fully exited its Alphabet stake, liquidating from approximately 6.1 million Class C and 678,000 Class A shares at year-end 2025 to zero in Q2 2026. Microsoft shares rose +3.05% on the disclosure, sharply outperforming the Nasdaq’s -1.54% session.
Why it matters:Ackman’s Microsoft thesis contains two embedded signals with direct portfolio implications. First, the 21x forward earnings entry point represents a relative-value bet against AI-premium multiples: by acquiring MSFT at a market multiple, Pershing Square is arguing that Microsoft’s Azure cloud, Copilot enterprise AI, and OpenAI partnership offer AI participation at a discount to pure-play infrastructure names trading at 30-40x. Second, the complete Alphabet exit is the sharper signal — Ackman zeroing out a historically core tech holding and redeploying into MSFT implies he views the Google Search/Gemini AI competitive threat as structurally material, not cyclical. The +3.05% MSFT outperformance in a broadly negative tape quantifies the institutional weight that a Pershing Square disclosure carries as a sentiment catalyst.
What to watch:Microsoft’s next earnings date for whether Azure constant-currency growth confirms the Pershing Square valuation thesis; Alphabet Q2 results for any Search revenue deceleration that validates the Ackman exit thesis; MSFT vs. GOOGL relative performance over the next 30 days as institutional investors vote on the AI competitive positioning argument.
BEARISH
8. Silver Crashes -10.51% to $77.52 — Dual China Demand Destruction and Rising Yield Signal; Gold/Silver Ratio Widens Sharply to 58.9x
The core facts:Silver spot price fell -10.51% to $77.52/oz on May 15 in one of the largest single-session declines in recent years. Gold fell a comparatively modest -1.83% to $4,564.00/oz. The gold/silver ratio widened sharply to 58.9:1 from 53.6:1 the prior session. Two distinct forces drove the asymmetric precious metals selloff: (1) Rising 10-year Treasury yields (+14 bps to 4.601%) and dollar strength destroyed the monetary metal bid — the same force that weighed on gold, but more severely on silver given its lower safe-haven premium; (2) The Trump-Xi summit’s failure to produce trade breakthroughs crushed silver’s industrial demand component — silver is a critical input for solar panels and semiconductor manufacturing, both heavily concentrated in Chinese supply chains whose demand recovery depends on trade normalization.
Why it matters:Silver’s dual identity — monetary store-of-value and industrial commodity — makes the gold/silver divergence an information-rich macro signal. Gold’s -1.83% reflects a one-dimensional repricing of the monetary metal hedge as yields rise; silver’s -10.51% reflects the simultaneous loss of its industrial demand premium as the China trade normalization thesis fails to materialize. For US portfolio managers: (1) Silver miners face direct NAV compression from the spot price move; (2) The silver collapse partially reflects demand destruction pricing for clean energy technology materials — solar panel manufacturers, which rely on silver metallization pastes, saw supply-chain cost assumptions improve but demand outlook worsen simultaneously; (3) The widening gold/silver ratio above 58x is historically consistent with periods of industrial demand suppression and risk-off macro environments — it has predictive value for subsequent equity market performance.
What to watch:Silver for a test of the $70/oz support level — a break below would signal capitulation among silver’s remaining industrial demand bulls; gold/silver ratio above 60x as the threshold historically associated with sustained industrial demand suppression; any US-Iran breakthrough as a secondary silver catalyst (easing Hormuz freight costs for Chinese industrial goods).
UNCERTAIN
9. Industrial Production April +0.7% — Auto Manufacturing Surges +3.7% on Tariff Pull-Forward; Headline Beat Masks Narrowly Based Activity With a Demand Air-Pocket Risk
The core facts:April industrial production rose +0.7% month-over-month, beating the +0.3% consensus. The headline was driven by motor vehicle and parts manufacturing surging +3.7% as automakers and dealers pull production forward ahead of tariff enforcement. Manufacturing ex-autos rose only +0.3% — in line with estimates. Total manufacturing output was up +0.5%. The auto front-running signal arrives alongside Empire State Manufacturing’s 4-year activity high and GDPNow tracking 3.99% for Q2 — a trio of readings that superficially suggests a robust industrial economy, but on closer inspection shares a common DNA: front-running tariff-induced demand. Section E covers the full data narrative; this entry addresses the market-positioning and sector implications.
Why it matters:The auto sector’s +3.7% production surge is the most tangible single evidence that tariff front-running is distorting the economic data calendar. Units produced in April to beat tariff enforcement represent future months’ demand consumed in advance — the front-running creates a demand air-pocket risk when exhausted. For sector positioning: GM and Ford benefit from elevated production volumes and inventory builds near-term, but the sustainability question will arrive by Q3. For Fed policy, the industrial production beat adds to Warsh’s inflation dashboard on day one — stronger-than-expected activity data removes any near-term justification for accommodation. The UNCERTAIN sentiment captures the genuine two-sidedness: the headline beat is real economic output that supports near-term earnings revisions for industrials, but the source is unsustainable and sets up a sequential deceleration that the market has not yet priced.
What to watch:May auto production and inventory data for the first signal that the front-running demand is normalizing; GM and Ford Q2 earnings for production guidance commentary; ISM Manufacturing PMI for May for national confirmation or contradiction of the IP and Empire State regional data.
UNCERTAIN
10. Atlanta Fed GDPNow Q2 2026 Tracking 3.99% — Fastest Quarter Since 2023, But Rate-Hike Risk and Front-Running Artifacts Create Asymmetric H2 Setup
The core facts:The Atlanta Fed GDPNow model updated its Q2 2026 tracking estimate to 3.99% today, incorporating April retail sales and industrial production data released this week. This compares to Q1 2026 actual GDP of +2.0% and would represent the strongest quarter since Q3 2023 if confirmed. The upside is being driven by front-running in auto manufacturing, headline consumer spending strength, and services resilience. Q2 is just over six weeks old, so the tracking estimate carries wide confidence intervals and will be updated as May data arrives. Section E covers the full GDPNow narrative; this entry addresses the market-positioning implications.
Why it matters:The 3.99% GDPNow creates a directly contradictory macro setup. In isolation, near-4% GDP growth is unambiguously bullish — it supports corporate revenue growth, employment, and credit quality. But in the context of CPI at 3.8%, PPI at 6.0%, and a new hawkish Fed Chair sworn in today with rate-hike odds above 50%, the GDP strength paradoxically reinforces the tightening case rather than the easing one. Warsh now faces the Fed’s textbook dual-mandate dilemma on day one: growth above trend, inflation above target. For portfolio construction, the 3.99% tracking favors cyclicals — industrials, materials, and financials benefiting from steeper curves — over defensives and duration-sensitive names. However, the oil-shock and front-running risks create an asymmetric H2 trap: if the GDPNow strength is primarily tariff-induced pull-forward that unwinds in Q3, the GDP trajectory could reverse sharply precisely when Warsh may be considering rate hikes.
What to watch:June GDPNow updates — whether the 4.0% tracking sustains after May data incorporation or begins to decelerate as front-running demand exhausts; Q2 GDP first estimate (late July) for hard confirmation; 10Y yield sustained above 4.6% as the signal that the rate-hike risk is pricing out the cyclical GDP growth dividend.
E. ECONOMY WATCH -> TOP
Hard data surged this week — Empire State Manufacturing hit a four-year high at 19.6, industrial production beat sharply, and GDPNow now tracks Q2 at nearly 4.0% — yet prices-paid indices spiked to multi-year highs, flashing a tariff front-running dynamic that could quickly reverse once pull-forward demand fades. Goldman Sachs cut its 12-month recession probability from 30% to 25% on April’s blow-out payrolls, but the simultaneous installation of hawkish new Fed Chair Kevin Warsh keeps any easing firmly off the table, with markets now pricing just 33% odds of a 2026 cut. The week’s defining tension: the data looks expansionary, the institutional posture looks stagflationary.
Kevin Warsh Becomes 11th Modern-Era Fed Chair as Powell’s Term Expires (Senate Confirmation, May 13; Sworn In May 15)
What they’re saying:Kevin Warsh was confirmed by the Senate on May 13 in a 54–45 vote — the narrowest confirmation in the modern era — and officially assumed the Fed chairmanship today as Jerome Powell’s term expired. Warsh, who previously served as the Fed’s youngest board member at age 35, returns to lead the central bank at what markets widely view as a pivotal inflation-and-growth crossroads.
The context:Warsh is widely characterized as hawkish and skeptical of premature rate cuts — a posture that aligns with the Trump administration’s inflation-fighting rhetoric, even as tariff-driven price pressures complicate that mandate. Trump allies explicitly warned against rate cuts during the confirmation process. His tenure begins with Polymarket pricing just 33% probability of any 2026 Fed easing, and FOMC Minutes from the April 29 meeting due May 20 will offer the first window into what the new chair inherits.
What to watch:Warsh’s first public remarks as chair; FOMC Minutes release (May 20); any signals on policy framework changes, particularly regarding the 2% inflation target and reaction-function under tariff-driven stagflation. Fed speeches from Paulson (May 19) and Venable (May 18, May 19) for early tone signals.
Atlanta Fed GDPNow Tracks Q2 Growth at ~4.0% — Sharpest Acceleration Since 2023 (Atlanta Fed, May 14)
What they’re saying:The Atlanta Fed’s GDPNow model estimates Q2 2026 real GDP growth at 3.99% annualized as of May 14, incorporating the week’s retail sales and industrial production data. The Q2 nowcast has climbed steadily from 3.5% on May 1 to near 4.0% — a sharp contrast to Q1’s 2.0% annualized pace.
The context:GDPNow reflects real-time hard data, not projections — the surge to 4.0% is mechanically driven by stronger-than-expected retail sales (+0.5% in April), today’s industrial production beat (+0.7%), and resilient consumer spending. The jump from Q1’s 2.0% suggests the economy may be absorbing tariff uncertainty with less damage than feared, though tariff front-running in autos and manufacturing could inflate the Q2 reading before demand reverses.
What to watch:Next GDPNow update incorporating today’s Industrial Production data; Housing Starts (May 21) and jobless claims for any growth deceleration signals.
Empire State Manufacturing Surges to 19.6 — 4-Year High — But Prices Paid Spike to 62.6 (NY Fed, May 15)
What they’re saying:The NY Fed’s Empire State Manufacturing Index jumped to 19.6 in May from 11.0 in April, blowing past the 7.5 consensus estimate — the highest reading since April 2022. New orders surged to 22.7, also the strongest in over four years. However, the prices paid index spiked 12 points to 62.6, the sharpest back-to-back acceleration this year, and future business conditions rose 14 points to 33.5 with more than half of respondents expecting further improvement.
The context:The simultaneous surge in new orders and prices paid is the textbook tariff front-running pattern — manufacturers are pulling forward orders before expected tariff escalations lift input costs. The activity surge is real but likely temporary; the price acceleration is the signal the Fed is watching. Employment levels continued to increase, providing near-term support for the labor market reading.
What to watch:Philadelphia Fed Manufacturing Index (May 21, prior 26.7) for regional confirmation; ISM Manufacturing (early June) for national scope; prices-paid trajectory as the primary Fed-sensitive signal.
Industrial Production +0.7% in April — Broad Beat Led by Auto Surge (Federal Reserve G.17, May 15)
What they’re saying:Total industrial production rose 0.7% in April (vs. +0.3% consensus, prior -0.3%), with manufacturing up 0.6% (vs. +0.2% est.). Motor vehicle and parts output surged 3.7%, the single largest contributor to the monthly gain. Capacity utilization moved up to 76.1% (vs. 75.8% est.), and total production is now 1.4% above its year-earlier level.
The context:The April rebound is unambiguous on its face — a sharp reversal from March’s -0.3% decline — but the dominant driver tells a more nuanced story. Auto production’s 3.7% jump almost certainly reflects tariff pull-forward as manufacturers and dealers front-run supply chain disruptions; manufacturing ex-autos rose a more modest 0.3%. Capacity utilization at 76.1% remains 3.3 percentage points below its long-run average, indicating substantial slack that constrains pricing power outside of tariff-impacted sectors.
What to watch:May Industrial Production data (mid-June) for whether auto pull-forward reverses; Durable Goods Orders (late May) for business investment signals; manufacturing ex-autos as the clean growth proxy.
Goldman Sachs Cuts 12-Month Recession Probability to 25%, Citing April Jobs Resilience (Goldman Sachs, May 12)
What they’re saying:Goldman Sachs reduced its 12-month US recession probability by 5 percentage points to 25% in a May 12 update, crediting April’s nonfarm payrolls of +115,000 (vs. 65,000 expected) and a steady 4.3% unemployment rate. Oil prices from Middle East tensions did not escalate as previously feared, removing one downside scenario from Goldman’s base case. The bank simultaneously pushed back its expectation for Fed rate cuts.
The context:Goldman had raised recession odds to 30% in March 2026 after oil prices spiked on Middle East tensions and the labor market showed signs of stalling. The reversal to 25% reflects data stabilization, not resolution of structural risks — tariff-driven inflation, fiscal drag, and 2027 recession odds on prediction markets running at 41% all remain. At 25%, Goldman remains materially above its historical base-case range of 10–15%, signaling ongoing uncertainty even in the improved scenario.
What to watch:Next Goldman GDP and recession probability update; Initial Jobless Claims (May 21, prior 211K) for any labor deterioration; University of Michigan Consumer Sentiment preliminary (May 16) for forward consumer stress signals.
F. EARNINGS WATCH -> TOP
YESTERDAY AFTER THE BELL (Markets Reacted Today)
BULLISH
11. Applied Materials (AMAT): +4.12% | Record Revenue and 25-Year-High Gross Margins Confirm AI Equipment Supercycle Against Macro Headwinds
The Numbers:Q2 FY2026 revenue: $7.91 billion (record, +11.4% YoY) vs. $7.82B est. Non-GAAP EPS: $2.86 vs. $2.71 est. GAAP EPS: $3.51 (+33.5% YoY). Gross margin: 49.9% — the highest in more than 25 years. Q3 FY2026 guidance: $8.95B revenue (above current consensus). Chip equipment business expected to grow >30% for full-year 2026. Quarterly cash dividend raised 15% — ninth consecutive year of dividend increases. Released: AMC May 14.
The Problem/Win:Record revenue and the highest gross margin in a quarter-century validate AMAT’s pricing power within the AI infrastructure buildout. The Q3 guidance of $8.95B — above consensus at the time of reporting — signals that AI-driven equipment demand is accelerating, not plateauing. Management cited the rapid hyperscaler AI build-out as driving the chip equipment cycle beyond 30% growth for 2026. The results arrived one session after Cisco’s $9 billion AI networking order raise and confirm that the AI capex cycle is broadening from compute (NVDA) to networking (CSCO) to upstream fabrication equipment (AMAT).
The Ripple:AMAT’s +4.12% session in a Nasdaq -1.54% tape quantifies the resilience of AI equipment demand against macro headwinds — a meaningful divergence. Peers KLA Corporation (KLAC), Lam Research (LRCX), and ASML benefit from the same AI-driven demand confirmation. AMAT’s outperformance adds conviction to the “AI capex is real and accelerating” thesis that Cisco and Nvidia have validated this week, providing a partial offset to today’s broader semiconductor sector selloff in discretionary names (Intel -7%, AMD -5%).
What It Means:AMAT’s record Q2 results and Q3 guidance above consensus confirm the upstream semiconductor equipment cycle is being driven by genuine hyperscaler AI capex commitments — not inventory restocking or speculative build. For portfolio managers, AMAT combines record margins, dividend growth, and multi-year equipment demand visibility with a structural advantage over GPU manufacturers: its revenue is not subject to China export-restriction risk, as its primary customers are US-based hyperscalers.
What to watch:Nvidia Q1 FY2027 earnings May 20 AMC for whether hyperscaler AI capex commentary confirms AMAT’s demand trajectory; KLAC and LRCX upcoming results for whether the 25-year-high margin and record revenue profile is sector-wide or AMAT-specific.
TODAY BEFORE THE BELL (Markets Already Reacted)
No major earnings before the bell from companies with >$100B market cap.
TODAY AFTER THE BELL (Markets React Tomorrow)
No major earnings after the bell from US-domiciled companies with >$100B market cap. (Mitsubishi UFJ Financial Group and Mizuho Financial Group report AMC — both excluded as ADRs.)
WEEK AHEAD PREVIEW:
Q1 2026 earnings season is in its final stretch (~89% of S&P 500 reported). Next week’s calendar includes several market-moving reporters, headlined by Nvidia’s AI infrastructure report on Wednesday.
Home Depot (HD) — BMO, Tuesday May 19 — Key focus: Big-box home improvement demand in a frozen housing market (30-year mortgage rates above 7.5%), lumber and building materials tariff cost pass-through, and Pro contractor segment as existing home sales remain near cycle lows. Consensus EPS: $3.41.
NVIDIA Corp (NVDA) — AMC, Wednesday May 20 — Key focus: Q1 FY2027 data center revenue and Q2 guidance; updated China revenue outlook following the summit’s failure to unlock H200 purchases (Chinese tech companies’ “purchase hold” remains in effect); Blackwell GPU shipment ramp and supply chain status; whether management guidance addresses the now-confirmed AI capex acceleration from Cisco and AMAT. Consensus EPS: $1.75. The quarter’s single most important earnings catalyst. Market cap: $5.5T.
Analog Devices (ADI) — BMO, Wednesday May 20 — Key focus: Industrial and data center analog chip demand recovery from the 2024-2025 inventory correction cycle; automotive chip exposure relevant given today’s tariff front-running in auto production; any commentary on the pace of industrial capex return. Consensus EPS: $2.89.
TJX Companies (TJX) — BMO, Wednesday May 20 — Key focus: Consumer discretionary traffic trends amid the energy price squeeze (WTI now $105+); off-price retailer ability to capitalize on tariff-driven merchandise surpluses and overstocked inventory from goods importers; comp store sales in the current consumer environment. Consensus EPS: $1.02.
Lowe’s Companies (LOW) — BMO, Wednesday May 20 — Key focus: Home improvement demand mirror to Home Depot; Pro contractor segment activity; materials tariff cost absorption; guidance on housing-adjacent spending as mortgage rates constrain transaction volumes. Consensus EPS: $2.97.
Intuit (INTU) — AMC, Wednesday May 20 — Key focus: SMB spending environment in a tariff-inflation backdrop; AI-powered platform adoption growth (Copilot for accountants, QuickBooks AI); late-season TurboTax filing trends; any guidance update on platform monetization given rising SMB cost pressures. Consensus EPS: $12.57.
Walmart (WMT) — BMO, Thursday May 21 — Key focus: Tariff cost pass-through messaging and pricing strategy (CFO already warned consumers “could start to see higher prices as soon as later this month”); Q1 comparable sales and e-commerce growth trajectory; full-year EPS guidance update given oil and tariff headwinds; inventory positioning ahead of anticipated tariff-driven supply disruptions. Consensus EPS: $0.66.
Deere & Company (DE) — BMO, Thursday May 21 — Key focus: Farm equipment demand and order backlog amid commodity price volatility driven by the Iran-war energy shock; precision agriculture technology adoption rates; construction equipment demand against an uncertain infrastructure spending backdrop; any guidance revision reflecting farmer income sensitivity to energy costs. Consensus EPS: $5.70.
University of Michigan Consumer Sentiment (preliminary) is also scheduled for Friday May 16 — the first read on consumer confidence under the new Warsh Fed and following the Trump-Xi summit disappointment.
G. WHAT’S NEXT -> TOP
UPCOMING RELEASES:
| Date | Event | Why It Matters |
|---|---|---|
| Mon, May 18 | Fed Governor Venable Speech | First Fed communication in the Warsh era — Venable’s tone (hawkish vs. data-dependent) provides an early read on the new Fed’s inflation reaction function ahead of the June 16-17 FOMC. |
| Mon, May 18 | NAHB Housing Market Index (prior 34) | A 14-bps 10Y surge and a 30Y above 5.1% will compress builder sentiment further; reading below 34 would confirm that rising mortgage rates are freezing housing activity ahead of the spring selling season. |
| Mon, May 18 | Net Long-term TIC Flows / Overall Net Capital Flows | Critical with the 10Y at 4.601% — measures foreign demand for US Treasuries; a decline in foreign buying would amplify the bond selloff narrative and put additional upward pressure on long-end yields. |
| Tue, May 19 | ADP Employment Change Weekly (prior 33.0K) | High-frequency labor signal in the context of Goldman’s revised 25% recession probability; a sharp miss would raise doubts about the 3.99% GDPNow tracking and could temper rate-hike odds slightly. |
| Tue, May 19 | Fed Governor Paulson Speech; Fed Governor Venable Speech | Second round of Fed communications under Warsh; any coordinated hawkish tone from multiple governors would validate the bond market’s >50% hike-odds pricing and extend the 10Y selloff toward 4.75%. |
| Wed, May 20 | FOMC Minutes (Apr 29 meeting) | The most anticipated release of the week — reveals whether the April 29 FOMC seriously discussed tightening before Warsh’s arrival. Any reference to rate-hike scenarios would validate the dramatic shift in hike-odds pricing and cement the policy pivot narrative for H2 2026. |
| Thu, May 21 | Housing Starts (prior 1.502M) / Building Permits Prel (prior 1.363M) | With 30Y mortgage rates repricing above 7.5%, housing starts are a direct read on rate sensitivity in the real economy. A significant miss would confirm that the yield spike is already impacting forward supply pipelines. |
| Thu, May 21 | Initial Jobless Claims (prior 211K) | Key labor market barometer; a sustained move above 230K would signal that tariff uncertainty and oil cost pressures are beginning to crack hiring — the most direct challenge to the 3.99% GDPNow growth thesis. |
| Thu, May 21 | Philadelphia Fed Manufacturing Index (prior 26.7) | Regional confirmation of Empire State’s tariff front-running signal; prices-paid component is the Fed-sensitive variable — another print above 60 would strengthen the stagflation case and add pressure on Warsh ahead of the June FOMC. |
KEY QUESTIONS:
1. Will Warsh’s first public statement explicitly acknowledge the rate-hike scenario as live — validating bond market pricing and extending the 10Y toward 4.75% — or will he defer to “data dependency” in language the equity market reads as dovish relief?
2. Do the May 20 FOMC Minutes reveal that the April 29 meeting seriously debated tightening, cementing the rate-hike narrative, or do they reflect a still-dovish Committee that Warsh’s arrival is now pivoting away from?
3. Can ADP (Tue) and Jobless Claims (Thu) show labor market resilience sufficient to sustain the 3.99% GDPNow thesis, or does the combination of oil shock, rising rates, and tariff uncertainty begin cracking demand in the first hard labor data of the Warsh era?
H. CHART OF THE DAY -> TOP
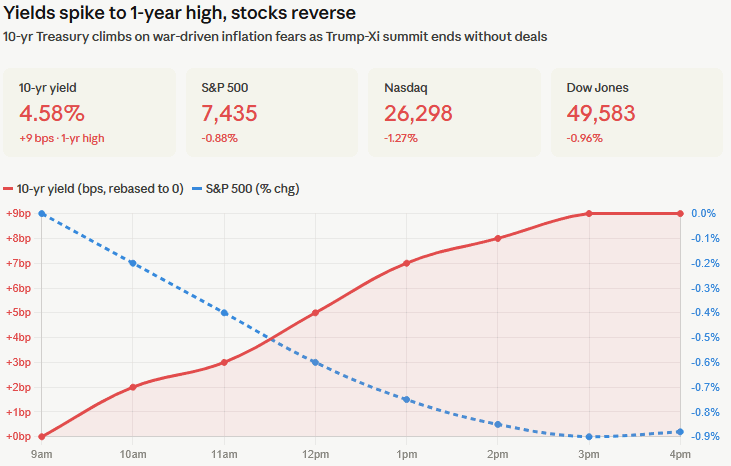
Chart of the Day: Thursday’s euphoria evaporated fast. The S&P 500 had just crossed 7,500, the Dow cracked 50,000, and AI stocks were flying on Trump-Xi optimism. Then Friday arrived with the bill. The Beijing summit closed without a single concrete deal, removing the catalyst that drove Thursday’s S&P 500 to a record. Oil crept higher. The week’s inflation data — hottest CPI in nearly three years, PPI at its fastest since 2022 — suddenly felt very loud. The 10-year yield surged 9 basis points to 4.58%, a one-year high. Markets repriced aggressively. Rate cuts are fully priced out; over half the market now bets on a hike before December. Tech sold off. The record close became a one-day wonder.
Market Intelligence Brief (MIB) Ver. 17.99
For professional investors only. Not investment advice.
© 2026 RecessionALERT.com
Comments are closed.