
This page is a quick overview of the SuperIndex components in the weekly Recession Forecasting Ensemble (RFE) report, which is one of 9 reports we publish. To see recent examples of the other 8 reports we publish, go to the OUR SERVICE menu. There are detailed descriptions inside the SuperIndex report that explain each chart in detail (a built-in user-guide.) There are 12 main sections to the weekly published SuperIndex report and we just highlight 7 of them below. You can download a more recent sample in the OUR SERVICE menu.
1. SuperIndex construction
The “short-leading” and “co-incident” Weekly SuperIndex composites are two of the six components of the Recession Forecasting Ensemble and are constructed from weighted averages of 9 underlying leading and co-incident composite indexes, namely :
- Philly Feds’ Aruoba-Diebold-Scotti Business Conditions Index (ADS)
- Philly Feds’ Business Outlook Survey
- e-forecasting.com eLEI,
- Monthly GDP index
- Our Monthly Leading Index (USMLI)
- Our Leading Employment Index,
- Chicago Fed National Activity Index (CFNAI),
- Our Weekly Leading Index (WLEI)
- Our Leading Manufacturing Index
The SuperIndexes serve as comprehensive “real-time” views on the U.S Economy from varying aspects as they are updated 21-25 times per month as the underlying data become available. Using 9-factor multivariate recession probability models, a detailed Weekly Recession Forecast is published every Monday for subscribers. The models make definitive calls to the start/end of NBER recession dates, up to 12 months before the National Bureau of Economic Research (NBER ) themselves proclaim these dates. The NBER is the official arbiter of U.S recessions, but they often proclaim recession starts and ends 12-18 months after they have occurred, which is too late to be useful to the stock market participant.
Our short-leading SuperIndex recession signals give on average 3 months real-time advance warning of U.S recession. These warnings precede peak-to-trough drops on the US stock markets of 30% on average since 1967 as shown below with the last two U.S recessions where probability of recession (ranges from 0 to 1 on left axis) within 3 months (black line) and hard recession calls (red line) are displayed together.

When the probability of recession within 3 months rises above the green dotted line, we call a recession.We provide “hard calls” to recession starts and ends as we understand how frustrating it is to decide what to do when faced with a “60% probability of recession”. And with many observers agreeing that the age of the “Great Moderation” is over and that recessions are most likely going to revert back to occurring once every 3-4 years, recession forecasting and risk management is going to be increasingly important to stock market participants. RecessionAlert’ s 9-factor short-leading recession models capture up to 99% of all historical recession months since 1967 with zero false positives.
2. SuperIndex History
You can also view the long term history of the Leading SuperIndex and its associated probability of recession & recession calls. The leading SuperIndex below is representative of future U.S economic growth and when it drops below the red recession dating line, it warns of recession in 3-4 months time. The Leading SuperIndex forms the basis of our “Short Leading” recession and economic indicator.

Leading SuperIndex History
3.Tracking the Expansion/Contraction
During economic expansion, we track the progress of the co-incident SuperIndex versus all prior recessions to gauge relative strength of economic growth (weak growth leaves us vulnerable to external shocks) and risks of approaching the peak of the economic cycle (for market timing purposes.) During contraction, we perform the same task to gauge relative weakness of the contraction and the odds of approaching an economic trough.
Tracking the U.S Economy
4.GDP Forecasting
The co-incident SuperIndex is highly correlated to economic metrics such as GDP and can thus be used for monthly forecasting. The image below shows how we forecast and track GDP. The instructions of how this works is shown in the text box to the right of the charts. These description boxes are embedded throughout the Recession Forecast Report so that you never need to consult a user-guide or help screen when attempting to interpret charts.

Forecasting Real GDP with SuperIndexes
5. Weekly Update Schedule
The US Economic Growth SuperIndex is updated up to 21 to 24 times per month according to a fixed schedule as shown below when the underlying data becomes available. The example shows the month of May 2012 and each respective week is surrounded by a border line.
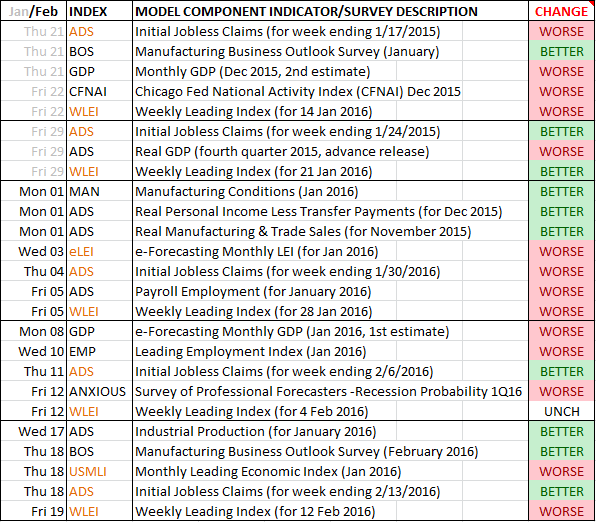
The schedule demonstrated above changes on a monthly basis depending on weekends, holidays etc. The table gets changed in the last week of the month to reflect the next months update schedule. Lightly shaded components have been published and included into all the relevant SuperIndex and RFE models. The important leading indicators are highlighted in orange. The CHANGE column highlights the change the respective factor/indicator has imparted on the SuperIndexes compared to the prior reading. DOWN means it has pulled the SuperIndexes down, raising the probability of recession. UP means the component had a positive effect on the SuperIndexes, lowering the probabilities of recession. UNCH means the sub-component made virtually no change.
6. Recession Forecasting Ensemble (RFE) Models
In addition to the Leading SuperIndex discussed above there is a section in the report showing the status of the other Recession Forecasting Ensemble (RFE) components. There is the Headwinds Index, the Anxiety Index, the SuperIndex co-incident indicator, the SuperIndex Diffusion Index and the SuperIndex Recession Syndrome Index. You can view descriptions and samples of these at the Recession Forecasting Ensemble and US Market Timing research page.
7. Weekly Readings and Historical Time Series
Subscribers also receive a weekly SuperIndex and probability time-series with chart as displayed below. They can then incorporate the weekly time series data into their own models and forecasts. Subscribers to the Professional service plan also get a monthly historic time series of all the 6 RFE components.

SuperIndex Weekly Readings and Time Series
8. Download Sample Weekly Recession Forecast Report
You can download all the recent no-obligation sample reports from the OUR SERVICE menu. Should you then wish to subscribe to the service simply navigate to the Subscribe page on our website. To read the reports you need the free Adobe PDF Reader