
MIB WEEKLY DIGEST
Week of Sep 14–18, 2026
The Federal Reserve raised rates for the first time since 2023 and signalled more, sending the 2-year yield up 12.4 bps and the 10-year to its first closes above 5% before a Friday retreat to 4.998%. The Nasdaq 100 (+0.94%) was the only major index higher as an AI-safety essay lifted CrowdStrike 14.95% on the week while chip equipment crashed and then recovered most of the loss. Bank of America’s fee warning and a delayed OpenAI IPO sank Goldman Sachs 8.47%. Diesel set successive records even as WTI slipped back to $99.52, and the Bank of Japan hiked to a 31-year high of 1.25%.
TABLE OF CONTENTS
A. WEEK AT A GLANCE
B. WEEK IN MARKETS
C. WEEK’S TOP STORIES (10)
D. WEEK IN THE ECONOMY (5)
E. WEEK IN EARNINGS (0)
F. NEXT WEEK SETUP
G. CHART OF THE WEEK
A. WEEK AT A GLANCE -> TOP
The S&P 500 finished flat (−0.08%) and the Dow fell 1.69% in a week defined by the Federal Reserve’s first rate increase since 2023, with the Nasdaq 100 (+0.94%) the only major index to gain. The hike itself was priced; what moved markets was its path — the 2-year rose 12.4 bps and the 10-year posted its first closes above 5% — while an AI-safety essay reshuffled technology and financials absorbed a string of fee warnings. With London and Tokyo leaning hawkish in the same 72 hours and diesel at record highs, the week read as a global tightening cycle arriving on top of an energy shock no central bank can fix.
• Fed hikes to 3.75%–4.00%, signals more — a unanimous vote Wednesday with 12 of 18 officials expecting another increase; the 2-year rose 12.4 bps on the week to 4.754% and the 10-year closed above 5% on Tuesday and Wednesday before ending at 4.998%.
• Thursday’s relief rally was the week’s biggest swing — the VIX fell 12.82% and the Nasdaq 100 rose 1.73% the day after the hike, only for yields to resume climbing Friday.
• CrowdStrike +14.95% led; Goldman Sachs −8.47% trailed — an AI-safety essay drove the cybersecurity leaders, while six of the eight worst mega-caps were banks or card lenders after Bank of America’s fee warning and OpenAI’s IPO delay.
• Diesel hit a record $6.45 while WTI slipped to $99.52 — crude round-tripped from $105.55 on Saudi pipeline and Hormuz news, but the refined-product squeeze hit J.B. Hunt (−13.30%) and the transports (−2.66% on the week).
• Retail sales +1.2%, import prices +7.0% year on year — the week’s two biggest prints gave the Fed both its growth cover and its inflation case.
• Bitcoin +4.90% to $81,095 — despite the Senate killing the CLARITY Act on Tuesday, as regulators opened agency routes and Friday’s short squeeze took it back above $80,000.
1. The Path, Not the Hike — and Not Just in America — A fully priced Fed move still pushed the 2-year up nearly five times as far as the 10-year, the Bank of England and Bank of Japan leaned the same way within 72 hours, and July’s data showed foreign buyers had already turned sellers of US paper — synchronised tightening meeting a thinner foreign bid.
2. The Energy Shock Left the Barrel — Crude finished the week lower while diesel set records, import prices hit a four-year high and a trucking bellwether cut its outlook on fuel and driver costs, so the inflation transmission now runs through refining margins and freight rather than the WTI print the market watches.
3. Supply Gets Bought, Funding Gets Charged — The same higher discount rate that cut Wall Street’s fee outlook forced CoreWeave to concede on price and dilution, yet memory and chip-equipment makers led the tape — investors will own the physical scarcity in AI while charging hard for the balance sheets that finance it.
 — Leading economic indicators. Accurate market forecasts. Apply for membership at join.recessionalert.com
B. WEEK IN MARKETS -> TOP
The Federal Reserve’s first rate increase since 2023 — a unanimous quarter-point move to 3.75%–4.00% on Wednesday, with 12 of 18 officials pencilling in another — set the week’s shape: two defensive sessions into the decision, a sharp relief rally on Thursday, and a Friday bond selloff that pushed the 10-year back to the edge of 5%. Running alongside it, Anthropic chief Dario Amodei’s weekend call to “pace the frontier” split the AI trade on Monday, crushing chip-equipment makers and lifting cybersecurity, before memory and semiconductors reclaimed leadership by Friday. Breadth was poor throughout: the Nasdaq 100 was the only major index to gain, eight of eleven sectors fell, and financials took the heaviest losses after Bank of America’s fee warning. The sharpest divergence sat in energy — crude finished below $100 while diesel set successive all-time highs, the gap that broke the transports on Wednesday.
FRIDAY CLOSE & WEEK-ON-WEEK CHANGE — Fri, Sep 18, 2026:
MAJOR INDICES
Wednesday produced the week’s one formal Dow Theory warning: transports sank 2.78% against 1.21% for the industrials as J.B. Hunt blamed driver and diesel costs — a margin shock rather than a volume collapse, which is why the break did not compound into Friday. The larger split was compositional, not cap-based: the Nasdaq 100 finished as the lone gainer while the bank-heavy Dow absorbed the week’s fee warnings, and the S&P 500’s near-flat close conceals a Monday-to-Wednesday drawdown that Thursday repaid in a single session.
| Index | Fri Close | WoW Change | WoW % | Why It Moved (Week) |
|---|---|---|---|---|
| S&P 500 | 7,650.50 | −6.48 | −0.08% | Round trip around the Fed: three straight declines took it to 7,551.81 on hike day, Thursday’s chip-led relief rally recovered 1.14%, and Friday’s Technology-only advance left it essentially flat. |
| Dow Jones | 51,682.64 | −890.65 | −1.69% | Financials did the damage — Bank of America’s Monday fee warning, Goldman Sachs’s OpenAI-IPO and trading hits, then a 1.21% slide on hike day — with no offsetting leadership from its cyclicals. |
| DJ Transportation | 20,079.10 | −549.17 | −2.66% | Wednesday’s 2.78% plunge on J.B. Hunt’s earnings warning and airlines flagging fuel-driven capacity cuts accounts for the whole weekly loss; record diesel kept freight costs the swing variable. |
| Nasdaq 100 | 29,644.17 | +275.73 | +0.94% | The only major index higher: Monday’s AI-pacing selloff in chip equipment was more than reversed by the Thursday–Friday memory and semiconductor rebound (Intel, AMD, Micron, Sandisk). |
| Russell 2000 | 2,860.40 | −43.54 | −1.50% | Lower in four of five sessions as the 10-year sat near 5%; small-caps joined Thursday’s relief rally only weakly and sat out Friday’s tech-led gain. |
| NYSE Composite | 23,998.89 | −332.67 | −1.37% | The broad tape told the real story: eight of eleven sectors fell on the week, with financials, energy and rate-sensitive groups outweighing a narrow technology advance. |
VOLATILITY & TREASURIES
The curve carried the week’s policy message: the 2-year added 12.4 bps against 2.6 for the 10-year, pulling 2s10s in by roughly ten points to about 24 — tightening priced at the front end, not term premium at the back. From Thursday onward volatility and bonds disagreed outright, the VIX finishing below last Friday’s level while the 10-year closed within a hair of 5%. Wednesday’s hike and a dot plot with 12 of 18 officials wanting another move were the trigger; the dollar’s climb through 100 marks a rates-driven bid, not a haven one.
| Instrument | Fri Level | WoW Change | Why It Moved (Week) |
|---|---|---|---|
| VIX | 14.81 | −1.03 (−6.50%) | Climbed into Wednesday’s decision to a 17.71 close, then collapsed 12.82% Thursday as hedges were unwound; ended the week lower despite higher yields. |
| 10-Year Treasury Yield | 4.998% | +2.6 bps | Closed above 5% on Tuesday (5.006%) and Wednesday (5.021%) around the hike; Thursday’s 6.7 bp relief was undone Friday as Bank of America warned of a “2022 redux.” |
| 2-Year Treasury Yield | 4.754% | +12.4 bps | Led the curve: 7.3 bps on hike day as the dot plot signalled another increase, and 6.4 bps more Friday as swaps priced further tightening. |
| US Dollar Index (DXY) | 100.20 | +1.07 (+1.08%) | Broke above 100 on Wednesday’s hike and held there — a policy-divergence bid rather than a haven flow, since gold also finished the week higher. |
COMMODITIES
Metals traced a V around the Fed: all four stood below last Friday’s close at Wednesday’s settlement and all four finished the week higher, silver and copper ahead of gold — an industrial read, not a haven one. That no safe-haven bid appeared while tankers were being struck near Hormuz says the Gulf shock was priced through rates and the dollar rather than through fear. Bitcoin followed its own legislative calendar instead of the equity tape, sliding on Tuesday’s failed CLARITY Act vote and recovering on Friday’s short squeeze.
| Asset | Fri Price | WoW Change | WoW % | Why It Moved (Week) |
|---|---|---|---|---|
| Gold | $4,416.35/oz | +$26.35 | +0.60% | Fell three sessions to $4,299.25 as hike bets and the dollar dominated, then recovered about $117 over Thursday–Friday once the hawkish shock was absorbed. |
| Silver | $66.77/oz | +$1.75 | +2.69% | Recovered Monday’s 2.29% drop and more on an industrial-demand bid in the Thursday–Friday risk-on sessions. |
| Copper | $6.7125/lb | +$0.1525 | +2.32% | Shrugged off a 2.31% Monday drop and the rate hike to close at its best level of the week. |
| Platinum | $1,804.60/oz | +$3.00 | +0.17% | Essentially unchanged after tracking the precious-metals complex down into Wednesday and back by Friday. |
| Bitcoin | $81,095 | +$3,790 | +4.90% | Fell 3.84% Tuesday when the Senate’s CLARITY Act cloture vote failed, then jumped 6.15% Friday back above $80,000 in a short-covering rally with spot-ETF inflows returning. |
ENERGY
Crude made a full round trip while refined product did not: WTI peaked Tuesday and closed the week under $100, yet the national diesel average set successive records through Friday. That split locates the Gulf disruption in refining and freight rather than in the barrel — the outage at Saudi Arabia’s East-West pipeline and the stalled Hormuz talks lifted crude early, and reports of a partial restoration within days took it back out. European gas decoupled from both, falling mid-week on storage before a late rebound.
| Asset | Fri Price | WoW Change | WoW % | Why It Moved (Week) |
|---|---|---|---|---|
| Crude Oil (WTI) | $99.52/bbl | −$0.47 | −0.47% | Round trip: Monday’s postponed Hormuz talks and the offline Saudi pipeline lifted it to $105.55 on Tuesday; reports of half the line returning within days drove three straight declines. |
| Crude Oil (Brent) | $103.19/bbl | −$1.28 | −1.23% | Same arc as WTI with a lower peak ($108.49 Tuesday); a claimed Iranian strike on a tanker Friday failed to lift it. |
| Natural Gas (Henry Hub) | $2.899/MMBtu | +$0.079 | +2.80% | Gained with crude early in the week and held most of it; Thursday’s tighter-than-expected 44 Bcf storage injection offered support. |
| Natural Gas (Dutch TTF) | $26.72/MMBtu | −$0.99 | −3.57% | Slid through midweek on ample European storage before a 4.05% Friday rebound; moved independently of crude for most of the week. |
S&P 500 SECTORS — WEEKLY ROTATION
Eight of eleven sectors fell, and the leader is a mean-reversion bounce: Healthcare topped the week while still down 4.61% on the month, with Thermo Fisher’s upgrade-driven 6.83% doing much of the lifting. Utilities is the structural laggard — last on the week and the only sector red on every horizon, with the 10-year at 5%. Financials are the concentration story: six of the eight worst mega-caps on the weekly screen are banks or card lenders. Technology is the reverse — four of the top five gainers, yet a sector gain under 1%, because IBM and the services names bled.
| Sector | 1-Week | 1-Month | 3-Month | 6-Month | YTD | 12-Month |
|---|---|---|---|---|---|---|
| Healthcare | +1.58% | −4.61% | +10.59% | +13.61% | +7.69% | +21.07% |
| Technology | +0.82% | +3.37% | +1.20% | +32.42% | +26.39% | +30.90% |
| Communication Services | +0.75% | +2.46% | −1.43% | +5.20% | +0.49% | +2.75% |
| Consumer Defensive | −0.69% | −4.03% | −1.55% | −0.64% | +4.64% | +2.39% |
| Industrials | −1.26% | −4.83% | −10.05% | +2.48% | +8.80% | +12.56% |
| Energy | −1.55% | +0.92% | +16.01% | +5.28% | +39.17% | +39.79% |
| Consumer Cyclical | −1.57% | −6.12% | −3.63% | +2.56% | −7.59% | −9.89% |
| Basic Materials | −1.96% | −3.36% | +0.05% | +9.27% | +14.45% | +26.47% |
| Financial | −2.22% | −1.69% | +3.90% | +16.17% | +5.36% | +8.60% |
| Real Estate | −2.27% | −6.27% | −2.98% | +1.37% | +4.16% | −0.27% |
| Utilities | −2.67% | −6.27% | −8.38% | −11.35% | −4.45% | −1.70% |
TOP WEEKLY MOVERS:
The decliners are a capital-markets screen, not a random draw: six of the eight worst mega-caps are banks or card lenders, and all six still carry positive six-month returns (Morgan Stanley +27.77%, Bank of America +22.80%) — a de-rating of the year’s winners on fee warnings, not a broken trend. The gainers are momentum continuations: CrowdStrike, Palo Alto, Sandisk and AMD were already up between 97% and 655% year to date, and the top two share a single catalyst in Monday’s AI-safety essay. Thermo Fisher is the exception — a lone upgrade that carried Healthcare to the top of the sector table.
TOP 5 WEEKLY GAINERS
| Ticker | Week | YTD | Year | Why It Moved |
|---|---|---|---|---|
| CRWD | +14.95% | +102.79% | +89.13% | Surged 13.85% Monday — the week’s largest mega-cap session — after Anthropic CEO Dario Amodei’s call to slow AI development was read as a boost to AI-security spending. The company also unveiled a multi-agent “agentic SOC” expansion of its Falcon platform, and several houses lifted targets mid-week (BofA to $260 from $230, Stephens to $280) before a 3.28% Friday pullback. |
| PANW | +9.96% | +97.38% | +76.77% | Rode the same AI-safety bid for a 13.09% Monday gain, then gave some back after Bernstein cut it to Market Perform on Thursday — while raising its target to $351 — on the view that cybersecurity valuations now sit at or above fair value. Form 144 insider-sale filings added supply into the rally. |
| SNDK | +9.70% | +654.83% | +1712.30% | Rose 6.21% Thursday in the memory rally on AI storage demand, then 10.99% Friday ahead of its addition to the S&P 100 before Monday’s open, which obliges index-tracking funds to buy. Index demand alone does not explain the move: two fellow additions, Dell and Palo Alto, fell about 3% the same day. |
| AMD | +8.46% | +161.40% | +254.50% | Fell about 5% Monday in the AI-pacing selloff, then recovered with the chip complex — +6.30% Thursday in the AI-demand and memory rally, and further gains Friday after Chief Technology Officer Mark Papermaster said businesses remain early in AI adoption and AMD sees no slowdown in demand. |
| TMO | +6.83% | +12.43% | +35.41% | JPMorgan upgraded to Overweight with a $730 target and Goldman Sachs reiterated Buy at $750 on Tuesday, both citing earnings momentum and resilient life-sciences demand; the 4.53% gain was the largest mega-cap move on a day nine of eleven sectors fell. |
TOP 5 WEEKLY DECLINERS
| Ticker | Week | YTD | Year | Why It Moved |
|---|---|---|---|---|
| GS | −8.47% | +7.17% | +17.12% | Hit from three directions: Sam Altman ruling out a 2026 OpenAI IPO that Goldman was reportedly set to underwrite (about −4% Monday), CEO David Solomon guiding third-quarter fixed income slightly softer at the Barclays conference, and a further 3.96% slide on Wednesday’s rate hike. |
| BAC | −7.91% | +4.96% | +10.74% | CEO Brian Moynihan guided third-quarter investment-banking fees down at least 10% year on year on Monday, sending the stock down 5.14% — its worst session since April 2025 — and starting the week’s bank selloff; it lost another 2.72% on hike day. |
| NFLX | −7.25% | −23.43% | −40.56% | A 3.77% Monday gain on an Evercore target raise to $110 and a new streaming-policy coalition faded through the week, ending with Friday’s Wells Fargo downgrade to Underweight and a Street-low $57 target on “worrying” engagement trends (−4.67%). |
| IBM | −5.65% | −22.50% | −13.38% | No single catalyst — broad-sector or momentum move. The stock fell 4.38% Wednesday and 3.45% Friday with no discrete trigger identified; the $1 billion CHIPS award for its quantum foundry, finalised September 16, did not arrest the slide. |
| MS | −5.50% | +14.11% | +27.22% | Named alongside Goldman as an underwriter of the OpenAI offering Altman pushed out of 2026, it fell 3.64% Monday; the capital-markets selloff that Bank of America’s fee warning started the same day carried it lower through Wednesday’s hike. |
— Institutional-grade intelligence for serious investors. Apply for membership at join.recessionalert.comC. WEEK’S TOP STORIES -> TOP
Ten stories resolve into three threads and two side-plots. The first is the price of money: the Fed’s hike (#1) opened a week in which London and Tokyo leaned the same way (#6), and the bill arrived at Wall Street’s fee businesses (#3) and at everyone financing the AI build-out (#8). The second is AI’s own reckoning — a safety essay that split the complex (#2) before memory buyers reclaimed it (#7). The third is energy migrating from the barrel (#5) into diesel and freight (#4). Crypto (#9) and trade (#10) ran as policy side-plots.
BEARISH
1. The Fed Hikes for the First Time Since 2023 and Signals More — the 10-Year Posts Its First Closes Above 5%, and a Thursday Relief Rally Is Undone by Friday
The core facts:The week opened with forecasters capitulating: a Reuters poll published Monday had 86 of 101 economists expecting a hike, reversing a two-thirds majority for a hold a week earlier, as Goldman Sachs and Pantheon Macroeconomics abandoned their hold calls after the prior Friday’s hot CPI. The 10-year closed at 4.999% Monday and 5.006% Tuesday — its first 5%-handle close in the MIB price record. On Wednesday the FOMC voted 12-0 to raise the federal funds target range 25 bps to 3.75%–4.00%; the dot plot showed 12 of 18 officials expecting one more hike this year and four expecting two. The 2-year jumped 7.3 bps to 4.736% and the 10-year closed at 5.021%. Chair Kevin Warsh: “The plain fact is that inflation is too high and has been for too long.” Thursday reversed it all — the VIX fell 12.82% and the 10-year eased 6.7 bps to 4.937%, ending an eight-session rising streak — before Friday put it back: the 10-year rose 5.1 bps to 4.998% and the 2-year 6.4 bps to 4.754%, as Bank of America strategists wrote that swaps imply three more quarter-point hikes and warned of a “2022 redux.” Kansas City Fed President Jeffrey Schmid, first to speak after the blackout, said “I supported this decision.” Polymarket’s 2026 hike contract went from 89% to 100% on the week.
Why it matters:The decision was priced; the path was not, and the week settled where the path now sits. The 2-year rose 12.4 bps against 2.6 for the 10-year (see the Volatility & Treasuries table in Section B), so this is tightening repriced at the front end rather than a term-premium scare — and Friday proved Thursday’s rally was hedge removal, not a verdict that the Fed would stop at one. The equity arithmetic is the uncomfortable part: FactSet’s forward P/E of 19.1 implies an earnings yield near 5.2%, within roughly 25 bps of a 10-year that closed at or near 5% on four of five sessions, which leaves almost no equity risk premium and makes Q3’s expected 28.9% earnings growth load-bearing. The political layer adds a tail: a Chair appointed partly on expectations of cuts has now hiked against a President who wrote that “High interest rates put the U.S.A. at a very unfair disadvantage.”
What to watch:Next week’s Fed speakers — Goolsbee Monday; Williams, Jefferson and Barkin Tuesday; Barr Wednesday; Hammack Thursday and Friday — for explicit guidance on an October move, and a 10-year close above the 5.021% set on Wednesday.
UNCERTAIN
2. Amodei’s “Pace the Frontier” Splits the AI Trade — Chip Equipment Loses Up to 8%, Cybersecurity Gains 13%, and the Safety Debate Turns Into Rulebooks and Contracts
The core facts:Anthropic chief executive Dario Amodei’s roughly 3,800-word essay, published Saturday, September 12, urged the industry to slow the pace of frontier-model improvement; Sam Altman and Elon Musk endorsed it within hours. Monday was the first session to trade it: Lam Research fell 8.29%, Applied Materials 7.07%, KLA 6.39%, Arista 5.90% and Hewlett Packard Enterprise 10.76%, while CrowdStrike rose 13.85% and Palo Alto Networks 13.09%. GE Vernova fell 8.62% the same day on a Street-low GLJ Research Sell initiation amid the AI-power de-rating, before recovering 4.79% Wednesday when its chief executive said a $200 billion backlog could arrive “very early in 2027.” President Trump rejected guardrails on Truth Social and attacked Amodei by name, while more than twenty lawmakers called for tougher regulation. Tuesday brought action rather than argument: Microsoft published a 37-page AI code of conduct forbidding its models from resisting shutdown, Anthropic, Google and OpenAI discussed a pre-release testing body, and Wells Fargo’s strategist cut his year-end S&P 500 target to 7,700 from 7,950 citing AI worries. Thursday, Bernstein downgraded Palo Alto and Okta on valuation while raising their targets, and Salesforce fell 3.07% despite six target raises after its investor day. Friday, Accenture and Anthropic agreed to embed Accenture evaluators inside Anthropic, each expecting to invest at least $1 billion in AI safety over five years.
Why it matters:With a week’s hindsight the essay did not cut anyone’s AI capex forecast — chip equipment recovered most of Monday’s loss by Friday and the Nasdaq 100 was the only major index up (see Major Indices in Section B). What it changed is who gets paid. Security vendors took the top two slots on the weekly gainers table, while the services and software layer — Salesforce, Accenture, IBM — was sold, because a slower, gated release cadence rewards the sellers of safety and punishes the businesses whose pitch depends on enterprises trusting autonomous agents. The administration’s refusal to impose limits caps the regulatory tail, leaving voluntary industry bodies as the only binding constraint — and the Accenture contract shows safety has become a budget line rather than a press release.
What to watch:Whether the Anthropic-Google-OpenAI testing body is formally constituted with a pre-release gate, which would make pacing a capex variable, and whether the twenty-plus lawmakers produce bill text. Anthropic’s separately reported October listing now faces the same logic that pushed OpenAI’s IPO out of 2026.
BEARISH
3. Wall Street’s Fee Pool Cracks — Bank of America Warns, OpenAI’s IPO Slips Out of 2026, and Goldman Guides Trading Softer as Financials Lose 2.22%
The core facts:At Barclays’ Global Financial Services Conference on Monday, Bank of America chief executive Brian Moynihan guided third-quarter investment-banking fees to $1.6–1.8 billion against $2.0 billion a year earlier, saying the market “is down 10%” and Bank of America would be “down probably a bit more than that”; the stock fell 5.14%. The same session traded Sam Altman’s Fortune interview ruling out an OpenAI IPO in 2026 — “right now would be an ill-advised moment to go public” — and two of the offering’s reported underwriters fell hardest: Goldman Sachs and Morgan Stanley. On Wednesday, at the same conference, Goldman chief executive David Solomon said third-quarter fixed income would be slightly softer, and Huntington Bancshares cut its near-term outlook on higher deposit costs and tighter loan pricing (−5.55%); the Financial sector fell 1.35% on hike day as banks lifted prime rates to 7.00%. On Friday, Vice Chair for Supervision Michelle Bowman said two final stress-test rules will go to a Board vote “in the coming weeks,” with Basel capital and GSIB surcharge rules to be finished by year-end.
Why it matters:Six of the eight worst mega-caps on the weekly screen are banks or card lenders, and Financials lost 2.22% (see the weekly movers table and sector rotation table in Section B). A rate hike is meant to be a tailwind for banks; this week the two engines that carried first-half bank earnings — advisory fees and trading — were both guided lower, and Huntington described the higher policy rate being competed away through deposit costs before it reaches net interest income. A flattening curve compounds it. The one long-dated offset is Bowman’s: predictable stress-capital buffers free capital for 2027 buybacks, which is why this reads as a de-rating of the year’s winners rather than a credit event — every one of the six still shows a positive six-month return.
What to watch:Mid-October third-quarter results, starting with Goldman Sachs on October 13 and Morgan Stanley on October 14 — advisory fees, trading and deposit betas — and the Board vote on the final stress-test rules.
BEARISH
4. Diesel Sets Record After Record — $6.23 Monday to $6.45 Friday — and the Bill Lands on the Transports as J.B. Hunt Falls 13.3%
The core facts:AAA’s national average diesel price hit an all-time high of $6.23 a gallon on Monday, above the June 2022 record of $5.8159, then kept climbing: $6.3103 Wednesday and $6.4476 Friday. The EIA’s own weekly survey printed $6.285 on Tuesday, up 31.8 cents in a week, and US distillate inventories sit 13% below their five-year average. The supply squeeze is largely Russian: President Trump publicly pressed Ukraine to stop striking Russian refineries on Monday, and Ukrainian drones then hit the Syzran and Yaroslavl plants. Senate Majority Leader John Thune said Tuesday he is open to a diesel export ban. The cost reached earnings on Wednesday: J.B. Hunt’s chief financial officer said third-quarter earnings could fall 5% to 10% from the second quarter on about $25 million of driver costs and a roughly $10 million fuel drag, and the stock fell 13.30%; American Airlines said current fuel prices would require capacity adjustments, with fourth-quarter fuel about $1 a gallon above its July assumption. The Dow Jones Transportation Average fell 2.78% that day. On Monday, Baird had cut five apparel and footwear names citing oil and rates, while Morgan Stanley raised refiner targets by up to 71%.
Why it matters:Crude finished the week lower and diesel finished it at a record — the divergence that decides where this energy shock hits US inflation. It sits in the refining margin, not the barrel, so falling crude does not relieve it, and it travels through freight surcharges into core goods with a lag. The transports’ break from the industrials was the week’s only formal Dow Theory signal (see Major Indices in Section B), but the companies behind it described a margin shock, not a demand collapse — airlines said demand held after fare increases. That argues for owning carriers with pricing power rather than exiting freight. An export ban would be two-sided: bearish for Gulf Coast refiners’ export margin, bullish for the domestic balance.
What to watch:The EIA’s next Gasoline and Diesel Fuel Update on Tuesday, September 22, and Wednesday’s EIA inventory data for distillate stocks; any truckload or airline pre-announcement into quarter-end would confirm the earnings-revision channel.
UNCERTAIN
5. Crude’s Round Trip — Failed Hormuz Talks and a Downed Saudi Pipeline Lift WTI to $105.55, Then a Restoration Plan Takes It Back Below $100
The core facts:The first GCC-Iran ministerial talks on Strait of Hormuz shipping since the war began, scheduled for Monday in Salalah, Oman, were postponed late Sunday on a Saudi objection; WTI rose 1.86% and the VIX 7.95%. On Tuesday, with Saudi Arabia’s 7 million barrel-a-day East-West pipeline still offline after the September 10 drone strikes, WTI jumped 4.10% to $105.55 and Capital Economics said several weeks of closure could lift Brent “towards $130.” Wednesday reversed it: the EIA reported a crude draw of only about 0.6 million barrels against 1.6 million expected, and Bloomberg reported, on one unnamed source, that Saudi Arabia aims to restore about half the line’s capacity within days and full capacity in about six weeks; WTI fell 3.40% and Diamondback fell 8.03% on a $1.9 billion block sale. Thursday’s Kpler analysis put the Hormuz transit-risk premium near $10 a barrel and the global crude deficit at only one to two million barrels a day. On Friday crude fell a third straight session as Saudi Arabia rerouted some exports through Hormuz on shuttle vessels, even as Iran’s Revolutionary Guard claimed a strike on a tanker attempting transit and Kpler counted four transits against a ten-day average of about 16. WTI finished at $99.52, down 0.47% on the week.
Why it matters:The week’s net change hides how fragile the resting point is. The risk premium came out on a single-source restoration report while the strait itself remained contested and transits ran at a quarter of their recent pace, so the market is pricing an operational plan rather than a settled supply picture. Energy equities treated the move as a flat-price event — the sector lost 1.55% on the week despite a 39% year-to-date lead (see the sector rotation table in Section B) — and cheaper crude did nothing for the Fed: the 10-year still finished the week higher. That removes the most convenient argument for a pause.
What to watch:An on-the-record Aramco or energy-ministry confirmation that half of East-West capacity is back, daily Hormuz transits against the 16-vessel average, and Wednesday’s EIA crude stocks.
UNCERTAIN
6. Three Central Banks Lean Hawkish in 72 Hours — the Bank of England Signals, the Bank of Japan Hikes to 1.25% — as Foreign Buyers Turn Sellers of US Paper
The core facts:A day after the Fed’s hike, the Bank of England held Bank Rate at 3.75% on a 6-3 vote on Thursday, with three members voting for a rise and Governor Andrew Bailey and his three deputies signalling they could back one; it paused active gilt sales for six months and said inflation could reach “slightly over 4% in early 2027.” On Friday the Bank of Japan raised its policy rate 25 bps to 1.25%, a 31-year high, on a 7-2 vote, with two members appointed under Prime Minister Sanae Takaichi dissenting for a hold. The market read it as a ceiling: the yen weakened about 0.45% to 156.64 per dollar and the 10-year JGB yield fell 4.9 bps to 2.947%. Separately, Treasury International Capital data released mid-week showed net long-term flows swinging to −$27.9 billion in July from +$174.4 billion in June, against a +$146.3 billion consensus.
Why it matters:For a US portfolio this is a term-premium story. The global supply of duration that must clear at higher policy rates rose across three issuers at once, and the TIC print says the foreign bid for US paper had already turned negative in July, before any of it. The Bank of Japan’s dovish reception is the partial offset: a weaker yen and lower JGB yields keep yen-funded carry intact and preserve a roughly 205 bp gap over Treasuries, the spread that decides whether Japanese institutions buy US duration or repatriate. The Bank of England’s gilt pause matters in its own right — a central bank letting its policy rate do the tightening while it stops competing with its own sovereign’s issuance is a template the Fed may be asked about next.
What to watch:The 10-year JGB against 3% as the new rate takes effect on Thursday, September 24, any Ministry of Finance intervention as the yen weakens, and August TIC data in mid-October.
BULLISH
7. Memory and Chip Equipment Reclaim Leadership — Intel Adds 7.62% on SK Hynix Talks, Sandisk Jumps 10.99% Into the S&P 100, and Most of Monday’s Losses Are Recovered
The core facts:On Wednesday Intel rose 4.03% after Reuters reported that SK Hynix is negotiating its first US memory-chip production, either by leasing space at Intel’s Ohio site or through a joint venture with Intel and cloud providers; SK Hynix said no agreement had been reached and Intel called it speculation. On Thursday Technology rose 2.33% and the day’s five largest mega-cap gainers were all chip or AI-infrastructure names — Intel +7.62%, AMD +6.30%, Sandisk +6.21%, Micron +5.50% and Oracle +5.19% — with no fresh same-day company catalyst identified for any of them. On Friday Technology was the only sector higher: Sandisk rose 10.99% ahead of its addition to the S&P 100, and Lam Research (+6.98%), Applied Materials (+6.51%) and KLA (+4.74%) recovered much of Monday’s AI-pacing selloff. Two other S&P 100 additions, Dell and Palo Alto Networks, fell about 3% the same day.
Why it matters:This is the half of the AI trade the market chose to keep, and the choice is specific: hardware tied to memory supply and wafer fabrication was bought, while servers, cybersecurity and services — the parts that depend on customers’ spending decisions — were sold into the week’s end. It is why the Nasdaq 100 was the only major index up. The weakness in the move is its source. Two consecutive leading sessions rested on catalysts that predated them, and Friday coincided with a triple-witching expiry and an index rebalance, the conditions under which mechanical flows pass for conviction. Sandisk’s move cannot be index demand alone when fellow additions fell, which points to a memory-shortage thesis that has not yet faced a hard demand datapoint.
What to watch:Monday’s first session after the rebalance and expiry, and Micron’s fiscal fourth-quarter results on September 30 — the first hard test of the memory rally.
BEARISH
8. Financing the AI Build-Out Gets Expensive — Carlyle Invokes the Pre-Crisis Playbook, CoreWeave Prices $3.7 Billion on Buyers’ Terms, and Private-Credit Defaults Hit a Record by Fitch’s Count
The core facts:On Tuesday Carlyle’s head of global research, Jason Thomas, published research arguing that the special-purpose-vehicle financing behind the AI data-center buildout follows the playbook used in the shale era and before 2008, with hyperscaler property, plant and equipment up 50% to 200% since late 2023. On Thursday Fitch put the US private-credit default rate at a record 6.3% for the twelve months through August, against 2.51% on Proskauer’s index and readings from 1% to 19% elsewhere — a spread Moody’s ties to distressed restructurings making up about 65% of defaults. The same day CoreWeave launched $3.0 billion of 2033 convertibles alongside a 35 million-share at-the-market programme and fell 4.16%, while privately held Crusoe closed a $3.9 billion round at a $30.9 billion valuation. On Friday CoreWeave upsized the deal to $3.7 billion but priced the coupon at the top of its range (2.875%) and the conversion premium at the bottom (22.5%).
Why it matters:Capital for AI capacity is still available in size, but the week showed its price rising in step with the 10-year. The structures Thomas describes were underwritten against a cost of capital that no longer exists, and the shale comparison is exact on that point: the damage there came from financing assumptions, not from demand. CoreWeave conceded on both cost and dilution to raise more, and the listed-versus-private contrast on the same day — public equity marked down, a private round oversubscribed — says public markets are now pricing the funding of AI rather than the demand for it. The private-credit reading adds opacity: when the default rate depends on which definition a lender picks, concentration cannot be aggregated across institutions.
What to watch:How much of CoreWeave’s at-the-market programme is drawn below the $97.85 conversion price, business development company discounts to net asset value, and Fitch’s next monthly default reading.
UNCERTAIN
9. Crypto’s Week of Whiplash — the CLARITY Act Dies in the Senate, Regulators Open Side Doors, and Bitcoin Ends Back Above $80,000
The core facts:Senate Republicans released a final 635-page CLARITY Act text on Sunday with 126 changes sought by Democrats; on Tuesday the cloture motion failed 46-43 on an unofficial count, far short of 60, with Democrats who had negotiated the bill voting no. Senator Cynthia Lummis: “I think we’re done. It’s over.” Bitcoin fell 3.84% and Coinbase about 6.7% intraday. The same day prosecutors sought to seize about $61 million in cryptocurrency they say came from Iranian oil sold to Chinese buyers through Binance accounts. On Thursday the SEC granted a five-year “innovation exemption” letting tokenized-securities venues trade tokenized NMS stock without registering as an exchange. On Friday the OCC gave stablecoin issuer Bastion conditional approval for a national trust charter, the CFTC’s market-structure rulemaking was reported to be at White House review, and Bitcoin jumped 6.15% to $81,095 as about $238 million of short positions were liquidated; Coinbase rose 11.7% and Strategy 16.4%. Bitcoin finished the week up 4.90%.
Why it matters:The statutory route closed and the agency route opened in the same five days. Congress will not write market-structure rules this year, but the SEC, OCC and CFTC are building the same framework piece by piece without needing sixty votes — alongside enforcement that now treats exchange accounts as the laundering venue for sanctioned oil. Friday’s price action should not be read as a verdict on that shift: it came on a day the 2-year yield rose 6.4 bps, which rules out the usual rates-and-risk-appetite explanation and leaves positioning, and the listed multipliers moving two to three times Bitcoin show how much leverage sits in the rally.
What to watch:Publication of the CFTC’s proposed rules once White House review ends, the first issuer to object to tokenization of its shares under the SEC exemption, and whether spot bitcoin ETF inflows persist.
BEARISH
10. Trade Pressure Widens on Three Fronts — Canada Is Pushed Out of Federal Procurement, Trump Threatens the EU, and Seoul Says Its $350 Billion Pledge Has Stalled
The core facts:Modified Section 338 tariffs on Canadian goods took effect on Tuesday, adding all-terrain vehicles, more dairy, wood products, furniture and motorboats to coverage the US Trade Representative puts near $20 billion. On Wednesday the President signed a memorandum, “Restoring Reciprocity in Government Procurement,” directing agencies to remove Canadian-origin items from federal civil procurement, citing Canadian firms’ access to “over $280 billion” of it; no deadline was set. That evening he called the European Commission’s offer of associate membership to Canada “laughable” and warned of “very serious tariffs” on Europe, naming no rate or instrument; Brussels, Paris, Madrid and Dublin rejected the framing on Thursday. On Friday South Korea’s President Lee Jae-myung said the $350 billion US investment package — the counterpart to cutting US tariffs on Korean goods to 15% from 25% — has stalled over cost recovery and return-sharing terms, with its first project on hold.
Why it matters:The market ignored all of it — equities rallied Thursday and the dollar was flat — and on the individual steps that is defensible: a procurement memo without a deadline and a tariff threat without an instrument are not earnings inputs. The Korean admission is the one to weigh. The administration’s bilateral deals were bought with investment pledges whose economics were left to be settled later, and the first partner to say publicly that the terms cannot be executed invites a tariff snapback as the enforcement tool — a risk that extends to every framework built the same way, in the week before the President meets Xi Jinping.
What to watch:The Trump-Xi summit (Wednesday, September 23, 8:00 PM ET), Korea’s parliamentary briefing on Tuesday, September 22, and the September 29 start of the import ban on select Canadian goods.
— Separating signal from noise since 2007. Apply for membership at join.recessionalert.comD. WEEK IN THE ECONOMY -> TOP
The week delivered a stagflation pulse in miniature: import prices rose 7.0% year on year, the fastest pace since 2022, and the Philadelphia Fed’s prices-paid gauge climbed to 48.6, while industrial production stalled, the Empire State index slumped to 7.6 and the Conference Board’s leading index slipped for the first time since March. The Fed chose the inflation half, hiking to 3.75%–4.00% with a 1.2% jump in retail sales and 196,000 jobless claims as its cover. Markets accepted the policy path but not the growth risk: the 2-year rose 12.4 bps and Polymarket’s 2026 hike contract reached 100%, yet recession odds ended at just 9% after touching 20% on Tuesday’s oil spike. Friday’s August durable goods orders, expected down 0.5%, will show whether the factory weakness has reached new orders or remains confined to output.
POLYMARKET ODDS — WEEK-ON-WEEK SHIFT:
| Market | Last Friday | This Friday | Δ |
|---|---|---|---|
| US Recession by end-2026 | 7% | 9% | +2.0 pp |
| Fed rate hike in 2026 | 89% | 100% | +11.0 pp |
| Fed rate cuts ≥1 in 2026 | 6.7% | 5% | −1.7 pp |
BEARISH
FOMC Raises Rates 25 bps to 3.75%–4.00%, Dot Plot Points to Another Hike This Year (Federal Reserve, Wed, Sep 16)
What they’re saying:The Committee voted 12-0 for its first increase since July 2023, saying the move “will support a timelier return to the Committee’s 2 percent goal.” The dot plot showed 12 of 18 officials expecting one more quarter-point hike this year, to 4.125%, four expecting two more and two expecting none. The move was near fully priced: a Reuters poll published Monday had 86 of 101 economists expecting it, and Polymarket put Wednesday’s hike at 100%. Chair Warsh said the Fed “cannot affect any individual price” such as oil, but must stop relative-price shocks from broadening.
The context:The transmission began within hours: banks lifted prime rates to 7.00%, and Freddie Mac’s 30-year mortgage rate rose 19 bps to 6.95% on the week. The CNBC Fed Survey had a majority of respondents expecting at least two more hikes within a year, and by week’s end Bank of America strategists read swaps as pricing three. The front end took the message — the 2-year rose 12.4 bps on the week (see the Volatility & Treasuries table in Section B) and cut odds slipped to 5% (see the Polymarket table above) — while CME pricing left the October meeting close to a coin-flip.
What to watch:A dense run of Fed speakers from Monday through Friday, then the October 27–28 FOMC meeting.
BULLISH
Retail Sales Jump 1.2% in August, Control Group Up 1.4% — Well Above Forecasts (Census Bureau, Wed, Sep 16)
What they’re saying:Retail sales rose 1.2% against a 0.8% consensus, reversing a revised 0.5% July decline and reaching $773.9 billion. The control group that feeds GDP rose 1.4% against 0.4% expected, a full-point beat. The Atlanta Fed’s GDPNow moved to 5.1% for the third quarter from 4.4% a week earlier.
The context:The print did two jobs on the day it landed: it gave the Fed cover to hike on resilience, and it pulled Polymarket’s recession odds down eight points in a single session. The equity market was less persuaded — Consumer Cyclical fell 1.57% on the week and remains 7.59% lower year to date (see the sector rotation table in Section B) — because the rest of the week’s consumer evidence pointed the other way: McDonald’s drew four target cuts on traffic concerns, the Conference Board flagged consumer expectations as the main drag on its leading index, and August’s spending predates the latest leg of the diesel and mortgage-rate rise.
What to watch:The final September Michigan sentiment reading on Friday, September 25 (47.8 expected, 51.7 prior), and September retail sales for whether August was a one-month pop.
BEARISH
Import Prices Up 7.0% Year on Year, the Fastest Since 2022; Philly Fed Prices Paid Climbs to 48.6 (BLS, Wed, Sep 16; Philadelphia Fed, Thu, Sep 17)
What they’re saying:Import prices rose 0.7% in August against 0.4% expected, taking the annual rate to 7.0%, the largest since August 2022; export prices rose 0.6% on the month and 8.6% on the year. Excluding fuel, import prices rose a stronger 0.8%, led by a 2.0% jump in nonfuel industrial supplies and a 0.9% rise in capital goods. On Thursday the Philadelphia Fed’s prices-paid index rose to 48.6 from 40.9.
The context:That the nonfuel measure outran the headline is what gives the print weight: broad increases in materials and capital goods pass through supply chains more reliably than an energy spike, and they arrived the same week diesel set successive records. Forecasters moved with it — the CNBC Fed Survey’s average 2026 CPI forecast rose to near 3.5%, and the New York Fed’s model raised its 2026 core PCE forecast to 3.3% from 3.1%. The dollar’s 1.08% weekly gain (see the Volatility & Treasuries table in Section B) is the one force working against the next import print.
What to watch:September PPI and CPI for whether nonfuel import pressure is reaching producer and consumer prices.
UNCERTAIN
Factory Output Stalls and the Leading Index Turns Down — but Jobless Claims Fall to 196,000 (NY Fed, Tue, Sep 15; DOL, Thu, Sep 17; Federal Reserve and Conference Board, Fri, Sep 18)
What they’re saying:The Empire State Manufacturing Index fell to 7.6 in September from 20.6, against 14.75 expected. Industrial production was unchanged in August against a 0.3% forecast, with manufacturing output down 0.3% and durable manufacturing down 0.5%. The Conference Board’s Leading Economic Index fell 0.1% to 99.5, its first decline since March, with its diffusion index dropping to 55.0 from 75.0. Against that, initial jobless claims fell to 196,000 from 206,000 (208,000 expected), and continuing claims to 1.730 million. The Philadelphia Fed headline beat at 37.8, but its employment component fell to 11.8 from 27.9.
The context:Output and hiring intentions are softening while layoffs stay near historic lows — the combination that lets the Fed argue its hike will not break the labour market, and also the one that lets factory weakness build unnoticed until orders turn. The divergence between tracking and leading measures is now wide: the Conference Board forecasts 1.9% growth for 2026 while GDPNow reads 5.1% for the current quarter. Markets sided with the resilient reading — Industrials lost only 1.26% on the week, but the transports’ 2.66% slide says freight is feeling the cost side first (see Major Indices in Section B).
What to watch:August durable goods orders on Friday, September 25 (−0.5% expected), and initial jobless claims on Thursday, September 24.
BEARISH
Housing Weakens on Every Measure as the 30-Year Mortgage Rate Jumps 19 bps to 6.95% (NAHB, Wed, Sep 16; Census/HUD and NAR, Thu, Sep 17; Freddie Mac, Thu, Sep 17)
What they’re saying:The NAHB builder index fell three points to 32 against 34 expected, with 38% of builders cutting prices. Housing starts fell 2.6% to a 1.275 million annual rate against 1.31 million expected — single-family starts rose 7.6% while multifamily fell about 22% — and permits fell 2.7% to 1.394 million. Pending home sales rose just 0.3% against roughly 2% expected and remain 4.7% below a year earlier. Freddie Mac’s 30-year fixed rate rose to 6.95% from 6.76%.
The context:Housing is where the hike was felt first and hardest, because mortgage rates move with the long end and the 10-year spent the week at the top of its recorded range. Lennar, reporting hours after the decision, missed revenue estimates by 3.28%. The single-family rebound inside the starts report is the one constructive detail, but permits — the forward-looking series — fell alongside it. Real Estate lost 2.27% on the week, among the worst sectors (see the sector rotation table in Section B).
What to watch:The MBA mortgage rate on Wednesday, September 23, and August new home sales on Thursday, September 24 (0.61 million expected, after a 10.5% monthly drop).
— Know the probability before the market prices in the risk. Apply for membership at join.recessionalert.comE. WEEK IN EARNINGS -> TOP
TOP EARNINGS OF THE WEEK
No major earnings from companies with >$100B market cap reported this week.
WEEK AHEAD PREVIEW:
Q3 2026 earnings season has barely begun — three S&P 500 companies have reported, per FactSet’s September 18 update — and one name above $100B reports over the next five business days.
Costco Wholesale (COST) — AMC, Thursday, September 24 — $397.05B market cap; consensus EPS $6.53 on revenue of about $94.86B against $86.16B a year earlier. Key focus: the US/Canada membership renewal rate (92.1% in fiscal Q2 2026, from 93.0% a year earlier), membership-fee income, the e-commerce comparable after +21.5% in fiscal Q3, and first commentary on the nationwide DoorDash delivery agreement, which requires a linked Costco membership.
No other reporter from Monday, September 21 through Friday, September 25 clears $100B, and none comes within 5% of it; Friday, September 25 has no scheduled reporters. The largest names below the threshold are Cintas (CTAS, $79.19B, BMO Wednesday), AutoZone (AZO, $46.61B, BMO Tuesday) and Paychex (PAYX, $41.34B, BMO Wednesday). Q3 2026 reporting broadens from mid-October.
— US market commentary trusted by family offices and institutions. Apply for membership at join.recessionalert.comF. NEXT WEEK SETUP -> TOP
UPCOMING RELEASES:
| Date | Event | Why It Matters |
|---|---|---|
| Mon, Sep 21 | Fed Goolsbee Speech | The first policymaker on next week’s calendar; any read on October sets the tone for a week with more than a dozen Fed appearances. |
| Mon, Sep 21 | Chicago Fed National Activity Index, Aug (prior −0.08) | A broad August activity gauge; a second negative print would side with this week’s stalled industrial production over GDPNow’s 5.1%. |
| Tue, Sep 22 | ADP Employment Change Weekly (prior 16.25K) | Has improved two periods running; a third would reinforce the Fed’s view that hiking will not break hiring. |
| Tue, Sep 22 | Fed Williams Speech | The New York Fed president’s first remarks after the decision — the most direct signal on whether the 12-of-18 dot majority for another hike is a floor or a ceiling. |
| Tue, Sep 22 | Fed Jefferson Speech | The Vice Chair’s framing of how far policy should lean against an energy shock it cannot directly influence. |
| Tue, Sep 22 | Fed Barkin Speech | Listen for business-cost commentary — fuel and freight are the channel that broke the transports this week. |
| Tue, Sep 22 | API Crude Oil Stock Change (prior +7.14M) | An early read before the EIA; another build would confirm that US supply is not the constraint behind the Gulf premium. |
| Wed, Sep 23 | MBA 30-Year Mortgage Rate (prior 6.97%) | The first full post-hike week of mortgage pricing; a break above 7% would deepen housing’s weakest week of the year. |
| Wed, Sep 23 | Fed Barr Speech | A Governor with a supervision background speaking as Bowman’s stress-test overhaul heads to a Board vote — relevant to bank buyback capacity as well as rates. |
| Wed, Sep 23 | EIA Crude Oil Stocks Change (prior −0.64M) | Last week’s thin draw began crude’s three-session slide; a second soft number would keep the Saudi-restoration unwind going. |
| Wed, Sep 23 | EIA Gasoline Stocks Change (prior +0.794M) | Gasoline building while diesel sets records would confirm the squeeze is distillate-specific, not a general refining shortfall. |
| Wed, Sep 23 | President Trump and President Xi Summit | The week’s highest-impact event, arriving as Seoul’s $350 billion pledge stalls and the Canada and EU disputes escalate — any tariff language decides whether the trade thread turns from threats into instruments. |
| Thu, Sep 24 | Fed Williams Speech | A second Williams appearance in three days; any shift from Tuesday’s message would itself be the signal. |
| Thu, Sep 24 | Fed Barkin Speech | Barkin’s second appearance, landing ahead of the claims print. |
| Thu, Sep 24 | Current Account, Q2 (prior −$226.8B) | The external financing gap, read against July’s swing to net foreign selling of long-term US securities. |
| Thu, Sep 24 | Initial Jobless Claims (prior 196K) | The firmest labour read of the week just ended; a jump back above 210,000 would weaken the case for a second hike. |
| Thu, Sep 24 | Fed Hammack Speech | The first of two Hammack appearances; watch for an explicit view on the October meeting. |
| Thu, Sep 24 | New Home Sales, Aug (expected 0.61M; prior 0.607M) | New-build demand at near-7% mortgage rates, after builders cut prices and confidence fell to 32. |
| Thu, Sep 24 | New Home Sales MoM, Aug (prior −10.5%) | After July’s 10.5% drop, a second monthly decline would carry housing’s slide from existing homes into new construction. |
| Thu, Sep 24 | Fed Paulson Speech | Another regional voice on the trade-off between energy-driven inflation and this week’s softer factory data. |
| Fri, Sep 25 | Fed Williams Speech | A third Williams appearance in four days — a clear sign of how deliberately the New York Fed wants the path read. |
| Fri, Sep 25 | Durable Goods Orders MoM, Aug (expected −0.5%; prior 1.1%) | The bridge from this week’s stalled output to new orders; a decline would show the factory weakness spreading beyond production. |
| Fri, Sep 25 | Durable Goods Orders Ex Transportation MoM, Aug (prior 0.4%) | Strips out aircraft swings — with Boeing’s 737 rate delay in the background — for the cleaner read on business investment. |
| Fri, Sep 25 | Michigan Consumer Sentiment Final, Sep (expected 47.8; prior 51.7) | Consumer expectations are the leading index’s biggest drag; a fall to 47.8 would sit awkwardly beside August’s 1.2% retail-sales jump. |
| Fri, Sep 25 | Fed Hammack Speech | Closes a speaker-heavy week and is the last scheduled Fed word before month-end. |
WHAT TO WATCH NEXT WEEK:
1. Do next week’s Fed speakers turn the October meeting from a coin-flip into a second hike? Twelve of 18 officials pencilled in one more move this year and Bank of America reads swaps as pricing three; Williams speaks three times in four days, and a consistent message from him would settle the question the 2-year has already started answering.
2. Can the chip and memory rebound survive Monday without Friday’s index flows? Sandisk’s S&P 100 entry and a triple-witching expiry coincided with the equipment rally; if Lam Research, Applied Materials and KLA hold their gains once the rebalance is done, the AI-pacing selloff was a positioning event rather than a capex re-rating.
3. Does Wednesday’s Trump-Xi summit turn a week of trade threats into actual instruments? Canada has already lost federal procurement access, an import ban on select Canadian goods starts September 29, the EU warning named no rate, and Seoul says its investment pledge has stalled — a summit that produces tariff language would give the market the first thread it cannot ignore.
4. Does diesel keep climbing even if crude does not? Tuesday’s EIA diesel update and Wednesday’s inventory data test whether the refining squeeze is easing; with distillate stocks 13% below normal, another record would push the freight-cost shock deeper into third-quarter earnings guidance.
5. What does Costco say about the consumer on Thursday? The only mega-cap reporter of the week lands the same day as new home sales; its membership renewal rate and first read on the DoorDash tie-up will show whether August’s retail-sales jump reflected durable spending or one strong month.
— US market commentary trusted by family offices and institutions. Apply for membership at join.recessionalert.comG. CHART OF THE WEEK -> TOP
WHY THIS CHARTMonday’s chart asked the question the rest of the week answered: with the G7’s median yield already above its 2023 peak and the US 10-year still 2 bps short of its own, would the Fed’s decision move six markets or one? By Wednesday the 10-year had closed above 5% twice, and London and Tokyo leaned hawkish within 48 hours of it — the week’s dominant theme of synchronised tightening, drawn before it happened. The diesel chart from Friday told the energy story well, but only this one frames the rate shock that carried every other thread.
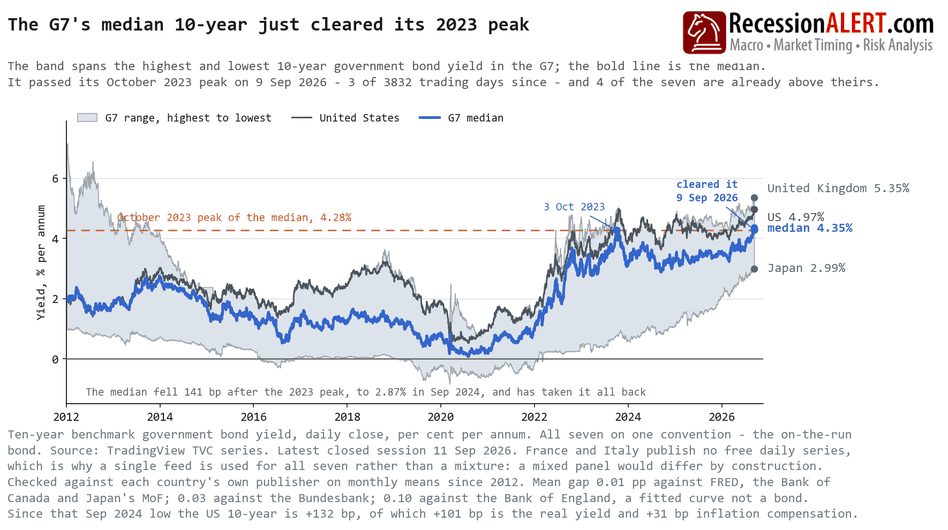
ORIGINAL CHART ANALYSIS — FROM MONDAY’S MIBThe G7’s median 10-year government bond yield closed at 4.35% on 11 September, above the 4.28% it touched at the height of the 2023 scare — a line the median has now spent just three of 3,832 trading days above. The remarkable part is who carried it. Not America: the US 10-year sits at 4.97%, still 2bp shy of its own October 2023 high. France did it, up 91bp on its 2023 peak, with Britain up 60bp and Germany up 54bp. And they did it while the seven converged rather than scattered. The grey band spanning the highest and lowest yielder has compressed to 2.36 percentage points from 5.94 in January 2012 — narrowing while every member’s yield climbed, with the average correlation between any two of them now 0.59 against 0.32 in 2013. That combination rules something out. A solvency scare widens gaps and singles a borrower out; Italy, the one country that used to be singled out, sits 67bp below its own 2023 peak. Nor is this a rate cycle returning to a familiar floor. For 984 days between 2016 and 2022 at least one G7 ten-year traded below zero, down to -0.835%; the cheapest now is Japan at 2.99%. The floor rose further than the ceiling. What replaced the old fear is genuinely open — watch whether Wednesday’s Federal Reserve decision moves six markets or one. Seven passports, one risk. What it means: that 2bp gap is the one that matters for a US portfolio. If the US follows Europe over its 2023 high, everything priced off future cash flows — growth stocks, property trusts, the bond half of a balanced portfolio — reprices at 2023 discount rates. Over the past year all seven of these markets rose; none was a hedge.
MIB Weekly Digest Ver. 2.05
For professional investors only. Not investment advice.
© 2026 RecessionALERT.com

Comments are closed.