
MIB WEEKLY DIGEST
Week of Jul 13–17, 2026
The Strait of Hormuz war escalated all week — a reinstated blockade, six nights of US strikes, and a Friday threat to close a second chokepoint — pushing oil up roughly 15% and volatility up 25%. A parallel AI-capex credibility crisis pushed the semiconductor index into a bear market, erasing $3.3 trillion since June, even as PayPal surged 16-17% on a $53 billion takeover bid from Stripe and Advent. IBM crashed 25% (worst day since 1987) on capex-diversion commentary while Goldman Sachs surged 9% to a record high. Cooling CPI and PPI prints failed to soften an increasingly hawkish Fed chorus (Waller, Warsh, Logan, Hammack).
TABLE OF CONTENTS
A. WEEK AT A GLANCE
B. WEEK IN MARKETS
C. WEEK’S TOP STORIES (8)
D. WEEK IN THE ECONOMY (5)
E. WEEK IN EARNINGS (3)
F. NEXT WEEK SETUP
G. CHART OF THE WEEK
A. WEEK AT A GLANCE -> TOP
The S&P 500 fell 1.55% on the week, with a Nasdaq-led decline (-4.13%) driven by two compounding shocks: an escalating Strait of Hormuz war that pushed oil up roughly 15%, and a rolling AI-capex credibility crisis that pushed the semiconductor index into a technical bear market. Beneath the surface, breadth genuinely split — cybersecurity and software names hit fresh highs even as the chip/memory complex cratered, both from within the same Technology sector. Cooling CPI and PPI prints failed to soften the Fed’s tone, with four separate officials turning more hawkish across the week even as housing data deteriorated on every release.
• S&P 500 fell 1.55% on the week (Nasdaq 100 -4.13%) as the Hormuz war and an AI-capex credibility crisis compounded.
• PANW led weekly gainers (+10.05%) on a cybersecurity rally and record price-target hikes, while SNDK led decliners (-29.29%) on a NAND guidance cut and the broader chip rout.
• PayPal surged 16-17% after Stripe and Advent offered $53 billion to acquire the company.
• WTI and Brent both closed +15.5% on the week as the Hormuz blockade widened into six consecutive nights of US strikes; VIX jumped 24.68%.
• June CPI and PPI delivered the year’s coolest inflation prints, yet four Fed officials (Waller, Warsh, Logan, Hammack) turned more hawkish across the week.
• IBM crashed 25.21% (worst day since 1987) on capex-diversion commentary, while Goldman Sachs surged 9.16% to an all-time high on a record trading quarter.
1. The AI-Capex Credibility Crisis Has No Settled Answer — From Oracle’s downgrade Monday to the semiconductor index’s bear-market close Friday, the market oscillated between crash and rebound all week, showing genuine disagreement about whether AI-infrastructure spending will earn an adequate return.
2. A Genuine Technology-Sector Bifurcation — Cybersecurity/software (PANW, CRWD) and chip/memory (SNDK, INTC, MU, AMAT) posted the week’s most extreme moves in opposite directions from within the same GICS sector, a split IBM’s software-to-hardware capex-diversion signal helps explain.
3. The Fed Isn’t Trading What the Data Is Selling — CPI and PPI both cooled sharply, yet Waller, Warsh, Logan, and Hammack all turned more hawkish across the same five sessions, keeping yields from sustaining their post-CPI decline.
4. War Risk Isn’t Trading Like Normal Risk-Off — Gold fell a net 2.20% across a week of six consecutive nights of US strikes on Iran, rising in only two of five sessions; VIX’s 24.68% weekly surge arrived without a sustained matching move in yields; and Friday’s oil-up/equities-down close is the classic stagflationary signature — three separate asset classes all saying this war is being priced as event risk, not systemic risk.
 — Leading economic indicators. Accurate market forecasts. Apply for membership at join.recessionalert.com
B. WEEK IN MARKETS -> TOP
The week’s dominant catalyst was the Strait of Hormuz war: Monday’s reinstated blockade sent oil up 9% and equities lower, and by Friday six consecutive nights of US strikes plus Iran’s threat to close a second chokepoint (Bab al-Mandeb) via the Houthis kept WTI and Brent up roughly 15.5% on the week. A second, distinct driver emerged mid-week — TSMC’s raised AI-capex guidance and a Chinese Moonshot AI model both reignited doubts about AI-infrastructure spending returns, dragging the Nasdaq 100 down 4.13% even as cooling CPI and PPI prints briefly rallied risk assets Tuesday-Wednesday. Breadth was genuinely bifurcated: cybersecurity/software (PANW, CRWD) hit fresh highs while the chip/memory complex (SNDK, INTC, MU, AMAT) cratered — both from within Technology. Gold’s persistent failure to catch a safe-haven bid despite an active war is the week’s most telling anomaly heading into next week’s data.
FRIDAY CLOSE & WEEK-ON-WEEK CHANGE — Fri, Jul 17, 2026:
MAJOR INDICES
Two Market History Signals fired this week. Dow Theory: DJTA outperformed DJIA by 3.39 points on the week (+2.46% vs -0.93%), with Thursday’s single-session 3.43pp spread the sharpest same-day split — transports strength argues against reading the S&P’s decline as broad economic deterioration. Growth vs Broad: the S&P outpaced the Nasdaq 100 by 2.58 points (-1.55% vs -4.13%), confirming a broadening rotation away from tech as the chip complex absorbed Wednesday’s TSMC capex shock and Friday’s Moonshot AI scare.
| Index | Fri Close | WoW Change | WoW % | Why It Moved (Week) |
|---|---|---|---|---|
| S&P 500 | 7,457.68 | -117.57 | -1.55% | Choppy week — Monday’s Hormuz-blockade selloff and Friday’s chip-rout/oil-shock combo drove the net decline; Tuesday-Wednesday’s CPI/PPI-driven rally only partially offset. |
| Dow Jones | 52,146.42 | -490.67 | -0.93% | Outperformed peers as the week’s damage concentrated in tech/semis; blue-chip resilience held through Monday’s Iran shock and Friday’s chip selloff. |
| DJ Transportation | 22,723.90 | +545.80 | +2.46% | Bucked the index-wide decline; Thursday’s 3.23% single-day surge against a falling Dow was the standout Dow Theory divergence of the week. |
| Nasdaq 100 | 28,592.66 | -1,232.45 | -4.13% | Worst-performing major index — absorbed Monday’s Iran-driven tech selloff, Wednesday-Thursday’s TSMC capex scare, and Friday’s Moonshot AI-model chip rout. |
| Russell 2000 | 2,960.95 | -17.69 | -0.59% | Roughly tracked the broad tape, sidestepping the worst of the mega-cap AI-linked chip damage. |
| NYSE Composite | 23,816.97 | -108.10 | -0.45% | Held up better than cap-weighted gauges most of the week, reflecting broader-tape resilience beneath the semiconductor-concentrated selloff. |
VOLATILITY & TREASURIES
VIX surged 24.68% on the week (15.03→18.74), but the move split into two distinct spikes — Monday’s Iran-blockade shock and Friday’s chip-rout/oil-shock combo — bookending a calmer midweek. Yields told a different story: the 10Y and 2Y both round-tripped, rising on Monday’s escalation and hawkish Fed commentary (Waller, Logan, Hammack), then easing on cooling CPI/PPI, to close nearly flat (10Y -0.9bps, 2Y -2.7bps). A volatility spike without a matching yield move signals event-driven, not inflation-driven, stress this week.
| Instrument | Fri Level | WoW Change | Why It Moved (Week) |
|---|---|---|---|
| VIX | 18.74 | +3.71 (+24.68%) | Spiked twice — Monday’s Iran shock, Friday’s chip-rout/oil-shock combo — a regime shift, not a one-day scare. |
| 10-Year Treasury Yield | 4.551% | -0.9 bps | Round-tripped — rose on Monday’s escalation, eased on cooling CPI/PPI, ended nearly flat. |
| 2-Year Treasury Yield | 4.183% | -2.7 bps | Similar round trip — hawkish Fed talk (Waller, Logan, Hammack) offset by cooling CPI/PPI prints. |
| US Dollar Index (DXY) | 100.77 | -0.20 (-0.20%) | Essentially flat on net despite Monday’s flight-to-quality bid and mid-week easing on cooler data. |
COMMODITIES
Gold’s weekly arc is the standout anomaly: down 2.20% across a week that saw six consecutive nights of US strikes on Iran, rising only twice in five sessions and falling hardest (-2.55%, -1.76%) on the war’s two most dramatic escalation days — a persistent, not one-off, failure to catch a safe-haven bid. Silver underperformed gold throughout (-6.56% WoW), adding industrial-demand caution atop the precious-metals pullback, while Bitcoin closed essentially flat (+0.01%), tracking the equity tape’s ups and downs without a distinct crypto catalyst of its own.
| Asset | Fri Price | WoW Change | WoW % | Why It Moved (Week) |
|---|---|---|---|---|
| Gold | $4,023.00/oz | -$90.70 | -2.20% | Failed to catch a sustained safe-haven bid despite six nights of US strikes on Iran — dollar strength and shifting rate bets repeatedly overrode war risk. |
| Silver | $56.220/oz | -$3.945 | -6.56% | Underperformed gold every session, layering industrial-demand caution atop the precious-metals pullback. |
| Copper | $6.2700/lb | -$0.0100 | -0.16% | Roughly flat on net despite a volatile week of cross-currents between risk-on CPI/PPI rallies and Friday’s growth-scare selloff. |
| Platinum | $1,603.50/oz | -$25.50 | -1.57% | Choppy — Tuesday’s standout +2.86% idiosyncratic spike gave way to broader precious-metals softness by Friday. |
| Bitcoin | $64,211 | +$5.0 | +0.01% | Essentially flat — tracked the equity risk tape up and down all week with no distinct crypto catalyst. |
ENERGY
WTI (+15.49%), Brent (+15.94%), and Dutch TTF (+15.91%) moved in near-lockstep all week, while Henry Hub stayed essentially flat (-0.82%) — confirming a pure Strait-of-Hormuz chokepoint premium, not a broad energy-inflation story. The blockade reinstated Monday escalated through six consecutive nights of US strikes, and Friday brought Iran’s threat to direct the Houthis against the Bab al-Mandeb chokepoint too — a second Middle East supply route now at risk. Oil rising alongside a falling equity tape by week’s end is the stagflationary tell.
| Asset | Fri Price | WoW Change | WoW % | Why It Moved (Week) |
|---|---|---|---|---|
| Crude Oil (WTI) | $82.47/bbl | +$11.06 | +15.49% | Persistent Hormuz-blockade risk premium built all week — Monday’s reinstatement, nightly US strikes, and Friday’s renewed naval blockade kept crude bid every session. |
| Crude Oil (Brent) | $88.13/bbl | +$12.12 | +15.94% | Outpaced WTI slightly, confirming the global (not just US) nature of the Hormuz supply-shock premium. |
| Natural Gas (Henry Hub) | $2.916/MMBtu | -$0.024 | -0.82% | Stayed disconnected from the crude rally all week — domestic supply/demand dynamics shrugged off the Middle East story. |
| Natural Gas (Dutch TTF) | $18.87/MMBtu | +$2.59 | +15.91% | Tracked the Hormuz-driven crude rally in lockstep, reflecting Europe’s LNG-shipping exposure to the same chokepoint risk. |
S&P 500 SECTORS — WEEKLY ROTATION
Technology’s -4.41% weekly decline (worst sector) masks a genuine internal bifurcation rather than a uniform rout: the same GICS sector produced both of the week’s top two gainers (PANW +10.05%, CRWD +8.49%) and four of its five worst decliners (SNDK, INTC, MU, AMAT) — cybersecurity/software strength was overwhelmed by a chip/memory rout tied to TSMC’s capex shock and a Chinese-AI competition scare. Energy’s sector-leading +4.28% was broad-based, not single-name — both CVX and XOM rode the same Hormuz oil premium rather than an idiosyncratic move. Real Estate (+2.69%) was the week’s quieter second-best performer.
| Sector | 1-Week | 1-Month | 3-Month | 6-Month | YTD | 12-Month |
|---|---|---|---|---|---|---|
| Energy | +4.28% | +3.87% | -0.91% | +20.71% | +28.11% | +33.91% |
| Real Estate | +2.69% | +2.58% | +5.10% | +9.58% | +12.83% | +10.55% |
| Consumer Defensive | +1.12% | -0.76% | +2.03% | +2.65% | +8.22% | +6.90% |
| Financial | +0.61% | +3.53% | +8.45% | +5.67% | +5.97% | +15.00% |
| Healthcare | -0.28% | +6.11% | +8.26% | +2.05% | +4.88% | +21.04% |
| Utilities | -0.75% | +0.27% | -4.17% | +4.24% | +5.75% | +12.73% |
| Consumer Cyclical | -1.02% | -1.08% | -2.31% | -6.77% | -4.32% | +3.20% |
| Basic Materials | -2.29% | -10.53% | -10.98% | -5.13% | +5.37% | +27.83% |
| Communication Services | -2.43% | -4.24% | -1.59% | -0.03% | +2.49% | +30.95% |
| Industrials | -3.11% | -7.77% | +0.30% | +4.74% | +12.35% | +17.04% |
| Technology | -4.41% | -4.12% | +11.34% | +16.34% | +16.59% | +27.69% |
TOP WEEKLY MOVERS:
Technology’s -4.41% weekly sector return conceals the real story: PANW and CRWD (both Tech-classified) topped the gainers list while SNDK, INTC, MU, and AMAT (also Tech) filled four of five decliner slots — the same sector home to both extremes. SNDK’s -29.29% and MU’s -13.31% are sharp pullbacks within still-extraordinary multi-year runs (SNDK +470.74% YTD, +3163.05% over the past year; MU +195.45% YTD, +649.56% over the past year), not trend reversals. CVX and XOM’s gains rode the same broad Hormuz premium visible in the sector table above, not idiosyncratic news.
TOP 5 WEEKLY GAINERS
| Ticker | Week | YTD | Year | Why It Moved |
|---|---|---|---|---|
| PANW | +10.05% | +94.72% | +82.74% | Hit an all-time high on a cybersecurity rally driven by IBM commentary on AI-spend priorities, plus multiple analyst price-target hikes (Tigress $430, Citi $400, Capital One upgrade to Overweight at $421) and optimism around the CyberArk integration. |
| CRWD | +8.49% | +73.29% | +92.90% | Rode the same cybersecurity rally as PANW; Citi and BTIG both raised price targets ($250, $237), with accelerating ARR growth and a recent 4-for-1 stock split keeping shares near all-time highs. |
| PM | +6.25% | +20.31% | +7.71% | FDA authorization for ZYN nicotine pouches boosted the smoke-free portfolio (IQOS/ZYN); defensive rotation into staples amid the week’s tech-led volatility added a tailwind. |
| CVX | +6.22% | +22.94% | +23.78% | Rode the Hormuz-driven oil rally; Wolfe Research upgraded to Outperform ($210 target), and the Kilby power project (a 20-year Microsoft data-center supply deal) plus Iraq expansion reinforced the bullish case. |
| XOM | +6.11% | +22.45% | +31.97% | Tracked the crude rally on reinstated Hormuz blockade tensions, expected to lift Q2 upstream earnings by roughly $3.5-3.9B; several banks trimmed price targets but kept bullish ratings. |
TOP 5 WEEKLY DECLINERS
| Ticker | Week | YTD | Year | Why It Moved |
|---|---|---|---|---|
| SNDK | -29.29% | +470.74% | +3163.05% | Monday’s guidance cut on faster NAND price declines triggered a broad chip selloff; TSMC’s capex-guidance shock compounded the rout mid-week; a partial Friday rebound on improved enterprise-SSD pricing couldn’t offset the week’s damage. |
| SPCX | -14.67% | – | – | Fell below its $135 IPO price for the first time; scrubbed the Starship Flight 13 launch on Raptor engine failures; credit-market stress (bonds trading at junk-like spreads) compounded post-IPO profit-taking, erasing more than $1 trillion in value from its peak. |
| INTC | -13.31% | +157.56% | +316.84% | Swept up in the broad semiconductor rout (TSMC capex fears, the Moonshot Chinese-AI-model scare); weak PC-demand reports added pressure; testing the $100 support level ahead of July 23 earnings. |
| MU | -13.31% | +195.45% | +649.56% | SK Hynix’s Nasdaq debut intensified HBM competition concerns and a disclosed Michael Burry short position added pressure; Wednesday’s Chinese-memory-competition (CXMT) scare and Thursday’s TSMC capex shock drove most of the decline before a Friday partial rebound on improved yields. |
| AMAT | -12.09% | +106.10% | +175.12% | Broad semiconductor-equipment selloff on capex-deceleration fears and reports of potential new China export restrictions; UBS raised its price target to $705 from $570 despite the weakness. |
— Institutional-grade intelligence for serious investors. Apply for membership at join.recessionalert.comC. WEEK’S TOP STORIES -> TOP
Two persistent threads dominated the week: the Hormuz war (#1), which widened daily without resolving, and an AI-capex credibility crisis (#2) that pushed chips into a bear market — both directly explain the Nasdaq’s underperformance and the VIX’s climb this week. A parallel M&A wave (#3, #6) tested how much risk dealmakers will absorb amid that volatility, while #4, #5, and #7 show markets pricing company-specific catalysts — a regulatory nod, a Street-divide resolution, a credit-stress test — independently of the macro noise. #8 is a reminder that operational risk, not just markets, can still move a name on its own.
UNCERTAIN
1. Hormuz War Escalates All Week: Blockade, Six Nights of US Strikes, Houthi Red Sea Threat — Oil Closes +15% as Energy Majors Hedge With $60B Iraq Pipeline Deal
The core facts:Monday, Trump reinstated the Strait of Hormuz naval blockade on Iran following weekend US strikes and Iranian counter-strikes on Jordan, Qatar, Kuwait, and Oman; WTI surged 9.13%. Tuesday, Trump narrowed the blockade to Iran-linked shipping only, dropping a blanket 20% toll, but enforcement proceeded. Wednesday through Friday brought six consecutive nights of US strikes on Iranian targets; Treasury revoked its Iranian-oil sanctions waiver effective July 17; Kuwait reported an Iranian strike on one of its desalination plants Friday; Strait transit volumes collapsed more than 60% versus pre-crisis levels. Friday, Iran reportedly directed Houthi forces to threaten closing the Bab al-Mandeb Strait (7% of global oil output) if the US strikes Iran’s power grid, while US energy majors led by Chevron signed roughly $60 billion in Iraq deals, including a Kirkuk-Baniyas pipeline consortium designed to bypass Hormuz entirely. WTI and Brent both closed the week up roughly 15.5%.
Why it matters:This is the week’s dominant, index-moving thread — a live military conflict that widened rather than resolved, compounding for five straight sessions and pulling oil, gas, and equity volatility along with it (Brent +15.94% WoW — see Energy table in Section B; VIX +24.68% WoW — see Vol & Treasuries table in Section B). Escalation without resolution — nightly strikes, a third country now hit, a second chokepoint threatened — argues the risk premium is structural for now, not a one-off spike investors can look through. The Iraq pipeline deal is the clearest evidence yet that US energy majors are treating Hormuz chokepoint risk as durable rather than transient.
What to watch:Whether the US follows through on striking Iran’s power grid (which would trigger the Houthi Red Sea threat), further attacks on Gulf-state infrastructure, and next week’s EIA inventory data for confirmation physical supply is being affected.
BEARISH
2. AI-Capex Doubt Triggers Rolling Semiconductor Selloff: Oracle Downgrade, SK Hynix Crash, NAND Rout, TSMC Capex Shock, and a Chinese AI Breakthrough Push the Chip Index Into a Bear Market
The core facts:Monday, Oracle fell to a 52-week low (-6.47%) after an S&P Global downgrade to BBB- on OpenAI customer-concentration risk and a projected $42B FY2027 free-cash-flow deficit; SK Hynix crashed 15.37% in Seoul (triggering a Kospi trading halt) on a profit-miss call, one day after its blockbuster Nasdaq debut; SanDisk fell 12.63% on a NAND guidance cut, dragging Intel, Lam Research, and Applied Materials down with it. Tuesday, chips rebounded (SMH +2.5%) as cooling CPI eased rate pressure. Wednesday, a fresh Chinese-memory-competition scare (ChangXin Memory Technologies) sent Micron down 8-9% and Intel/AMD/Marvell down 6-7%. Thursday, TSMC beat Q2 estimates but raised 2026 capex guidance to $60-64B from $52-56B, reigniting AI-spending-return doubts and dragging the Philadelphia Semiconductor Index down as much as 4%. Friday, Chinese AI startup Moonshot unveiled its Kimi K3 model claiming frontier-model parity; the SOX fell as much as 5.7%, confirming a technical bear market (>20% off its late-June record) and erasing roughly $3.3 trillion in global chip-sector value since June 22. The Nasdaq 100 closed the week down 4.13%.
Why it matters:This is the second consecutive week this exact debate has resurfaced — not whether AI demand is real, but whether the capital committed to building it out will earn an adequate return, and whether Chinese competitors can replicate frontier capability more cheaply. The crash-rebound-fresh-scare-deeper-crash pattern shows the market has no settled view yet, which is why AI-linked volatility is becoming a recurring rather than one-off feature of the tape (Nasdaq 100 -4.13% WoW, VIX +24.68% WoW — see Section B). The same week, IBM’s -25% earnings crash showed the flip side of the same debate: enterprise clients redirecting spend from software toward AI hardware — helping explain why cybersecurity/software names (PANW, CRWD) posted the week’s largest gains from within the very same Technology sector that posted its worst weekly return (-4.41% — see sector rotation table in Section B).
What to watch:Whether chip stocks stabilize or extend a third down week, Intel’s July 23 earnings for a read on PC-demand and capex trends, and any hyperscaler response to Moonshot’s capability claims.
BULLISH
3. Stripe and Advent Make $53 Billion Takeover Bid for PayPal, Shares Surge 16-17%
The core facts:Stripe and private-equity firm Advent International offered $60.50 per share — a 28% premium to Tuesday’s close — to acquire PayPal in a deal valuing the company above $53 billion, with Stripe and Advent each taking a 50% stake and roughly $50 billion in committed bank financing already arranged. PayPal shares surged 16-17% to roughly $55 on the report. PayPal’s board is expected to meet as soon as July 20 to discuss the offer; neither company has commented publicly.
Why it matters:A formal, financed bid for one of the largest independent payments platforms — from its most direct fintech rival — would be one of the largest deals in payments-industry history and signals real acquisition appetite even at current valuations. The size of the premium suggests PayPal’s board may face pressure to engage rather than dismiss the approach outright, though nothing is confirmed or agreed.
What to watch:Confirmation or denial from PayPal’s board at its July 20 meeting, and any regulatory read-through given Stripe and PayPal’s combined share of US online payments processing.
BULLISH
4. Apple’s Bull/Bear Street Divide Resolves Bullish as China AI Approval Sends Shares to a Record High
The core facts:Monday, Citi raised its Apple price target to $365 from $315 ahead of July 30 earnings, citing resilient market-share gains. Tuesday, KeyBanc issued a rare Underweight downgrade ($250 target), citing slowing hardware-spending data and elevated valuation. Wednesday, China’s Cyberspace Administration approved Apple Intelligence for the Chinese market — ending a roughly 22-month wait — running on Alibaba’s Qwen models and Baidu technology; shares rose about 4% to a new all-time high near $325.65, with Q2 mainland iPhone shipments already up 24.4% even as the broader Chinese smartphone market slipped 4.3%.
Why it matters:The China approval directly rebuts the KeyBanc bear case — that Apple is losing share to domestic AI-enabled rivals — just one day after that call was made, and is the market’s clearest answer yet to the Street’s genuine split on the stock heading into July 30 earnings.
What to watch:Confirmation of an actual China launch date for Apple Intelligence, and whether the approval shows up in iPhone unit-demand data ahead of the July 30 print.
BEARISH
5. SpaceX Slides Below Its IPO Price as Starship Scrub Compounds Credit-Market Jitters, Erasing Over $1 Trillion From Peak Value
The core facts:Wednesday, SpaceX shares closed around $135.27, dipping 1-2% and falling below their $135 IPO price for the first time since the June 12 listing (the largest IPO in history at a $1.77 trillion valuation), on continued profit-taking, early-investor position unwinds, and concerns over $25 billion in newly issued debt. Thursday, the company scrubbed its first post-IPO Starship launch attempt (Flight 13) in the final seconds after four of the Super Heavy booster’s 33 Raptor 3 engines failed to ignite; shares fell roughly 3.5% on top of Wednesday’s decline. Friday, shares fell a further 5.4% to $123.99, with the stock’s slide from its post-listing peak erasing more than $1 trillion in market value.
Why it matters:This was the market’s first live test of how newly public SpaceX shares react to genuine operational and financial stress, and the answer was a further leg down rather than a shrug — the stock is now meaningfully underwater versus its IPO price without a single catastrophic failure, just a scrub and accumulating debt concerns. That sensitivity suggests investors are pricing execution risk aggressively now that it shows up in a tradeable equity, worth watching given SpaceX’s outsized influence on how markets price the broader AI-infrastructure buildout.
What to watch:The rescheduled Starship Flight 13 attempt, expected as soon as early next week, and any formal rating action on SpaceX’s bonds, which were already trading at junk-equivalent spreads.
UNCERTAIN
6. Writers Guild and State AGs Sue to Block Paramount’s $111 Billion Warner Bros. Discovery Acquisition
The core facts:The Writers Guild of America West and East filed suit in the US District Court for the Northern District of California Tuesday, seeking to block Paramount Skydance’s proposed $111 billion acquisition of Warner Bros. Discovery, alleging the deal would suppress writers’ wages and reduce employment opportunities in violation of federal antitrust law. The WGA suit followed a separate lawsuit filed a day earlier by 12 Democratic state attorneys general challenging the deal on antitrust grounds. Paramount said it still plans to close the merger by the end of September despite both legal challenges.
Why it matters:Two distinct legal challenges — one from state regulators, one from a major labor union — filed within 24 hours of each other broadens the deal’s legal exposure beyond a single theory of antitrust harm and signals coordinated opposition is building around one of the year’s largest media transactions.
What to watch:Whether Paramount’s September closing timeline holds as both lawsuits proceed, and whether additional parties join the opposition.
BULLISH
7. FAA Restores Boeing’s Authority to Self-Certify 737 MAX and 787 Jets as Airworthy
The core facts:The FAA said Friday that Boeing can resume issuing its own airworthiness certificates for all 737 MAX and 787 aircraft starting July 20, ending federal oversight that began in 2019 for the MAX (after two fatal crashes) and 2022 for the 787 (over production-quality concerns). The agency cited eight months of comparable production-quality findings between Boeing’s own checks and the FAA’s parallel reviews as the basis for returning the authority.
Why it matters:This is the clearest regulatory signal yet that Boeing’s post-crisis production-quality remediation has satisfied its primary safety regulator, removing a multi-year overhang on delivery cadence and margin normalization for both jet programs — a key driver of the free-cash-flow recovery the market has been waiting on.
What to watch:Boeing’s delivery cadence in the weeks following the July 20 effective date for early evidence the restored authority is translating into a faster production ramp.
BEARISH
8. Coca-Cola’s fairlife Dairy Halts US Production After Ransomware Attack
The core facts:Coca-Cola disclosed that its fairlife LLC dairy subsidiary detected unauthorized third-party access to a portion of its systems, including production-related systems, in a ransomware event that forced a temporary halt to US fairlife manufacturing (Canadian operations unaffected). The company activated incident-response and business-continuity protocols and notified law enforcement; no ransomware group had claimed responsibility as of Friday, and Coca-Cola said product quality and safety have not been compromised. Shares fell nearly 4% even though the stock had been outperforming the S&P 500 year-to-date (+22% vs. +11%) heading into the incident.
Why it matters:fairlife has been one of Coca-Cola’s fastest-growing brands, so a production halt of unknown duration creates a direct, quantifiable near-term revenue risk in a high-growth segment — distinct from the more typical reputational-only fallout of a data breach. The lack of clarity on both duration and whether business data was exfiltrated leaves the size of the eventual financial impact unresolved.
What to watch:Any Coca-Cola update on fairlife production-restart timing, and whether a ransomware group claims responsibility or leaks stolen data.
— Separating signal from noise since 2007. Apply for membership at join.recessionalert.comD. WEEK IN THE ECONOMY -> TOP
This week fits Policy-vs-Data Divergence: June CPI and PPI delivered the year’s coolest inflation prints, yet four Fed voices — Waller, Warsh, Logan, Hammack — turned more hawkish across the same five sessions, with Wednesday’s testimony exposing a genuinely split FOMC (Williams for holding, Cook “prepared to act”). Markets partly believed the data — July hike odds collapsed to 17% post-CPI, and Polymarket’s 2026 hike-odds fell a net 8pp on the week (59%→51% — see Polymarket table below) even as Fed rhetoric hardened — though the 10Y round-tripped rather than sustaining its decline (10Y -0.9bps WoW — see Vol & Treasuries table in Section B) as Friday’s Hammack remarks reintroduced hawkish risk. Housing deteriorated on every release (pending sales, builder confidence, permits), while labor cooled only gradually. Thursday’s initial jobless claims print (Jul 23) and the July 28-29 FOMC meeting are next up to resolve whether the hawks or the cooling data prevail.
POLYMARKET ODDS — WEEK-ON-WEEK SHIFT:
| Market | Last Friday | This Friday | Δ |
|---|---|---|---|
| US Recession by end-2026 | 11% | 12% | +1 pp |
| Fed rate hike in 2026 | 59% | 51% | -8 pp |
| Fed rate cuts ≥1 in 2026 | 21% | 22% | +1 pp |
UNCERTAIN
1. June CPI and PPI Both Cool Sharply, but a Hawkish Fed Chorus Pushes Back (BLS, Tue Jul 14 & Wed Jul 15)
What they’re saying:Tuesday’s June CPI fell 0.4% m/m (vs. -0.1% consensus), pulling the annual rate to 3.5% from May’s 4.2%; core CPI was flat (vs. +0.2% expected). Wednesday’s June PPI fell 0.3% m/m (vs. flat consensus), with core PPI easing to 4.7% y/y from 4.9%. The combined miss collapsed July Fed-hike odds from 42% Monday to 17% after CPI, then pushed CME FedWatch’s July-hold probability to 87.7% after PPI.
The context:Despite the two-day disinflation surprise, the Fed refused to declare victory — Chair Warsh’s House and Senate testimony both stopped short of any dovish pivot, Chicago’s Goolsbee warned against reading one print as a trend, and by week’s end Cook, Logan, and Hammack had all floated further tightening. The 10Y round-tripped rather than sustaining its post-CPI decline (10Y -0.9bps WoW — see Vol & Treasuries table in Section B).
What to watch:June PCE inflation (due later this month) for confirmation the disinflation is broadening beyond energy-driven components; the July 28-29 FOMC meeting.
BEARISH
2. Fed’s Hawkish Chorus Builds All Week — Waller, Warsh, Logan, and Hammack All Warn on Inflation Despite Cooling Data (Federal Reserve, Mon Jul 13 – Fri Jul 17)
What they’re saying:Monday, Governor Waller warned a rate hike may be needed if CPI stayed hot. Tuesday and Wednesday, Chair Warsh’s House and Senate testimony refused to declare the inflation fight won even after CPI cooled, while Wednesday’s hearing also revealed a genuinely split FOMC — Williams backing a hold, Cook saying she’s “prepared to act.” Thursday, Dallas Fed’s Logan said “modestly higher” rates would better balance the Fed’s mandate. Friday, Cleveland Fed’s Hammack called inflation her “bigger concern,” saying businesses are telling her the Fed needs to act for the first time in her tenure.
The context:Four distinct Fed voices turned more hawkish across five sessions that also delivered the year’s two coolest inflation prints — a genuine committee-level disagreement about how much weight to give backward-looking disinflation. Markets still price low odds of a July hike, but the accumulating hawkish commentary reframes September/October as the more contested window.
What to watch:Whether additional FOMC voters echo the hawkish camp before the July 28-29 meeting blackout period begins.
UNCERTAIN
3. Jobless Claims Fall to a 10-Week Low Even as ADP’s Weekly Hiring Pulse Decelerates for a Third Straight Week (DOL / ADP, Mon Jul 13 & Thu Jul 16)
What they’re saying:Monday, ADP’s weekly NER Pulse showed private employers adding an average of roughly 19,750 jobs per week over the four weeks ended June 27, a third consecutive weekly deceleration. Thursday, initial jobless claims fell 8,000 to 208,000 for the week ended July 11 — well below the 217,000 consensus and the lowest level in 10 weeks.
The context:The two labor gauges point in different directions at different frequencies — the slow-moving ADP pulse shows hiring cooling, while the volatile weekly claims number shows no acute layoff stress. Economists describe the combination as “slow hire, slow fire,” a labor market cooling gradually rather than cracking, which gives Fed hawks room to keep citing labor resilience even as the hiring pace itself decelerates.
What to watch:Next month’s payrolls report, and whether ADP’s weekly deceleration eventually shows up in the claims data.
BEARISH
4. Housing Slowdown Deepens: Pending Sales Sink 5.4%, Builder Confidence Extends 15-Month Funk, Permits Hit a 10-Month Low (NAR / NAHB / Census, Thu Jul 16 & Fri Jul 17)
What they’re saying:Thursday, June pending home sales fell 5.4% m/m (vs. -0.5% expected), and NAHB builder confidence slipped to 34 — a 15th straight sub-40 reading, the longest such stretch since 2012, with 37% of builders cutting prices in July. Friday, June housing starts jumped 19% to 1.427 million (driven almost entirely by multifamily), but building permits — the more forward-looking gauge — fell 3.0% to a 10-month low of 1.367 million, missing estimates.
The context:Every housing data point released this week pointed the same direction once the multifamily-driven starts headline is set aside: contract signings falling, builders cutting prices for a third straight month, and permits — the actual pipeline for future construction — at a 10-month low. The 30-year mortgage rate at 6.64% (a near one-year high) is the common thread across all four releases.
What to watch:June/July existing and new home sales for demand-side confirmation, and mortgage-rate trajectory into Q3.
UNCERTAIN
5. Consumer Sentiment Jumps to a Five-Month High on Cheaper Gas, Even as Retail Sales Growth Slows to 0.2% (University of Michigan / Census Bureau, Thu Jul 16 & Fri Jul 17)
What they’re saying:Thursday, June retail sales rose just 0.2% m/m (vs. 0.3% expected), down sharply from May’s 1.0% gain — though sales excluding gas stations rose a solid 0.7%, with online retail up 1.9% on Prime Day promotions. Friday, the University of Michigan’s preliminary July Consumer Sentiment Index jumped to 54.4 from 49.5, blowing past the 51.0 consensus to its highest level since February, with easing gas prices doing the heavy lifting across all five subcomponents.
The context:Composition matters more than the headlines here — falling gas prices mechanically dragged down the retail-sales total even as underlying, ex-energy consumer spending held up, and the same falling gas prices are what’s driving the sentiment bounce. Both releases describe the same consumer, relieved at the pump but still 12% below year-ago sentiment levels.
What to watch:July retail sales and the final University of Michigan reading at month-end for confirmation the gas-price relief is translating into durable spending strength.
— Know the probability before the market prices in the risk. Apply for membership at join.recessionalert.comE. WEEK IN EARNINGS -> TOP
TOP EARNINGS OF THE WEEK
BEARISH
1. International Business Machines (IBM): -25.21% | Worst Day Since 1987 as Clients Divert Spend From Software to AI Hardware
The Numbers:EPS $2.93 vs. $3.01 est. (-2.74%); GAAP EPS $2.27 vs. $2.58 est. (-11.90%); revenue $17.20B vs. $17.86B est. (-3.70%). Reported Tuesday, Jul 14, BMO.
The Problem/Win:CEO Arvind Krishna acknowledged execution missteps and said enterprise clients are aggressively redirecting quarterly capex away from software and mainframes toward AI infrastructure, storage, and memory purchases, with several major deals failing to close in the quarter. Thursday’s partial rebound recovered only a small fraction of the loss.
The Ripple:Triggered a broad software-sector selloff (iShares Expanded Tech-Software ETF -4.5%, Workday -10%, Salesforce -6.2%, Microsoft -3%, Oracle -2.1%) while cybersecurity names CrowdStrike (+9.4% that day) and Palo Alto Networks (+6.6%) diverged sharply higher — the same divergence that carried through the full week and shows up in this week’s Technology sector split (see sector rotation table in Section B).
What It Means:The magnitude and specificity of IBM’s capex-diversion commentary make this more than a company-specific miss — it is a data point the market weighed heavily all week in the broader debate over whether AI-infrastructure spending is displacing traditional enterprise software budgets, a debate that also drove the semiconductor sector into a bear market by Friday.
What to watch:Whether peer enterprise software names (SAP, ServiceNow, Adobe) echo similar capex-diversion commentary in their upcoming reports.
BULLISH
2. Goldman Sachs (GS): +9.16% | Record $7.42B Trading Quarter Sends Stock to an All-Time High
The Numbers:EPS $20.98 vs. $14.51 est. (+44.62%); revenue $20.34B vs. $16.22B est. (+25.35%). Global Banking & Markets revenue rose 53% to $15.52B, with Equities revenue up 72% and Equity Underwriting up 130%. Reported Tuesday, Jul 14, BMO.
The Problem/Win:A third consecutive quarterly record in equities trading, with quarterly trading revenue alone now exceeding Goldman’s full-year 2019 total — an extraordinary run driven by elevated market volatility around AI and the Iran conflict.
The Ripple:The scale of the beat pulled the stock to a fresh all-time high and anchored the financials sector’s outperformance (Financial +0.61% WoW) against a falling software/chip complex; Bank of America and Morgan Stanley both confirmed the same trading-revenue tailwind in their own reports this week.
What It Means:Goldman’s trading franchise is capturing outsized benefit from the same volatility — AI-driven equity swings, geopolitical risk — that pressured other parts of the market this week, a genuine hedge characteristic within a diversified portfolio.
What to watch:Whether elevated trading volumes and volatility persist into Q3 or normalize as the Iran conflict and AI-capex debate resolve one way or another.
BULLISH
3. UnitedHealth Group (UNH): +1.16% | Blowout Beat Drives Guidance Raise as Medical Costs Improve
The Numbers:Revenue $112.0B beat the $110.81B estimate; adjusted EPS $6.38 crushed the $4.91 estimate (+30% surprise); GAAP EPS $6.04. The medical care ratio improved to 86.7% from 89.4% a year ago. Reported Thursday, Jul 16, BMO.
The Problem/Win:A sharp medical-cost recovery — UnitedHealthcare’s operating margin rose to 4.6% from 2.4% a year ago, and Optum expanded margin by 160 basis points — showing the pricing and cost-discipline actions management outlined earlier in the year are taking hold faster than expected.
The Ripple:The improved medical-cost trend is a positive read-through for peer managed-care names (Cigna, Humana, Elevance) heading into their own Q2 reports, since it suggests the industry-wide utilization pressure that hammered 2025 results may be easing.
What It Means:The results support UnitedHealth’s turnaround narrative after a difficult 2025, though the modest +1.16% stock reaction suggests much of the good news was already priced in given the stock’s run into the print.
What to watch:The company’s raised full-year adjusted EPS guidance of $19.50-$20.00 and next quarter’s medical care ratio for confirmation the cost discipline is durable.
WEEK AHEAD PREVIEW:
Q2 2026 earnings season is just getting underway (~10% of the S&P 500 reported), with the pace accelerating sharply next week.
Charles Schwab (SCHW) — BMO, Tue Jul 21 — EPS est. $1.56; net interest income trends will be closely watched given this week’s hawkish Fed repricing (Logan, Hammack) and its potential to reshape the rate-cut timeline baked into brokerage and asset-gathering estimates.
Danaher (DHR) — BMO, Tue Jul 21 — EPS est. $1.84; first full quarter post-Masimo acquisition, with integration progress and life-sciences demand trends in focus.
Capital One Financial (COF) — AMC, Tue Jul 21 — EPS est. $4.69; Discover integration synergies remain the central focus, with today’s hawkish Fed repricing also relevant for NII-sensitive card lenders.
Earnings season accelerates further the following week, as 86 S&P 500 companies — including 4 Dow 30 components — are scheduled to report.
— US market commentary trusted by family offices and institutions. Apply for membership at join.recessionalert.comF. NEXT WEEK SETUP -> TOP
UPCOMING RELEASES:
| Date | Event | Why It Matters |
|---|---|---|
| Mon, Jul 20 | CB Leading Index MoM (Jun) | Composite of forward-looking indicators used as an early recession-risk gauge. |
| Tue, Jul 21 | ADP Employment Change (Weekly) | Will show whether the third-straight-week hiring deceleration flagged this week continued. |
| Wed, Jul 22 | MBA 30-Year Mortgage Rate | Weekly mortgage-rate benchmark, directly relevant after housing data deteriorated across every release this week. |
| Wed, Jul 22 | EIA Crude Oil Stocks Change | Weekly US crude inventory data — a read on physical supply amid the ongoing Hormuz disruption. |
| Wed, Jul 22 | EIA Gasoline Stocks Change | Weekly gasoline inventory data, relevant to the consumer fuel-price story running through this week’s sentiment and retail-sales prints. |
| Thu, Jul 23 | Chicago Fed National Activity Index (Jun) | Broad monthly gauge of national economic activity across production, employment, and sales. |
| Thu, Jul 23 | Initial Jobless Claims | Last week’s reading hit a 10-week low — a key data point in the hawks-vs-cooling-data tension heading into the July 28-29 FOMC meeting. |
| Fri, Jul 24 | New Home Sales (Jun) | Demand-side housing gauge, following this week’s weak pending-sales and permits data. |
WHAT TO WATCH NEXT WEEK:
1. With the Strait of Hormuz war still escalating and Iran now threatening a second chokepoint via the Houthis, does oil’s roughly 15% weekly gain have further room to run, or does the $60B Iraq pipeline deal mark the point where markets start pricing a structural workaround?
2. Can the chip sector find a floor next week, or does Intel’s July 23 earnings report — the next major semiconductor print — extend the AI-capex credibility crisis that pushed the SOX into a bear market this week?
3. With Cleveland’s Hammack joining Logan, Waller, and Warsh in the hawkish camp despite two straight cool inflation prints, does Thursday’s jobless claims data tip the committee’s internal debate toward the doves before the July 28-29 FOMC blackout begins?
4. Does PayPal’s board engagement with Stripe’s $53B bid, expected as soon as July 20, set off a wave of fintech consolidation, or fizzle the way prior unsolicited approaches in payments have?
— US market commentary trusted by family offices and institutions. Apply for membership at join.recessionalert.comG. CHART OF THE WEEK -> TOP
WHY THIS CHARTThis chart wins because it’s the week’s most direct rebuttal to the headline narrative: even as the Strait of Hormuz war dominated every single session and pushed oil up roughly 15% on the week, the market’s own front-end inflation-swap pricing said investors judged the shock contained rather than inflationary — a genuinely counter-intuitive signal that never showed up in the week’s price action or Fed commentary.
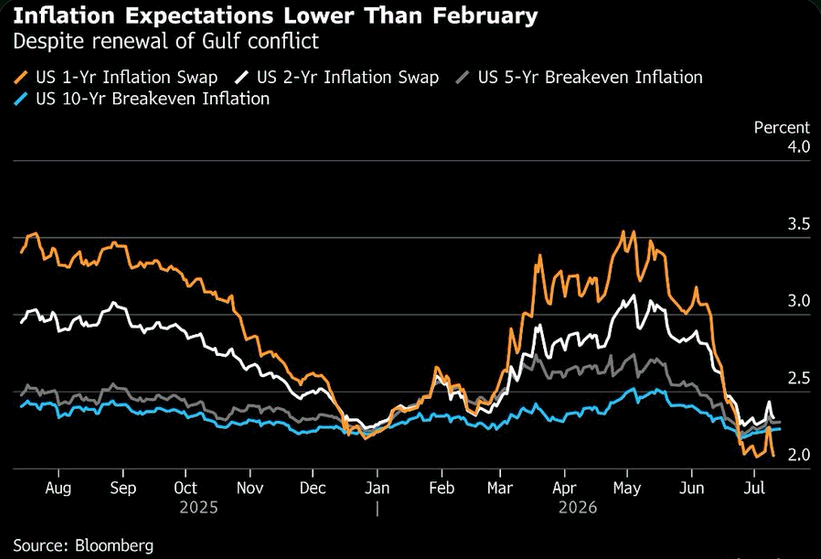
ORIGINAL CHART ANALYSIS — FROM MONDAY’S MIBFront-end inflation swaps run on oil, so a fresh Gulf war should have torched the 1-year first — instead it fell furthest and fastest. That is the whole story. The series that led the entire complex higher has re-inverted to the bottom of the stack: the US 1-Yr swap, top of the curve at roughly 3.5% in May, has round-tripped the spring reflation scare down to about 2.0% — printing beneath even the 10-Yr breakeven near 2.15%, which never left its ~2.1–2.4% band. Read that literally: the market now prices less inflation over the next year than over the next decade, straight through a live oil-shock catalyst. The mechanics explain the shape. The front end carries the market’s oil beta; the long end reflects the Fed’s anchor. A conflict only reprices inflation if it actually removes barrels — and the market judges this one contained, no sustained outage, spare capacity absorbing it. Stack demand-side softness on top and pass-through dies at the pump. Households, anchored to gasoline, still brace for higher prices; the traded market disagrees, and the traded market clears. An inverted expectations curve hands the Fed cover to cut — but it is also how a growth scare announces itself. Those two look identical until one of them arrives.
MIB Weekly Digest Ver. 1.72
For professional investors only. Not investment advice.
© 2026 RecessionALERT.com

Comments are closed.