
MIB WEEKLY DIGEST
Week of Sep 28–Oct 2, 2026
A global long-bond rout drove the week: the 10-year Treasury yield touched 5.34% Thursday, its highest since 2002, and finished 10.9 bps higher even as a cooler August PCE and a 29,000 September payrolls print cut October Fed-hike odds to about 23%. Chip equipment carried the Nasdaq 100 to a Friday record — Applied Materials (AMAT) +11.35%, Lam Research (LRCX) +10.24%, KLA (KLAC) +10.09% — while the S&P 500 (−0.27%) and Dow (−1.26%) fell. Gold lost 3.48% despite repeated Hormuz ship strikes, and China’s fuel-export halt lifted Brent until a G7 release. Anthropic’s targeted $2 trillion IPO showed the AI build-out turning to the capital markets.
TABLE OF CONTENTS
A. WEEK AT A GLANCE
B. WEEK IN MARKETS
C. WEEK’S TOP STORIES (8)
D. WEEK IN THE ECONOMY (5)
E. WEEK IN EARNINGS (2)
F. NEXT WEEK SETUP
G. CHART OF THE WEEK
A. WEEK AT A GLANCE -> TOP
The S&P 500 slipped 0.27% and the Dow 1.26% on the week even as the Nasdaq 100 closed Friday at a record, a split drawn by a global long-bond rout that took the 10-year Treasury yield to 5.34% intraday. The Fed side eased — October hike odds fell from about two-in-three to one-in-four on Williams’ patience, a cooler August PCE and a 29,000 payrolls print — but the long end refused to follow, steepening the curve by 14 basis points. With the Iran war spreading into diesel markets and both Gulf chokepoints under fire, long-term rates rather than Fed policy are now the market’s binding constraint.
• Global long-bond rout: the 10-year touched 5.34% Thursday, its highest since 2002, and finished the week 10.9 bps higher at 5.276% while the 2-year fell 3.5 bps.
• Chip equipment leads a Nasdaq 100 record: AMAT +11.35%, LRCX +10.24% and KLAC +10.09% topped the $200 billion-plus weekly leaderboard as the index closed Friday at 30,807.93.
• Payrolls +29,000 vs. about 90,000 expected: with 60,000 revised away and unemployment at 4.2%, October hike odds fell to about 23% — but Polymarket still prices a 2026 hike at 100%.
• Metals fail as a war hedge: gold −3.48% and silver −6.06% after Monday’s rate-and-dollar shock, in a week when at least six ships were struck in the Strait of Hormuz.
• Diesel becomes the pinch point: China halted fuel exports and December Brent rose 5.48% on the week, while the G7 answered with a 100-million-barrel release.
• Earnings podium: Accenture (ACN) +15.78% on a revenue beat above its own range, and Micron’s (MU) record $54.2 billion quarter and $61.5 billion guide fed the chip rally.
1. The bond market is tightening for the Fed — Every soft data point this week pushed October hike odds lower, yet the 10-year rose 10.9 bps, mortgage rates passed 7.25%, junk CDS widened to April levels and Financials finished last, so financial conditions tightened even as the expected policy path eased.
2. Real yields outranked the war — In a week of ship strikes, troop deployments and a Chinese fuel-export halt that lifted Brent, gold and silver still fell hard, showing that the cost of holding a zero-yield asset now matters more to its price than geopolitical risk.
3. AI’s question moved from demand to financing — OpenAI’s revenue run-rate and Micron’s guide settled the demand debate for the week, while Anthropic’s IPO plan, Broadcom’s $42 billion loan and Amazon’s chip leaseback showed the build-out leaning on vendor credit and capital markets just as long-term borrowing costs hit multi-decade highs.
 — Leading economic indicators. Accurate market forecasts. Apply for membership at join.recessionalert.com
B. WEEK IN MARKETS -> TOP
A global long-bond rout set the week’s terms. The 10-year Treasury yield closed at fresh highs on Monday and Wednesday and touched 5.34% on Thursday as French and UK yields hit multi-decade peaks, even as Williams’ “no need for urgency,” a cooler August PCE and a 29,000 September payrolls print pushed October hike odds from roughly two-in-three to about one-in-four. Equities banked that timing relief only at the very top: the Nasdaq 100 closed Friday at a record on a chip-equipment rally, while the S&P 500, Dow and NYSE Composite finished lower and losses reached seven sectors, led by Financials. The sharpest divergence ran through the war trades — China’s fuel-export halt and a run of Hormuz ship strikes lifted Brent, yet gold never recovered from Monday’s rate-driven plunge. Long rates, not the Fed, are now the binding constraint.
FRIDAY CLOSE & WEEK-ON-WEEK CHANGE — Fri, Oct 2, 2026:
MAJOR INDICES
Dow Theory produced the week’s clearest index signal, and it ran against the industrials: transports out-gained the Dow by 3.5 points, a gap that built in four of five sessions and widened sharply Friday, when a 1.58-point single-session split carried the transports back above 20,000. Both averages bottomed together in Wednesday’s late selloff — transports at a five-month low — but only the transports rebounded with conviction, while the Dow carried bank and healthcare members on the weekly decliners list. Neither breadth signal fired; the Nasdaq 100’s record leaned on the same chip names that topped the weekly leaderboard.
| Index | Fri Close | WoW Change | WoW % | Why It Moved (Week) |
|---|---|---|---|---|
| S&P 500 | 7,722.72 | −20.69 | −0.27% | Lower Monday through Wednesday as the 10-year set fresh closing highs; Thursday’s yield reversal and Friday’s payroll-driven rally recovered most, but not all, of the loss. |
| Dow Jones | 51,176.96 | −651.66 | −1.26% | The weakest major average: four straight sessions without a meaningful gain, capped by Wednesday’s 0.86% late-day slide across financials, healthcare and staples; Friday’s 0.49% rise lagged every other index. |
| DJ Transportation | 20,009.75 | +437.53 | +2.24% | A V-shaped week: a five-month low on Wednesday, then gains of 1.15% Thursday and 2.07% Friday took it back above 20,000 for the first time since September 18. No transport-specific catalyst was identified. |
| Nasdaq 100 | 30,807.93 | +199.79 | +0.65% | Monday’s 1.08% AI-led drop on a rival-agent report was followed by four straight gains led by chip equipment and Micron’s record quarter, ending at a record close Friday. |
| Russell 2000 | 2,832.90 | −4.65 | −0.16% | Three losing sessions to start the week, then Thursday’s front-end rally and Friday’s drop in hike odds lifted it back near flat. |
| NYSE Composite | 23,654.31 | −258.28 | −1.08% | Breadth told the real story: Wednesday’s 0.92% drop, with 10 of 11 sectors lower, outweighed a two-day recovery and left a weekly loss four times the S&P 500’s. |
VOLATILITY & TREASURIES
The curve carried the week’s message: a 14-basis-point bear steepening, front end down and long end up, says investors spent five sessions pushing the next hike later while demanding more to hold duration. Williams’ patience, a cooler PCE and a 29,000 payrolls print each moved the timing; none of them gave the long end a floor. The dollar’s climb to a five-month high on Thursday, alongside falling hike odds, came as the euro slid and European long yields hit multi-decade highs — a global rate shock, not a US one.
| Instrument | Fri Level | WoW Change | Why It Moved (Week) |
|---|---|---|---|
| VIX | 15.31 | +0.44 (+2.96%) | Jumped 8.07% Monday on Trump’s rejection of Iran’s proposal and the yield spike, held near 16 through Thursday’s intraday spike to 17.59, and gave most of it back Friday when payrolls cut hike odds. |
| 10-Year Treasury Yield | 5.276% | +10.9 bps | A global term-premium repricing: closes of 5.241% Monday and 5.292% Wednesday, an intraday 5.34% Thursday alongside French and UK multi-decade highs, then a Friday reversal higher after an early payroll-driven dip to 5.154%. |
| 2-Year Treasury Yield | 4.829% | −3.5 bps | Fell as the next hike was pushed out: Williams’ “no need for urgency” took 4.7 bps off Tuesday and Thursday’s rally another 10.2 bps, partly offset by Monday’s 6.4 bp rise and Friday’s reversal from a 4.712% intraday low. |
| US Dollar Index (DXY) | 101.92 | +0.90 (+0.89%) | Higher in four of five sessions, reaching its highest close in more than five months on Thursday as EUR/USD fell 0.77%; Friday’s payroll miss trimmed only a fraction. |
COMMODITIES
Monday’s rate-and-dollar shock set the metals’ week and nothing afterwards repaired it: every metal finished lower, precious and industrial alike, so there was no haven-versus-growth split to read. That gold failed as a war hedge in a week when Hormuz strikes multiplied and Brent rallied says real yields, not geopolitics, now set its price. Bitcoin decoupled from both camps, ending slightly higher on the strength of Thursday’s gain, when Citi raised its central Bitcoin forecast and the SEC proposed a crypto custody pathway.
| Asset | Fri Price | WoW Change | WoW % | Why It Moved (Week) |
|---|---|---|---|---|
| Gold | $4,170.65/oz | −$150.50 | −3.48% | Monday’s 4.02% plunge to its lowest close since August 4, on surging yields and Fed-hike bets, dominated the week; three modest up days did not recover it, and Friday reversed from an intraday $4,256.50. |
| Silver | $60.798/oz | −$3.920 | −6.06% | The steepest metals loss: Monday’s 5.83% drop in the same rate-and-dollar selloff was never recovered, with Thursday’s 1.31% bounce erased on either side. |
| Copper | $6.5910/lb | −$0.1853 | −2.73% | Fell 2.37% Monday as rising global rate expectations hit industrial metals, then traded sideways; no industrial-demand catalyst was identified. |
| Platinum | $1,710.40/oz | −$66.10 | −3.72% | Lost 3.46% Monday and 1.30% Tuesday before a partial midweek rebound, moving with the rate-driven precious-metals selloff. |
| Bitcoin | $84,429.0 | +$379.0 | +0.45% | A 1.15% Monday dip with the risk-off tape was recovered by Thursday’s 1.18% gain, when Citi raised its base-case forecast to $113,000 and the SEC proposed letting state trust companies custody crypto. |
ENERGY
Compared like-for-like on the December contract, Brent outran WTI by nearly seven points, the signature of a squeeze centred outside the US: China’s Thursday suspension of fuel exports and repeated Hormuz strikes lifted the global benchmark, while Tuesday’s Yanbu loadings and Friday’s G7 release weighed hardest on the domestic one. Gas split the same way across the Atlantic, Henry Hub lower and Dutch TTF higher. Brent climbing through a week of rising long yields is a supply-shock read, not a demand signal.
| Asset | Fri Price | WoW Change | WoW % | Why It Moved (Week) |
|---|---|---|---|---|
| Crude Oil (WTI) | $91.40/bbl | −$1.31 | −1.41% | Tuesday’s 3.98% slide on resumed Saudi loadings at Yanbu and US-Iran contacts through mediators outweighed Thursday’s 2.70% jump on China’s fuel-export halt; Friday’s G7 100-million-barrel release settled it 1.9% lower. |
| Crude Oil (Brent) | $102.78/bbl | +$5.34 | +5.48% | Measured on the December contract, which closed September 25 at $97.44; the $104.64 quoted that day was the expiring November contract. Thursday’s 4.27% jump on China’s fuel-export suspension and reports of a US military build-up drove the gain, widening the premium over WTI to more than $11. |
| Natural Gas (Henry Hub) | $3.044/MMBtu | −$0.142 | −4.46% | Fell Monday through Thursday, including on the day EIA reported a 64 Bcf injection that left stocks above the five-year average (not established as the cause); a 2.60% Friday bounce had no identified catalyst. |
| Natural Gas (Dutch TTF) | $25.24/MMBtu | +$1.17 | +4.86% | Tuesday’s 6.19% drop was reversed by gains on Wednesday and Friday; no discrete European catalyst was identified, and euro swings added noise to the dollar-converted price. |
S&P 500 SECTORS — WEEKLY ROTATION
Technology is in regime leadership — first on the week, the month and six months — yet the weekly movers screen shows how narrow its latest leg was: chip-equipment makers Applied Materials, Lam Research and KLA took the top three spots with 10%-plus gains, so semiconductor capital equipment, not the broad sector, did the lifting. The decline was the opposite, broad-based: seven sectors lost ground, and Financials and Healthcare finished last with three banks and two drugmakers among the screen’s weekly decliners, a rate-driven rotation out of the market’s ballast rather than a single-name accident.
| Sector | 1-Week | 1-Month | 3-Month | 6-Month | YTD | 12-Month |
|---|---|---|---|---|---|---|
| Technology | +1.81% | +7.89% | +10.04% | +40.54% | +32.67% | +31.49% |
| Energy | +0.73% | −3.37% | +15.00% | +1.96% | +36.18% | +37.01% |
| Industrials | +0.70% | +0.79% | −8.37% | +3.03% | +9.94% | +11.36% |
| Utilities | +0.70% | −5.64% | −11.46% | −13.59% | −6.61% | −8.36% |
| Consumer Cyclical | −0.70% | −4.00% | −5.87% | +2.04% | −8.80% | −10.86% |
| Communication Services | −1.68% | +1.84% | −2.07% | +7.78% | +0.38% | +5.96% |
| Real Estate | −2.10% | −6.77% | −8.51% | −1.27% | +0.59% | −3.52% |
| Basic Materials | −2.18% | −7.73% | +0.57% | −2.28% | +10.80% | +18.65% |
| Consumer Defensive | −2.21% | −4.31% | −4.34% | −3.62% | +2.49% | +2.74% |
| Healthcare | −2.60% | −4.60% | −0.46% | +10.12% | +5.87% | +13.47% |
| Financial | −2.62% | −6.27% | −4.21% | +9.98% | +1.58% | +5.97% |
TOP WEEKLY MOVERS:
Two different setups topped the leaderboard. The chip-equipment trio had each lost ground over the past quarter, KLA by about 11%, despite 70%-plus gains this year and multi-thousand-percent decade runs, so the week resumes a long-term uptrend after a summer pause — and it is the reason Technology leads the sector table. The cybersecurity pair is momentum continuation instead: up more than 140% over six months and still accelerating over the past month. Among decliners, Netflix extends a slide that leaves it down 42% over the year, while both banks were already down about 10% over the quarter, in line with Financials finishing last.
TOP 5 WEEKLY GAINERS
| Ticker | Week | YTD | Year | Why It Moved |
|---|---|---|---|---|
| AMAT | +11.35% | +110.14% | +141.53% | No single confirmed catalyst; the weekly search surfaced no Applied Materials-specific news. It led Tuesday’s chip-equipment rebound (+5.19%) on the day Axios reported OpenAI’s revenue run-rate nearing $70 billion, and rallied again Thursday (+3.50%) after Micron’s record quarter and $61.5 billion guide; the Micron capacity read-through is likely but unverified as the driver. |
| LRCX | +10.24% | +103.00% | +136.40% | No single confirmed catalyst. Named among Bank of America’s top chip picks in a note reported Wednesday, which raised its AI data-center systems market estimate to $2.2 trillion, then gained 3.53% Thursday with the memory-equipment group after Micron’s results; a Micron capacity read-through is the likely link but unverified. |
| KLAC | +10.09% | +70.27% | +81.60% | No single catalyst — broad-sector or momentum move. Moved with Applied Materials and Lam Research in Tuesday’s (+3.89%) and Thursday’s (+2.77%) chip-equipment rallies; no KLA-specific news was identified for the week. |
| PANW | +7.61% | +118.91% | +92.66% | No single confirmed catalyst. Extended its September cybersecurity rally, which followed a fiscal fourth-quarter beat and fiscal 2027 revenue guidance of $14.1–$14.2 billion on September 1, with a 4.63% Monday gain that aggregators tied to a Unit 42 AI-defense launch and a Morgan Stanley target raise to $410 (neither verified as the driver), then added 2.29% Wednesday. |
| CRWD | +7.10% | +130.43% | +117.42% | No single catalyst — broad-sector or momentum move. Rose 2.82% Monday alongside Palo Alto Networks in a continuation of the September AI-security rally; the weekly search surfaced no dated CrowdStrike-specific news for the week. |
TOP 5 WEEKLY DECLINERS
| Ticker | Week | YTD | Year | Why It Moved |
|---|---|---|---|---|
| NFLX | −5.74% | −28.48% | −42.32% | No single catalyst — broad-sector or momentum move. Fell 2.49% Thursday despite a reported Guggenheim price-target increase to $80, and a further 1.16% Friday, with no company-specific news identified; the decline extends a downtrend that has cost the shares more than a quarter of their value this year. |
| JNJ | −5.60% | +23.72% | +37.67% | No single catalyst — broad-sector or momentum move. Fell 1.61% Tuesday and 2.30% Thursday with no company release found, as Healthcare finished the week second-worst among sectors. CMS finalized its mandatory GLOBE model, tying Medicare Part B drug rebates to international prices, on Wednesday, but no source linked it to the move. |
| GE | −5.36% | +0.50% | +3.38% | The FAA said on Monday it would delay certification of Boeing’s 737 MAX 10 until satisfied that a flight-guidance software issue is not a safety problem; Reuters reported the software was supplied by GE Aerospace, which fell about 3% that day. |
| BAC | −5.20% | −2.27% | +6.48% | Evercore ISI (to $62 from $67) and Truist (to $62 from $65) cut their price targets on October 1 ahead of third-quarter results, as high-yield CDS hit their widest since early April and the KBW Nasdaq Bank Index fell as much as 2.4% intraday, leaving it more than 13% below its mid-August peak. |
| C | −4.30% | +10.12% | +32.01% | No single catalyst — broad-sector or momentum move. No Citigroup-specific news was identified for the week; it fell with the large banks as rising long-term yields and wider junk CDS pressured the Financial sector, the week’s worst performer. |
— Institutional-grade intelligence for serious investors. Apply for membership at join.recessionalert.comC. WEEK’S TOP STORIES -> TOP
Eight stories, four threads. The price of money (#1, #2, #6) shows policymakers and bond investors pulling apart: officials argued only about when to tighten, while the long end tightened for them and the strain surfaced in bank credit. The energy war (#3, #5) moved from crude to diesel. The AI build-out (#4, #7) proved its demand and then its financing needs. Drug pricing (#8) stands alone. The first three threads converge on one constraint: every one of them now runs through the cost of long-term capital.
BEARISH
1. A Global Long-Bond Rout Takes the 10-Year to 5.34% Intraday, Its Highest Since 2002, and Leaves It 10.9 bps Higher on the Week as the Curve Bear-Steepens 14 bps
The core facts:Monday’s 5.241% close topped September 24’s 5.225% as stocks, bonds and metals sold off together. On Tuesday the 30-year yield touched 5.62% intraday, which Yahoo Finance described as its highest since 2002, even as the 2-year fell. Wednesday’s cooler August PCE did not stop the 10-year rising 5.0 bps to 5.292%, which Investing.com put at its highest since April 2002, and the MBA’s 30-year mortgage rate reached 7.30%, its highest since November 2023. On Thursday the selloff went global: the 10-year hit 5.34% early (Reuters), after the biggest quarterly rise in yields this century, while France’s 10-year reached its highest since 2002 near 5% and Britain’s 30-year gilt topped 6% for the first time since 1998, before bargain hunters pulled the US 10-year back to 5.244%. Friday’s soft payrolls drove it as low as 5.154%, but it reversed to close at 5.276%. Over the week the 10-year rose 10.9 bps and the 2-year fell 3.5 bps, widening 2s10s to 44.7 bps from 30.3.
Why it matters:A long end that rises while the front end falls is not pricing a more aggressive Fed; it is charging more to hold duration, and that is a form of tightening no amount of Fed patience can talk down. Because it was synchronised across the US, France, the UK and Japan, no single central bank owns the fix. The week showed exactly where it bites: mortgage rates above 7.25% on both the MBA and Freddie Mac surveys, Real Estate and Financials among the five worst sectors (see sector rotation table in Section B), and gold’s 3.5% weekly loss (see Commodities table). The S&P 500 and Dow finished lower even after Friday’s rally (see Major Indices table), and only the chip-led Nasdaq 100 outran the discount-rate pressure.
What to watch:Whether the 10-year closes above Wednesday’s 5.292% high; the MBA mortgage rate and the FOMC minutes, both on Wednesday, October 7; and the French 2027 budget’s passage as a gauge of how far the European leg spreads.
UNCERTAIN
2. The Fed Re-Times Its Next Hike Without Retreating: October Odds Fall From About Two-in-Three to One-in-Four as Williams Counsels Patience and Logan Calls for “50 Basis Points or More”
The core facts:Before Monday’s open, money markets priced a 65.9% chance of an October hike (FXStreet), and Governor Cook said that day that the labor market “appears to be well positioned to handle an increase in rates.” On Tuesday New York Fed President Williams said one more hike “may be appropriate late this year” but “there is no need for urgency,” and October pricing fell to just over 50%; Governor Barr said further adjustments are “likely to be needed” in his base case, and Chicago Fed President Goolsbee called 5-1/2 years above target “playing with fire.” After Wednesday’s cooler PCE the CME FedWatch probability fell to about 37% and Goldman Sachs moved its next-hike call to December. Thursday brought Vice Chair Jefferson naming energy as the predominant inflation driver, Kashkari holding no strong view on October while still projecting hikes in 2026 and 2027, and, that evening, Dallas Fed President Logan estimating the target range “needs to rise an additional 50 basis points or more.” Friday’s 29,000 payrolls print cut October odds to about 23%, while futures still priced a high probability of a December increase (Reuters).
Why it matters:Every official who addressed policy this week argued about the date, not the direction, and the market priced exactly that: October hike odds collapsed, yet Polymarket still holds a 2026 hike at 100% and at least one 2026 cut at 4%, both unchanged on the week (see Polymarket table in Section D). The 2-year finished only 3.5 bps lower (see Vol & Treasuries table), a reprieve on timing rather than a rethink. Logan’s count is the outlier worth noting — 50 basis points or more implies at least two further moves from a sitting voter — and it was framed on a 4.1% unemployment rate that Friday’s report lifted to 4.2%.
What to watch:Logan’s remarks on Tuesday, October 6 at 7:00 PM ET, for whether the payrolls miss changes her count; the FOMC minutes on Wednesday, October 7 at 2:00 PM ET; and the September CPI report ahead of the October 27–28 meeting.
BEARISH
3. Hormuz Diplomacy Stalls as Both Gulf Chokepoints Come Under Fire: Trump Rejects Iran’s Roadmap, Six Ships Are Struck in the Strait and Saudi Arabia Plans a Red Sea Offensive
The core facts:President Trump on Saturday, September 26 rejected Iran’s seven-day roadmap, which sought frozen funds, sanctions relief and an end to the US naval blockade in exchange for reopening the Strait of Hormuz, and QatarEnergy extended LNG force-majeure notices into November and December. Physical flows partly adapted: Kpler counted 12.5 million barrels loaded at Saudi Arabia’s Yanbu over Saturday to Monday and put Hormuz crude flows at about 77% of baseline, and September Middle East crude exports near 80% of pre-war levels, with Saudi exports more than doubling from August. The diplomacy did not: Iran received a US reply through Qatar, with the dispute now over “the sequencing of measures,” and on Thursday Treasury designated 26 more entities and individuals, including Iran Khodro and SAIPA, as reports said the US is sending a third carrier and up to 10,000 troops. On Friday UKMTO reported another tanker hit in the strait, at least the sixth vessel struck since Sunday, and Reuters reported that Saudi Arabia is organising an offensive against the Houthis to retake the Bab el-Mandeb. OPEC+ also delayed the capacity review behind its 2027 quotas to mid-November.
Why it matters:The week resolved the question of whether rerouting could substitute for a deal, and the answer was only partly: Saudi barrels moved around Hormuz through Yanbu, but by Friday the Red Sea exit they rely on was itself the target of a planned ground offensive, and strikes inside the strait accelerated. That is why the global benchmark rallied on a December-contract basis while US crude fell (see Energy table in Section B), and why Energy was one of only four sectors higher on the week (see sector rotation table). Vice Chair Jefferson’s statement that energy is driving the inflation pickup ties this thread directly to the rate story above.
What to watch:The OPEC+ online meeting on November quotas on Sunday, October 4; Iran’s formal response to the US reply; and confirmation of the Saudi offensive’s start, which Reuters’ sources said could come within a week.
BULLISH
4. Chip Equipment Takes the Leaderboard and the Nasdaq 100 Closes at a Record as OpenAI’s Revenue and Micron’s Guide Override Monday’s AI-Agent Scare
The core facts:The week opened with an AI selloff: Meta fell 4.79% on a weekend report, unconfirmed by OpenAI, that OpenAI would unveil an always-on “o” agent to rival Meta’s Muse, and Intel, Marvell, AMD, Dell and Micron all dropped more than 2.5%; Nvidia rose 1.68% after adding $150 billion to its buyback authorization. On Tuesday Axios reported OpenAI’s annualized revenue approaching $70 billion, Oracle rose 3.91%, Applied Materials, KLA and Lam Research gained between 2.99% and 5.19%, and Meta recovered 3.24% — though Apple fell 2.66% after Bank of America flagged Muse as a threat to iPhone commerce. On Wednesday Bank of America named Intel and Lam among its top chip picks, and after the close Micron reported a record quarter and a $61.5 billion guide (see Section E). Thursday’s chip-equipment rally followed, and on Friday the Nasdaq 100 closed at a record 30,807.93, even as a Toshiba hard-drive expansion plan knocked Sandisk 3.79% and Micron 2.05%. Applied Materials, Lam Research and KLA finished as the week’s top three $200 billion-plus gainers, each up more than 10%.
Why it matters:The market drew a clean line between two kinds of AI risk. Monday’s scare was about the application layer — who wins the agent war between OpenAI, Meta and, by extension, Apple — and it faded within a day. The evidence that arrived from Tuesday on was about the compute layer, and all of it pointed to more capacity: labs earning enough to pay for compute, a memory maker guiding another 13% sequential step, and a broker raising its data-center systems estimate. Capacity additions mean equipment orders, which is why the leaderboard was chip-equipment makers rather than the chip designers (see weekly movers table in Section B) and why Technology led the sector table. The advance stayed narrow, though: the Nasdaq 100 rose 0.65% while the S&P 500 fell.
What to watch:Whether the record holds into Wednesday’s FOMC minutes given chip leadership’s sensitivity to long yields, and whether storage-capacity announcements follow Toshiba’s.
UNCERTAIN
5. Diesel Becomes the Pinch Point: China Halts Fuel Exports, the G7 Answers With a 100-Million-Barrel Release and Washington Drops Its Export-Ban Threat
The core facts:On Tuesday the Energy Department offered up to 40 million barrels of Strategic Petroleum Reserve crude in its sixth exchange, with bids due October 6, and Wednesday’s EIA data showed a crude build alongside draws of 1.683 million barrels of gasoline and 2.251 million of distillates. On Thursday Reuters reported that PetroChina and Zhejiang Petrochemical had suspended October exports of diesel, gasoline and jet fuel to all destinations other than Hong Kong and Macau; China had exported 1.4 million tonnes of diesel and more than 2 million tonnes of jet fuel in September, and Brent jumped 4.27%. On Friday G7 leaders agreed “a coordinated release through the IEA of 100 million barrels” of diesel and crude over four months, with a substantial amount of diesel within 20 days, and pledged not to restrict energy exports among themselves; President Trump said the US would not impose a diesel export ban. US diesel futures fell 3.25% to $4.49 a gallon and European diesel 5.75%; WTI settled 1.9% lower at $91.11 while Brent slipped just 6 cents.
Why it matters:Refined products, not crude, became the binding constraint this week, and that is the part of the energy shock that reaches US freight, farming and goods prices first — the same input-cost pressure visible in ISM’s prices index (see Section D). The policy response worked on diesel and barely on crude: Brent ended near its Thursday level and the premium over WTI stayed above $11 (see Energy table in Section B). Energy Aspects called the G7 pledge “a political statement rather than a specific and binding commitment,” and it is unclear how much of the 100 million barrels is new rather than drawn from the March pact, while Reuters reported the White House is preparing an executive order on record-high diesel prices.
What to watch:Whether Beijing resumes product exports when the National Day holiday ends on Wednesday, October 7; the EIA distillate data the same morning; SPR exchange bids on October 6; and any White House executive order on diesel.
BEARISH
6. Rate Pressure Reaches Banks and Credit: Junk CDS Hit Their Widest Since April, Bank of America Targets Are Cut and Financials Finish the Week Last
The core facts:Financials fell in four of five sessions, including 1.08% on Monday and 1.14% on Wednesday, when Morgan Stanley dropped 2.43%, Goldman Sachs 1.73% and Mastercard 2.15%. On Thursday an index of high-yield credit default swaps reached its highest level since early April as the global bond selloff spilled into credit (Reuters); Evercore ISI and Truist cut their Bank of America price targets to $62 ahead of third-quarter results; and the KBW Nasdaq Bank Index fell as much as 2.4% intraday, leaving it more than 13% below its mid-August peak (Yahoo Finance). The same day Kansas City Fed President Schmid said rising long-term rates are creating friction for multifamily and commercial lending. Regulatory news ran the other way — the Fed and FDIC found no deficiencies in the resolution plans of 15 large banks on Tuesday, and on Wednesday the Fed finalized a stress-test overhaul that cuts year-to-year capital-requirement volatility by about half, over Governor Barr’s dissent.
Why it matters:This is the long-bond rout’s second-round effect. Banks feel higher long yields through securities marks, deposit costs and slower mortgage and commercial-real-estate lending, and wider junk CDS show the same pressure entering corporate credit — the channel through which a bond selloff becomes tighter financial conditions for the whole economy. Two pieces of regulatory relief in the same week did not change the direction: Financials were the worst sector (see sector rotation table in Section B), and Bank of America and Citigroup were among the five largest weekly decliners (see weekly movers table). Target cuts from analysts who kept their bullish ratings lower the earnings bar rather than question solvency, which makes the coming results the test.
What to watch:High-yield CDS against their April wides, and the start of large-bank third-quarter reporting, with Bank of America scheduled for Wednesday, October 14.
UNCERTAIN
7. The AI Build-Out Goes to the Capital Markets: Anthropic Eyes a Record IPO at Up to $2 Trillion as Broadcom, Amazon and Oracle Deals Show Who Is Financing the Compute
The core facts:Bloomberg reported Thursday that Anthropic could begin marketing its IPO as soon as the week of November 9 at a targeted valuation of up to $2 trillion, which would be the largest on record, with an investor meeting on October 14. Reuters reported from the prospectus that Broadcom has agreed to lend Anthropic up to $42 billion for its build-out, and on Friday Bloomberg reported Broadcom’s bank syndicate is starting to raise $60 billion of financing to benefit Anthropic and other AI companies. The Financial Times reported that Tencent will lease capacity on 100,000 AI chips from Oracle in a roughly $7 billion deal (unconfirmed by either company), and on Friday that Amazon is seeking to move about $8 billion of Nvidia Grace Blackwell chips into an investor-funded vehicle and lease them back. Snowflake opened the week with $3.5 billion of 0% convertible notes. The power side moved too: Amazon signed a 20-year, 690-megawatt nuclear deal with Constellation, and Oracle offered to absorb about $300 million of fuel costs to secure Point Beach nuclear output in Wisconsin.
Why it matters:Story #4 showed AI demand is real; this one shows who is now paying for it. Vendor loans, a sale-and-leaseback by the best-capitalised buyer in the market, offshore chip leasing and a record IPO all move the cost of compute onto balance sheets other than the labs’ own, and they do it in a week when long-term borrowing costs hit multi-decade highs. A $2 trillion listing would also put a public mark on the private AI valuations held by Amazon, Alphabet and Microsoft. Broadcom’s swing — down 2.15% on Thursday, the day the loan was disclosed, and up 3.35% on Friday, the day the syndicate report ran, with neither link established — suggests the market has not decided whether supplier financing is a moat or a risk.
What to watch:Anthropic’s investor meeting on Wednesday, October 14 and a public S-1 filing, and the pricing of Amazon’s chip vehicle as a gauge of debt investors’ appetite for AI hardware.
BEARISH
8. Drug-Pricing Pressure Turns Binding: CMS Finalizes the Mandatory GLOBE Model as Healthcare Slides 2.6% and Johnson & Johnson Falls 5.6% on the Week
The core facts:On Wednesday CMS finalized the GLOBE Model, a mandatory test of a rebate formula for separately payable Medicare Part B drugs benchmarked to prices in “economically comparable countries.” It runs from January 1, 2027 to March 31, 2032, covers about 25% of Original Medicare beneficiaries in randomly selected areas, excludes biosimilars, orphan-only drugs and certain cell and gene therapies, and carries no savings estimate. Healthcare fell 1.18% that day, with Merck down 2.66% and Eli Lilly 2.33% despite positive trial data from both, and another 1.44% on Thursday, when Amgen, Thermo Fisher and Johnson & Johnson each lost more than 2% and Florida sued Pfizer and its chief executive over COVID-19 vaccine safety claims. No source linked the declines to the rule. Positive news did not change the direction: the FDA approved AbbVie’s Parkinson’s drug JUVMO on Monday and granted Lilly’s Jaypirca first-line CLL approval on Friday, and McKesson and Cardinal Health extended their CVS contracts through 2032.
Why it matters:GLOBE turns international price benchmarking from a negotiating position into a payment rule aimed at the most concentrated revenue in large-cap pharma: infused and injected oncology and immunology. Its first scope is limited, but a model that works in test areas is the template for a wider rollout, and it lands on a sector that was already losing its defensive role as long yields rose. Healthcare finished second-worst on the week (see sector rotation table in Section B), and Johnson & Johnson was the second-largest weekly decliner among $200 billion-plus companies (see weekly movers table), even though neither a company release nor a direct link to the rule explains the move.
What to watch:Large-cap pharma’s third-quarter reports for the first company estimates of GLOBE’s revenue impact, and Lilly’s first full session after the Jaypirca approval on Monday, October 5.
— Separating signal from noise since 2007. Apply for membership at join.recessionalert.comD. WEEK IN THE ECONOMY -> TOP
The week’s tension was a policy-vs-data divergence. The data softened exactly where the hike case had been built: payrolls rose just 29,000 with 60,000 revised away, core PCE undershot at 0.2%, and confidence slid to 81.9. Yet the officials who spoke moved only the date: Logan put the remaining tightening at “50 basis points or more,” Goolsbee said inflation is “where the problem is,” and ISM’s prices index at 77.9 handed them fresh evidence. Markets split the difference precisely. October hike odds fell from roughly two-in-three to about one-in-four, but Polymarket still prices a 2026 hike at 100%, recession odds eased only 3 points to 8%, and the 2-year fell just 3.5 bps while the 10-year rose 10.9 — a reprieve on timing, not direction. Wednesday’s FOMC minutes will show how many participants share Logan’s count, and whether September’s hike was framed as the first of several.
POLYMARKET ODDS — WEEK-ON-WEEK SHIFT:
| Market | Last Friday | This Friday | Δ |
|---|---|---|---|
| US Recession by end-2026 | 11% | 8% | −3.0 pp |
| Fed rate hike in 2026 | 100% | 100% | 0.0 pp |
| Fed rate cuts ≥1 in 2026 | 4% | 4% | 0.0 pp |
UNCERTAIN
Payrolls Rise Just 29,000 vs. About 90,000 Expected; Unemployment Ticks Up to 4.2% and Revisions Cut 60,000 (BLS, Fri, Oct 2)
What they’re saying:Nonfarm payrolls rose 29,000 in September against a consensus near 90,000, with private employers adding 46,000 against 85,000 expected and government shedding 17,000. July was revised to a 10,000 loss and August to 133,000 from 162,000, a combined 60,000 downward revision. Unemployment rose to 4.2% from 4.1% as participation climbed to 61.8%, while average hourly earnings rose just 0.1% to $37.81, slowing annual wage growth to 3.0% against a 3.2% forecast.
The context:Read with the rest of the week, the labor market is slowing on the hiring side, not the firing side. August job openings fell to 7.08 million against 7.23 million expected (Tuesday), yet initial claims held at 197,000 (Thursday) and Challenger counted 43,281 announced cuts, down 18%; Wednesday’s 90,000 ADP beat proved a poor guide to Friday. After revisions, payroll gains have averaged about 51,000 a month over three months. Markets took the report as a reason to delay rather than abandon tightening: October hike odds fell to about 23%, the Nasdaq 100 closed at a record and Polymarket recession odds slipped to 8% (see Polymarket table above), but the 2-year closed 4.0 bps higher on the day.
What to watch:Initial jobless claims on Thursday, October 8 (prior 197,000), for whether layoffs stay low as hiring slows.
BULLISH
Core PCE Rises 0.2% in August vs. 0.3% Expected; Headline Inflation 3.4% Against a 3.7% Forecast (BEA, Wed, Sep 30)
What they’re saying:The core PCE price index rose 0.2% in August against a 0.3% consensus, putting the annual core rate at 3.0%. Headline prices rose 0.3% against 0.4% expected, leaving annual inflation at 3.4% versus a 3.7% forecast. Personal spending jumped 0.9% (0.8% expected) while income rose only 0.2% against 0.4% expected, and the saving rate stood at 4.1%. The same morning, the final estimate of second-quarter GDP was revised up to 2.2% from 1.5%.
The context:This was the print that moved the Fed’s timing. October hike odds fell to about 37% from 51% within hours, Goldman Sachs pushed its next-hike call to December, and the shift held through the rest of the week rather than fading. What it did not move was the long end: the 10-year rose 5.0 bps that day and 10.9 bps on the week (see Vol & Treasuries table in Section B), so the relief stayed in policy expectations and never reached borrowing costs. Headline inflation at 3.4% also remains well above target, and spending running far ahead of income is a draw on savings rather than a sign of stronger earnings.
What to watch:The FOMC minutes on Wednesday, October 7 at 2:00 PM ET, and the September CPI report ahead of the October 27–28 meeting.
BEARISH
ISM Manufacturing Edges Down to 54.5, but Its Prices Index Jumps 6.8 Points to 77.9 as Regional Surveys Show Factories Firming (ISM, Thu, Oct 1)
What they’re saying:The ISM manufacturing PMI slipped to 54.5 from 54.6, below the 55.0 consensus, but New Orders rose to 55.3, Backlog to 56.4 and Employment to 52.7, while the Prices Index jumped to 77.9 from 71.1. The regional reads ran hotter: the Dallas Fed’s production index surged to 29.5 from 16.1 on Monday with raw-materials prices up to 52.2, and the Chicago PMI leapt 11.7 points to 58.8 on Wednesday against 51.2 expected. Friday’s factory orders rose 0.1%, in line, as shipments stalled after eight monthly gains.
The context:Across the week the goods economy looked firm and expensive at the same time, which is the combination the Fed’s hawks are pointing to. ISM respondents cited tariffs in 34% of negative comments and the Iran war in 30%, and a Texas producer said diesel costs could not be passed through — the same input-cost channel behind this week’s diesel squeeze (see story #5 in Section C). Growth tracking stayed solid but cooled: the Atlanta Fed’s GDPNow fell to 3.7% from 5.0% after a wider $132.6 billion August goods deficit, with business investment rather than consumers carrying the estimate.
What to watch:ISM Services PMI on Monday, October 5 at 10:00 AM ET (expected 55.7, prior 55.4), for whether price pressure is spreading beyond factories.
BEARISH
Consumer Confidence Falls to 81.9 vs. 89.2 Expected as Fuel Costs Weigh (Conference Board, Tue, Sep 29)
What they’re saying:The Conference Board index fell 6.7 points to 81.9 in September from 88.6, against an 89.2 consensus; the Present Situation Index dropped to 109.3 and Expectations to 63.6. Chief Economist Dana Peterson said references to prices and to oil and gas costs “rose to new heights.” The labor differential narrowed to +1.7 points, and average 12-month inflation expectations stood at 6.1%.
The context:Sentiment and spending pointed in opposite directions this week: households reported a cost-of-living squeeze on Tuesday, yet Wednesday’s data showed August spending up 0.9% on income growth of only 0.2%, a pace sustained by drawing down savings. The equity market sided with the survey. Consumer Defensive and Consumer Cyclical both fell on the week (see sector rotation table in Section B), and JPMorgan’s downgrade of PepsiCo, the third bank action on the stock in two days, pointed to pricing that is no longer holding volumes.
What to watch:The University of Michigan’s preliminary October sentiment on Friday, October 9 (prior 48.1).
BEARISH
30-Year Mortgage Rate Hits 7.30%, Highest Since November 2023, as the Long-End Selloff Reaches Housing (MBA, Wed, Sep 30; Freddie Mac, Thu, Oct 1)
What they’re saying:The MBA’s 30-year contract rate rose to 7.30% from 7.12%, its highest since November 2023, as total applications fell 6%, refinancing 9% and purchases 4%. Freddie Mac’s weekly survey followed on Thursday at 7.28%, up from 7.03% a week earlier and 6.34% a year ago. Realtor.com’s September report showed pending sales down 4.1% from a year earlier, 20.8% of listings carrying a price cut, and inventory within 9.1% of pre-pandemic levels.
The context:Mortgage rates are tracking the long end of the Treasury curve, not the Fed path, so the week’s fall in hike odds gave housing nothing. Kansas City Fed President Schmid said on Thursday that higher long-term rates are starting to affect home prices, a direct acknowledgement from a policymaker that the bond market is tightening on the Fed’s behalf. August construction spending rose 0.9%, but that predates the jump in rates. Real Estate fell 2.10% on the week (see sector rotation table in Section B).
What to watch:The MBA 30-year mortgage rate on Wednesday, October 7 (prior 7.3%), and whether the 10-year yield pushes beyond 5.3%.
— Know the probability before the market prices in the risk. Apply for membership at join.recessionalert.comE. WEEK IN EARNINGS -> TOP
TOP EARNINGS OF THE WEEK
BULLISH
1. Micron Technology (MU): +3.03% on the Reaction Day | A Record $54.2 Billion Quarter at an 87% Margin, and a $61.5 Billion Guide
The Numbers:Reported after the close on Wednesday, September 30. Fiscal fourth-quarter revenue $54.23B vs. $51.33B expected (+5.6%), up from $11.32B a year earlier and $41.46B the prior quarter; non-GAAP EPS $33.42 vs. $31.77 expected (+5.2%). Non-GAAP gross margin 87.0%. Operating cash flow $43.97B against net capex of $10.77B. Fiscal 2026 revenue $133.19B vs. $37.38B in fiscal 2025. Fiscal Q1 2027 guidance: revenue $61.5B ± $1.5B, non-GAAP gross margin about 86.25%, non-GAAP EPS $38.15 ± $1.00.
The Problem/Win:The mix is the story. Core Data Center ($18.00B) and Cloud Memory ($16.28B) made up about 63% of revenue, against $13.11B from Mobile and Client and $6.82B from Automotive and Embedded, and revenue cleared the top of Micron’s own $50B ± $1B range by more than $3B. The guide steps revenue up roughly 13% again while the margin guide edges down to about 86.25% from 87.0% — the first hint of a ceiling on pricing power, though from a level far above any prior cycle.
The Ripple:The read-through went to suppliers rather than to Micron itself: the shares rose 3.03% on Thursday but gave back 2.05% on Friday when Toshiba’s hard-drive expansion hit storage names, leaving the strongest gains with the equipment makers that would build the next round of capacity (see story #4 in Section C).
What It Means:A company generating about $44 billion of operating cash in a quarter while spending under $11 billion on capex has room to add capacity and still return cash, so the debate shifts from demand to how quickly margins this far above history normalise. A 3% reaction to a beat this size says much of the good news was already priced.
What to watch:Gross margin against the 86.25% guide at the next report, and whether memory-equipment orders follow the capacity read-through.
BULLISH
2. Accenture (ACN): +15.78% on the Reaction Day | Revenue Above the Top of Its Guided Range and a Higher Fiscal 2027 Margin Guide
The Numbers:Reported before the open on Thursday, October 1. Fiscal fourth-quarter revenue $18.68B vs. $18.03B expected (+3.6%), up 6% in US dollars and 7% in local currency; EPS $3.30 vs. $3.18 expected (+3.7%). New bookings $22.2B; GAAP operating margin 15.3%. Fiscal 2026 revenue $74.2B on bookings of $84.5B. Fiscal 2027 outlook: local-currency revenue growth of 3%–6%, GAAP EPS $14.39–$14.81, operating margin 15.9%–16.1%, free cash flow $11.0B–$11.8B and at least $9.5B returned to shareholders. Quarterly dividend raised 5% to $1.71.
The Problem/Win:Revenue beat the top of the company’s own range with growth across every geography, industry group and type of work, and the fiscal 2027 margin guide rises to 15.9%–16.1% from 15.4% — a services business guiding to wider margins in a year of higher funding costs for its clients.
The Ripple:No peer reaction was established as a response to the print; Technology rose 0.99% that day. The relevance is as the first large read on enterprise IT-services budgets for the quarter, in a week otherwise dominated by AI hardware.
What It Means:The size of the move against a 3.6% beat says the market had been positioned for disappointment rather than that the quarter was exceptional. That makes the fiscal 2027 guide, not this print, the number the shares will now be held to.
What to watch:Fiscal Q1 2027 revenue against the $18.95B–$19.60B guide, and new-bookings growth as the leading indicator for the year.
WEEK AHEAD PREVIEW:
Q3 2026 earnings season has barely begun, with FactSet now expecting S&P 500 earnings growth of 29.5%; one mega-cap reports in the next five sessions.
PepsiCo (PEP) — BMO, Thursday, October 8 — Consensus EPS $2.30 on revenue of $24.97B. Key focus: North America Foods volume and whether net revenue stabilises as price investments annualise; PepsiCo Beverages North America volume and margin; and, with diesel at record highs, how much freight and input-cost inflation is reaching packaged-goods margins. Consensus EPS estimates have been cut about 5% over the past 90 days against an easy comparison with a soft Q3 2025.
Large-bank Q3 results begin mid-October, with Bank of America on Wednesday, October 14.
— US market commentary trusted by family offices and institutions. Apply for membership at join.recessionalert.comF. NEXT WEEK SETUP -> TOP
UPCOMING RELEASES:
| Date | Event | Why It Matters |
|---|---|---|
| Mon Oct 5 | ISM Services PMI (10:00 AM ET; Sep; expected 55.7, prior 55.4) | Manufacturing’s prices index jumped to 77.9 this week; the services prices component shows whether that cost pressure is reaching the larger part of the economy, which is what the Fed’s hawks need to keep a December hike on track. |
| Tue Oct 6 | ADP Employment Change Weekly (8:15 AM ET; prior 20K) | The first private hiring read after a 29,000 payrolls print and a 60,000 downward revision; a second soft reading would firm the “hiring stalls, firing doesn’t” picture. |
| Tue Oct 6 | Balance of Trade (8:30 AM ET; Aug; prior -$88.6B) | The advance goods gap already widened to $132.6 billion and cut GDPNow from 5.0% to 3.7%; the full report sets how large the net-exports drag on third-quarter growth really is. |
| Tue Oct 6 | Exports (8:30 AM ET; Aug; prior $310.7B) | Sets the August baseline for energy and farm exports before China’s October fuel-export halt, which could pull more demand toward US refined products, and before the US-China tariff lists published this week take effect. |
| Tue Oct 6 | Imports (8:30 AM ET; Aug; prior $399.3B) | August spending rose 0.9%; strong imports would confirm that part of that demand leaked abroad rather than lifting domestic output. |
| Tue Oct 6 | API Crude Oil Stock Change (4:30 PM ET; week of Oct 3; prior 1.019M) | An early read on the first week of the G7 release and on whether US crude keeps building while product inventories draw. |
| Tue Oct 6 | Fed Logan Speech (7:00 PM ET) | Logan put the remaining tightening at “50 basis points or more” on a 4.1% unemployment rate that has since risen to 4.2%; whether she trims that count is the cleanest read on how far the payrolls miss moved the hawks. |
| Wed Oct 7 | MBA 30-Year Mortgage Rate (7:00 AM ET; week of Oct 3; prior 7.3%) | The transmission check on the long-bond rout: another rise above 7.3% would show housing taking the tightening the Fed did not deliver. |
| Wed Oct 7 | EIA Crude Oil Stocks Change (10:30 AM ET; week of Oct 3; prior 0.922M) | Lands the same day China’s National Day holiday ends and Beijing decides whether fuel exports resume; a crude build alongside product draws would confirm the squeeze is in refining, not supply. |
| Wed Oct 7 | EIA Gasoline Stocks Change (10:30 AM ET; week of Oct 3; prior -1.684M) | Another product draw would keep fuel costs in the confidence and inflation data, the channel households flagged in this week’s 81.9 confidence reading. |
| Wed Oct 7 | FOMC Minutes (2:00 PM ET) | The week’s decisive event: how many participants saw September’s hike as the first of several, and whether the committee treats higher long yields as tightening it no longer needs to deliver itself. |
| Thu Oct 8 | Initial Jobless Claims (8:30 AM ET; week of Oct 3; prior 197K) | Claims below 200,000 two weeks running are the main evidence that slow hiring has not turned into layoffs; a jump would change the labor read faster than any survey. |
| Fri Oct 9 | Michigan Consumer Sentiment Prel (10:00 AM ET; Oct; prior 48.1) | A second consumer survey after the Conference Board’s slide to 81.9; inflation expectations matter as much as the headline, with diesel at record highs and mortgage rates above 7%. |
WHAT TO WATCH NEXT WEEK:
1. Will Wednesday’s FOMC minutes confirm a committee that sees several more hikes, or one that treats the bond market as having done the work? Logan’s “50 basis points or more” and Goldman’s December call bracket the range; the minutes show where the median sits.
2. Can the 10-year hold below 5.3% without help from the Fed? The rout was global and steepening-driven, so the French budget, gilt yields and Monday’s ISM Services prices may matter more than any US policy signal.
3. Does China resume fuel exports when its holiday ends on Wednesday, October 7? Together with Sunday’s OPEC+ meeting and any White House order on diesel prices, it decides whether the refined-products squeeze eases or deepens into the inflation data.
4. Can a Nasdaq 100 record built on chip equipment survive another week of rising long yields and weak breadth? The S&P 500, Dow and NYSE Composite all fell this week; a second week of that divergence would make the leadership look thinner, not stronger.
5. Does credit stress spread before bank earnings begin? Junk CDS at their widest since April and target cuts on Bank of America set up the October 14 results; PepsiCo’s October 8 report tests the consumer side of the same squeeze.
— US market commentary trusted by family offices and institutions. Apply for membership at join.recessionalert.comG. CHART OF THE WEEK -> TOP
WHY THIS CHARTTuesday’s chart won because it answers the week’s central puzzle before the week had finished posing it: why a cooler PCE and a 29,000 payrolls print could drag October hike odds down while long yields kept climbing. By splitting the 30-year’s rise into its inflation and real-return parts, it explains the long-bond rout behind stories #1, #2 and #6 at the root, where Monday’s junk-spread chart and Friday’s payrolls gauge each captured only one downstream branch of it, and Wednesday’s and Thursday’s charts addressed savings and tariff refunds.
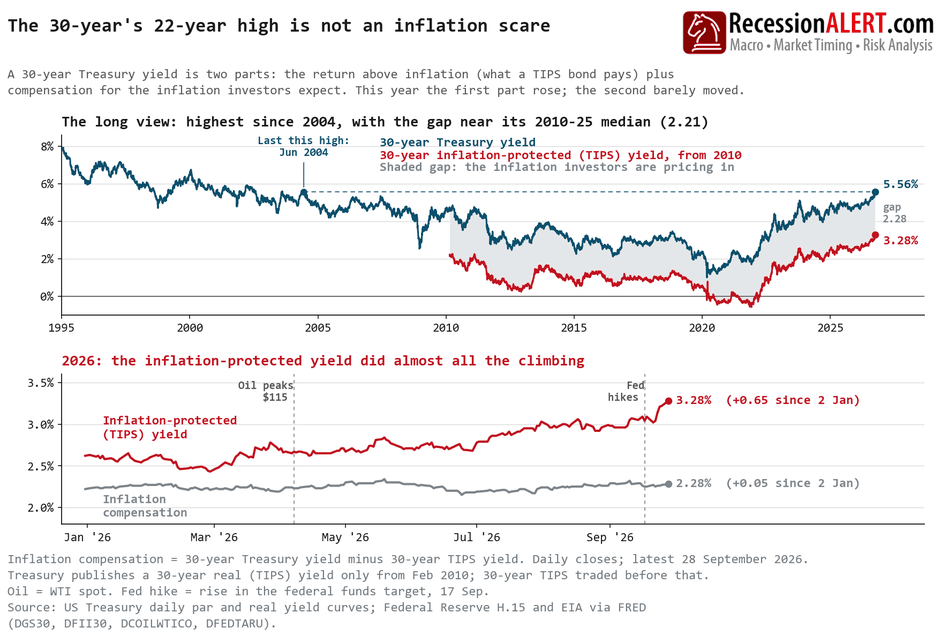
ORIGINAL CHART ANALYSIS — FROM TUESDAY’S MIBOil ran from $57 to $115 and inflation tops 3%, yet the 30-year Treasury bond barely charges more for it. Its yield is up 0.70 point since January, to 5.56%, and that rise splits in two. The return after inflation — what inflation-protected bonds (TIPS) pay — rose 0.65. The part of the yield that charges for inflation rose just 0.05. In the 2023 and 2024-25 selloffs, that part supplied over a quarter of the climb. The market is pricing the Fed’s cure, not the disease. Two-year yields are already priced for the Fed to raise rates further, even after this month’s hike. And the flat inflation charge on 30-year bonds suggests investors expect the cure to work. Oil tested that confidence only at shorter range: the inflation priced in for the next five years jumped, then fell back, while the 30-year charge held steady. That leaves the rise in the return after inflation — the expensive kind. Inflation will not wear it down: borrowers pay it in full, and a 30-year mortgage already costs 7.03%. The day the 30-year starts charging more for inflation, the market will have stopped trusting the cure. Until then, oil prices the next five years — the Fed prices the next thirty.
What it means: homebuyers and refinancers shouldn’t count on cooler inflation to cut mortgage rates. Since spring, inflation eased from 4.2% to 3.35%; mortgage rates rose from 6.3% to 7.03%. Stocks face a higher bar: a risk-free 10-year inflation-protected Treasury pays 2.90% above inflation, the most since 2008. Shares, up 12% this year, must earn more to justify the risk. For an economy that grew at a 1.5% pace in the second quarter, rates this high are a headwind, starting with housing. If the 30-year’s inflation charge tops 2.40%, investors are doubting the Fed — a second push on long rates.
MIB Weekly Digest Ver. 2.05
For professional investors only. Not investment advice.
© 2026 RecessionALERT.com

Comments are closed.