
MARKET INTELLIGENCE BRIEF (MIB)
Thursday, May 21, 2026
IBM surged +12% on a $1B CHIPS Act quantum foundry award, fueling a broad AI-semiconductor rally. Walmart cratered -7.27%, citing tariffs and fuel in a guidance miss that flags real consumer stress. The Philadelphia Fed collapsed 27 points to -0.4 as new orders turned negative, while Flash PMI input prices hit a post-2022 high. Richmond Fed’s Barkin questioned whether five-plus years above target still justifies the ‘look through’ doctrine. NVDA fell -1.77% despite 85% revenue growth — its fourth post-earnings decline.
TABLE OF CONTENTS
A. EXECUTIVE SUMMARY
B. MARKET DATA
C. HIGH-IMPACT STORIES (5)
D. MODERATE-IMPACT STORIES (5)
E. ECONOMY WATCH (5)
F. EARNINGS WATCH (4)
G. WHAT’S NEXT
H. CHART OF THE DAY
A. EXECUTIVE SUMMARY -> TOP
MARKET SNAPSHOT
Thursday’s tape was dominated by a single industrial-policy catalyst: IBM’s +12.43% surge on a $2 billion CHIPS Act quantum computing investment — the first federal funding round explicitly targeting quantum chip manufacturing — lifted the AI-semiconductor complex broadly and flatly distorted the price-weighted Dow (+0.55%), masking an otherwise tepid S&P advance (+0.17%). The macro counterweight was Walmart’s -7.27% guidance shock: the world’s largest retailer formally attributed below-consensus Q2 and full-year EPS guidance to tariff-driven cost uncertainty and elevated fuel prices, converting what had been survey-data consumer concern into a hard earnings-guidance event. At the policy level, the 2-year yield crept +4.5 bps while the 10-year held flat — curve flattening that quietly reduces near-term Fed cut expectations and sits uneasily alongside today’s PMI input price surge and Barkin’s public questioning of the “look through” doctrine. Nine of 11 sectors closed green, but Consumer Defensive’s -1.77% loss underscored that breadth alone cannot paper over the emerging demand stress signal.
TODAY AT A GLANCE
• IBM +12.43% on CHIPS Act quantum foundry award — The DoC announced $1B in incentives for “Anderon,” America’s first purpose-built quantum wafer fab (Albany, NY); IBM commits an additional $1B; D-Wave (QBTS) and Rigetti (RGTI) each receive up to $100M separately. AI-semiconductor complex rallied broadly: SNDK +10.75%, QCOM +5.38%, MU +4.11%, LRCX +3.47%.
• WMT -7.27% — tariffs and fuel convert consumer caution to hard guidance — CEO explicitly cited tariff uncertainty and elevated fuel costs in below-consensus Q2/FY EPS guidance. The world’s largest retailer serving ~90% of US households erased ~$70B in market cap; COST fell -2.19% in sympathy. This is consumer stress in an income statement, not a survey.
• Philly Fed collapses 27 pts to -0.4 vs national Flash PMI at 4-year high — New orders plunged 35 pts to -1.7 (lowest since April 2025) in one of the survey’s largest single-month drops. Directly contradicts the S&P Global Flash Manufacturing PMI’s 55.3 reading. The national vs. regional divergence leaves the Fed interpreting two irreconcilable signals simultaneously.
• Flash PMI input prices hit 64.0 — fastest since the 2022 energy shock — Richmond Fed’s Barkin publicly questioned whether 5+ years above target ends the Fed’s “look through” doctrine. Market pricing for at least one hike by December 2026 now exceeds 50%. The hawkish data cluster (PMI prices + April FOMC minutes + Barkin) is building an internal Fed case for firming language at the June 16–17 meeting.
• NVDA -1.77% on record earnings beat — 4th consecutive post-earnings decline — Revenue +85% YoY to $81.6B, EPS $1.87 vs $1.75 est.; Q2 guidance ~$89–93B above consensus but missed the upper range. The AI pure-play trade is under rising expectations compression — the market now demands beat-and-exceed-the-highest-estimate to reward the stock.
• Estée Lauder +12% AH — $40B Puig merger terminated — M&A complexity discount removed; standalone “Beauty Reimagined” strategy restored. RBC analyst cited analyst “relief” at removal of integration risk. EL returns to a pure-play turnaround narrative at an early-traction inflection point.
KEY THEMES
1. The Stagflation Trap Tightens — Three data points today form a coherent stagflation-adjacent case: Flash PMI input prices at 64.0 (fastest since the 2022 energy shock), Walmart formally attributing a guidance miss to tariff and fuel pass-through, and the Philadelphia Fed showing new orders turning negative. The Fed faces a policy vice from both ends simultaneously: PMI prices and Barkin’s “look through” challenge argue for tightening; WMT’s consumer stress and the Philly collapse argue against it. The 2-year yield flattening confirms markets are repricing this tension in real time.
2. The AI Trade Is Bifurcating — IBM’s quantum foundry CHIPS Act catalyst and NVDA’s fourth consecutive post-earnings decline tell the same story from opposite directions: federal industrial policy is creating new winners at the foundry and quantum layer while the market increasingly demands monetization proof from extended pure-plays. The AI capex super-cycle is maturing from a rising-tide trade into a selective fundamentals story — investors want to know when the spending generates revenue, not just that it’s accelerating.
3. Consumer Stress Graduates From Survey Data to Guidance — Walmart’s guidance miss is analytically significant not just for its size but for its form: the CEO explicitly attributed tariff and fuel cost headwinds in formal EPS guidance at a ~$1T market-cap company. This converts consumer weakness from soft survey data — UMich Consumer Sentiment expected at a near-historic low of 48.2 on Friday — into hard corporate earnings expectations with real model implications for Q2 PCE, forward retail sector earnings, and the Fed’s demand-side inflation framework.
 — Leading economic indicators. Accurate market forecasts. Apply for membership at join.recessionalert.com
B. MARKET DATA -> TOP
IBM’s $1B quantum chip foundry announcement under the CHIPS Act drove a +12.43% surge and fueled a broad AI-semiconductor rally (SNDK +10.75%, QCOM +5.38%, MU +4.11%), while NVIDIA fell -1.77% despite a historic 85%-revenue-growth beat as guidance missed the upper range — the AI trade is bifurcating between emerging converters and extended pure-plays. Small-caps (+0.87%) led all indices; the Dow’s +0.55% also reflects IBM’s heavy index weighting, masking the S&P’s modest +0.17%. Walmart’s -7.27% collapse — Q1 beat but Q2/FY guidance missed on consumer fuel-cost pressure — dragged Consumer Defensive -1.77%, the session’s clearest macro warning beneath an otherwise broad tape. The 2Y crept +4.5 bps while the 10Y was flat — curve flattening that quietly signals reduced Fed cut expectations.
CLOSING PRICES – Thursday, May 21, 2026:
MAJOR INDICES
Russell 2000’s +0.87% lead over the S&P’s +0.17% and Nasdaq’s +0.20% signals domestic small-cap risk appetite over mega-cap tech — though IBM’s 12% surge disproportionately flatters the price-weighted Dow at +0.55%. DJ Transportation’s near-flat close (-0.07%) against the Dow’s gain sits just inside the 1.5% divergence threshold, deferring formal Dow Theory scrutiny — but Dow Theory bull confirmation extends into its 4th consecutive session today, with both DJIA and DJTA remaining within 2% of their 10-session highs. No large-cap vs. small-cap or growth-vs-broad signal crossed threshold over the 10-session window.
| Index | Close | Change | %Move | Why It Moved |
|---|---|---|---|---|
| S&P 500 | 7,445.70 | +12.73 | +0.17% | IBM quantum-foundry surge and AI semi rally lifted tech; WMT’s -7.27% guidance miss partly offset gains; net modest advance |
| Dow Jones | 50,285.66 | +276.31 | +0.55% | IBM is a Dow component; its +12.43% single-stock gain disproportionately boosted the price-weighted index vs. the cap-weighted S&P’s +0.17% |
| DJ Transportation | 20,604.2 | -15.5 | -0.07% | Near-flat; no dominant catalyst; oil held below $99, limiting both cost-relief and reflationary transport upside |
| Nasdaq 100 | 29,357.27 | +59.57 | +0.20% | Mixed AI trade: IBM-adjacent semis (QCOM, MU, LRCX) rallied while NVDA slipped -1.77% despite a record earnings beat on guidance caution; net small gain |
| Russell 2000 | 2,841.74 | +24.38 | +0.87% | Led all major indices; domestic small-caps outperformed on Iran/US deal optimism and broad risk-on appetite; outpaced mega-caps by ~70 bps |
| NYSE Composite | 23,127.69 | +105.95 | +0.46% | Broad advance confirmed by 9-of-11 sectors green; composite gain reflects wide participation across market-cap spectrum |
VOLATILITY & TREASURIES
VIX’s -3.90% drop to 16.76 with a near-flat 10Y (+0.2 bps) signals moderate risk-on, but conviction is thin. The key divergence: the 2Y rose +4.5 bps while the 10Y held essentially flat — curve flattening driven by short-end repricing of Fed cut expectations. Bonds are declining to confirm the equity rally; the 2Y’s relative move implies the rate path is subtly less accommodative than equity sentiment suggests, a quiet warning for duration positioning.
| Instrument | Level | Change | Why It Moved |
|---|---|---|---|
| VIX | 16.76 | -0.68 (-3.90%) | Implied volatility compressed as Iran/US deal optimism and AI-tech earnings lifted sentiment; equities calm despite mixed signals |
| 10-Year Treasury Yield | 4.577% | +0.2 bps | Near-flat; long bond non-committal on direction — bonds not confirming the equity rally; Fed path uncertainty keeping the long end range-bound |
| 2-Year Treasury Yield | 4.083% | +4.5 bps | Short-end repriced as traders reduced near-term Fed cut expectations; core services inflation stickiness keeping front-end yields elevated |
| US Dollar Index (DXY) | 99.26 | +0.08 (+0.08%) | Marginal dollar strength; 2Y yield pickup supported the dollar slightly; risk-on flows competed with mild haven demand from lingering geopolitical uncertainty |
COMMODITIES
Gold’s -0.33% and silver’s -0.62% reflect a mild safe-haven release as Iran/US optimism improved sentiment — the moves are small and neither signals a reversal. Copper’s +0.50% is the more informative read: industrial demand holding up confirms the session’s underlying tone is growth-oriented. Bitcoin’s -0.13% near-flat close tracks equities tightly — no independent crypto narrative today, no regulatory catalyst, no on-chain divergence.
| Asset | Price | Change | %Move | Why It Moved |
|---|---|---|---|---|
| Gold | $4,542.97/oz | -$15.03 | -0.33% | Mild safe-haven release on Iran/US deal optimism; risk appetite improved; small pullback within recent elevated range |
| Silver | $76.965/oz | -$0.479 | -0.62% | Tracked gold lower with slight additional industrial-demand softness; no specific catalyst |
| Copper | $6.3468/lb | +$0.0313 | +0.50% | AI infrastructure buildout and growth-positive sentiment supported industrial metals; copper confirming the session’s pro-growth tone |
| Platinum | $1,978.80/oz | +$1.40 | +0.07% | Near-flat; auto-catalysis demand steady; no significant catalyst |
| Bitcoin | $77,657 | -$99 | -0.13% | Essentially flat; tracking equity risk sentiment closely; no independent crypto catalyst or regulatory development |
ENERGY
WTI and Brent each fell less than 0.25% while equities rose — energy sitting out the rally signals the session was tech-specific, not a broad macro risk-on. The WTI/Brent spread ($6.82) held steady, ruling out regional supply disruption. Both gas benchmarks softened modestly — Henry Hub -0.83%, TTF -0.09%. Crude moving inversely to equities (even marginally) means today’s bull thesis was company-specific and sector-rotation driven, not commodity-confirming growth optimism.
| Asset | Price | Change | %Move | Why It Moved |
|---|---|---|---|---|
| Crude Oil (WTI) | $98.03/bbl | -$0.23 | -0.23% | Mild softening on Iran/US nuclear deal optimism — potential supply return narrative weighed marginally; equities rallied without crude confirmation |
| Crude Oil (Brent) | $104.85/bbl | -$0.17 | -0.16% | Near-flat; WTI/Brent spread ($6.82) stable — no regional supply disruption; Iran deal optimism weighed on both benchmarks equally |
| Natural Gas (Henry Hub) | $2.999/MMBtu | -$0.025 | -0.83% | Mild shoulder-season demand easing; storage levels comfortable; no significant supply catalyst |
| Natural Gas (Dutch TTF) | $16.82/MMBtu | -$0.02 | -0.09% | Near-flat; European storage healthy; no weather or supply shock; mild EUR/USD drag on converted price |
S&P 500 SECTORS
Nine of 11 sectors closed green — a breadth sweep confirming broad participation, not a tech-only story. Holdouts: Energy (-0.59%, oil slipping) and Consumer Defensive (-1.77%, Walmart’s guidance shock). The standout divergence: Basic Materials led today (+0.76%) despite being the worst performer over 1 week (-4.49%) and 1 month (-3.65%) — a sharp reversal of a deep multi-period downtrend, likely technical. Utilities topping the session (+0.96%) while carrying 3-month losses (-2.91%) adds a mild defensive tilt beneath an otherwise risk-on surface read.
| Sector | 1-Day | 1-Week | 1-Month | 3-Month | 6-Month | YTD | 12-Month |
|---|---|---|---|---|---|---|---|
| Utilities | +0.96% | -0.18% | -1.10% | -2.91% | +2.72% | +6.35% | +13.30% |
| Basic Materials | +0.76% | -4.49% | -3.65% | -6.02% | +25.55% | +13.85% | +43.56% |
| Technology | +0.66% | -0.67% | +9.30% | +20.74% | +21.67% | +18.94% | +45.26% |
| Consumer Cyclical | +0.65% | -0.58% | +0.11% | +1.16% | +4.03% | -1.08% | +8.57% |
| Healthcare | +0.63% | +0.79% | +0.48% | -4.91% | -1.05% | -3.00% | +12.48% |
| Financial | +0.31% | +1.02% | +0.34% | -1.13% | +4.54% | -2.20% | +8.60% |
| Communication Services | +0.14% | -1.82% | +4.05% | +8.77% | +13.46% | +7.04% | +37.72% |
| Real Estate | +0.09% | +1.11% | +1.91% | +1.43% | +7.70% | +8.65% | +6.69% |
| Industrials | +0.05% | -2.21% | -0.30% | -2.45% | +17.84% | +12.54% | +24.00% |
| Energy | -0.59% | +1.16% | +3.19% | +10.30% | +30.71% | +32.81% | +44.34% |
| Consumer Defensive | -1.77% | -1.47% | +1.93% | -3.04% | +11.33% | +9.23% | +5.31% |
TOP MEGA-CAP MOVERS:
GAINERS
| Company | Ticker | Close | Change | Why It Moved |
|---|---|---|---|---|
| International Business Machines | IBM | $252.97 | +12.43% | DoC announced $1B CHIPS Act incentives for IBM’s “Anderon” quantum chip foundry — America’s first purpose-built quantum chip manufacturing facility; IBM committed an additional $1B in cash, IP, and assets |
| SanDisk Corp | SNDK | $1,542.24 | +10.75% | Q3 2026 earnings beat; hyperscalers signed multiyear NAND supply agreements exceeding $42B; AI/data center demand surge reducing traditional NAND cyclicality concerns |
| Qualcomm | QCOM | $213.41 | +5.38% | AI semiconductor complex rallied on IBM quantum-foundry catalyst; QCOM benefits from AI edge-compute demand; broad semi momentum lifted the sector |
| Micron Technology | MU | $762.10 | +4.11% | Rides AI memory demand; SNDK’s strong NAND results lifted HBM/DRAM sentiment; memory suppliers outperformed as hyperscaler supply agreements validated the AI storage thesis |
| Lam Research | LRCX | $302.24 | +3.47% | Semiconductor equipment lifted by AI capex spending narrative; IBM foundry + SNDK pipeline benefits equipment makers; broad semi equipment rally |
DECLINERS
| Company | Ticker | Close | Change | Why It Moved |
|---|---|---|---|---|
| Walmart | WMT | $121.34 | -7.27% | Q1 revenue beat ($175.7B) but Q2 guidance ($185.4B midpoint) missed consensus ($186.4B); full-year EPS guidance also missed; management cited rising consumer pressure from higher fuel prices |
| Costco Wholesale | COST | $1,050.45 | -2.19% | Sympathy selloff with Walmart; peer discount retailer sold off on consumer spending concerns raised by WMT’s below-consensus Q2/FY guidance |
| Texas Instruments | TXN | $298.39 | -2.13% | Analog/industrial semis underperformed as capital rotated into AI-focused names; TXN’s automotive and industrial exposure less relevant to today’s AI-NAND and quantum theme |
| NVIDIA Corp | NVDA | $219.51 | -1.77% | Sell-the-news on record earnings beat ($1.87 adj. EPS, revenue +85% YoY to $81.6B); next-quarter guidance missed the upper range of analyst estimates; stock had priced in perfection |
| Broadcom | AVGO | $414.57 | -0.76% | Mild pullback; NVDA earnings disappointment created modest headwind for the broader AI chip complex; profit-taking after recent strong run |
— Institutional-grade intelligence for serious investors. Apply for membership at join.recessionalert.comC. HIGH-IMPACT STORIES -> TOP
BULLISH
1. IBM and Commerce Dept. Announce America’s First Quantum Chip Foundry “Anderon” — $2B in CHIPS Act and Private Capital; IBM +12.43%
The core facts:The US Department of Commerce and IBM announced a Letter of Intent on May 21 to award $1 billion in CHIPS Act incentives to fund “Anderon” — America’s first purpose-built quantum chip manufacturing foundry. IBM commits an additional $1 billion in cash, intellectual property, assets, and workforce. The proposed Albany, NY facility will operate as a 300-millimeter quantum wafer foundry serving multiple quantum hardware vendors, initially focused on superconducting qubit wafers. The Commerce Department’s total quantum investment across the sector reaches $2 billion, with D-Wave Quantum and Rigetti Computing each receiving up to $100 million separately. IBM surged +12.43% on the news, with the broader semiconductor complex rallying (QCOM, MU, LRCX up 3–5%+).
Why it matters:The CHIPS Act’s extension into quantum computing marks a strategic inflection point: US industrial policy has moved from defending legacy semiconductor fabs (TSMC, Intel) to actively seeding the next generation of computing infrastructure. Anderon’s open-access foundry model — serving multiple vendors rather than IBM alone — mirrors the logic of TSMC’s merchant fab success and dramatically lowers barriers for quantum hardware startups to reach commercial scale. IBM’s +12.43% move on a ~$230B market cap company represents approximately $27 billion in market cap creation in a single session, a move that catalyzed the entire AI and semiconductor complex. For the US portfolio manager: (1) The quantum supply chain — cryogenic components, specialized electronics, quantum error-correction software — is now eligible for the same industrial policy tailwind that drove the first CHIPS Act wave into traditional semiconductor names; (2) The $2 billion total federal quantum investment signals bipartisan commitment to domestic quantum leadership before China closes the manufacturing gap; (3) IBM’s pivot from a hardware-to-services company back toward advanced hardware manufacturing resets its long-term earnings narrative.
What to watch:Congressional confirmation of the $1B CHIPS Award and any conditions attached; Anderon’s first commercial quantum wafer production timeline; D-Wave (QBTS) and Rigetti (RGTI) stock response as fellow CHIPS recipients; the next CHIPS Act funding round for further quantum scope expansion.
BEARISH
2. Walmart Guidance Miss Signals Consumer Deceleration — CEO Cites Tariff Uncertainty and Fuel Costs; WMT -7.27% as Largest US Retailer Warns on Q2
The core facts:Walmart (WMT, $967B market cap) reported Q1 FY2027 revenue of $177.75 billion — a +1.66% beat vs. the $174.84 billion consensus. US comparable sales rose +4.1%. However, the company’s Q2 revenue guidance midpoint of approximately $185.4 billion fell short of the $186.4 billion consensus, and full-year EPS guidance of $2.75–$2.85 missed the $2.92 consensus. CEO Doug McMillon explicitly cited tariff uncertainty and elevated fuel costs as structural headwinds to consumer spending in the near term. WMT fell -7.27%, dragging the Consumer Staples sector lower; Costco (COST) fell -2.19% in sympathy. (Earnings details covered in Section F.)
Why it matters:When the largest US retailer serving approximately 90% of American households misses guidance and cites tariffs and fuel as the explicit cause, it functions as the most credible real-economy consumer stress signal available. This is not survey data or soft sentiment — this is actual corporate guidance from a company with unparalleled visibility into household spending across every income quintile. Two direct macro transmissions emerge: (1) Tariff uncertainty is now explicitly embedded in actual mega-cap corporate guidance, not just PMI surveys — WMT is the first >$500B retailer to formally attribute a guidance miss to tariff-driven demand caution, which will force buy-side models to incorporate a tariff demand-destruction assumption into forward PCE estimates; (2) Elevated fuel costs are compressing real purchasing power in essential retail, suggesting that even the “trade down” dynamic that benefited Walmart over dollar stores is now under pressure. A -7.27% move on a ~$1 trillion market cap stock erases approximately $70 billion in market value in one session — that transmission into index levels and institutional rebalancing is direct and immediate.
What to watch:June retail sales data for national-level confirmation of WMT’s consumer deceleration signal; WMT Q2 actual revenue vs. the $185.4B guidance midpoint as the definitive tariff-impact verification; July CPI for tariff and fuel cost pass-through into consumer prices.
BEARISH
3. Philadelphia Fed Manufacturing Index Collapses 27 Points to -0.4 — New Orders Crater to Lowest Since April 2025 in One of the Largest Single-Month Drops on Record
The core facts:The Philadelphia Fed’s Manufacturing Business Outlook Survey for May 2026 collapsed to -0.4 from +26.7 in April — a 27-point one-month deterioration versus the +18.0 consensus estimate, one of the largest one-month drops in the survey’s recent history. New orders plunged 35 points to -1.7, the lowest reading since April 2025. Shipments fell 29 points to 4.9. The employment index ticked up but remained negative. Despite the alarming current conditions, the future general activity index rose 12 points to 53.2 — its highest reading since June 2021 — with nearly two-thirds of surveyed firms expecting activity increases over the next six months. (Full data detail covered in Section E.)
Why it matters:A 27-point collapse from robust expansion to near-contraction in a single month signals abrupt demand destruction in the Federal Reserve’s Third District (Pennsylvania, New Jersey, Delaware). The market implications are multi-layered: (1) The simultaneous release of the S&P Global Flash PMI showing manufacturing at a 4-year high (55.3) creates a national vs. regional divergence that the Fed must now interpret — is Philly a leading indicator for the nation, or an outlier driven by district-specific tariff exposure? (2) New orders at -1.7 are a production-leading signal — historically, sub-zero new orders precede manufacturing employment cuts by 2–3 months, raising the prospect of regional jobless claim increases by late Q2; (3) The futures-vs.-current gap (future +53.2 vs. current -0.4) suggests firms expect the downturn to be temporary — likely tethered to Iran/energy uncertainty resolution — but if peace talks stall and oil re-accelerates, the current weakness could transition from cyclical trough to sustained contraction. Taken together with Walmart’s guidance miss, the Philly Fed data reinforces a mounting picture of demand stress in the US economy driven by tariff and energy-cost transmission.
What to watch:ISM Manufacturing (June 2) for national-level confirmation or divergence from the Philly Fed regional signal; June Philly Fed for trend confirmation or reversal; jobless claims from Third District states for early signs of manufacturing layoffs.
UNCERTAIN
4. S&P Global Flash PMI: US Manufacturing Surges to 4-Year High While Input Prices Explode to Fastest Acceleration Since November 2022 — Services Weakens
The core facts:The S&P Global US Flash PMI for May 2026 showed manufacturing at 55.3 — the highest reading since May 2022, beating the 53.8 estimate and up from 54.5 in April. Services PMI slipped to 50.9 (vs. 51.1 expected, 51.0 prior). The Composite PMI held at 51.7. Critically, the input price index surged to 64.0 — the highest reading since November 2022 and the fastest one-month acceleration since the 2022 energy shock. Supplier delivery times lengthened significantly, the most since August 2022, partly driven by Middle East conflict supply chain disruptions. At current composite levels, S&P Global projects US Q2 GDP growth at approximately 1% annualized. (Full data detail covered in Section E.)
Why it matters:The PMI data delivers a policy paradox: manufacturing is booming by historic standards while simultaneously generating price pressures that undercut any Fed impulse to hold rates steady. The input price index at 64.0 is the most hawkish datapoint released today — it directly buttresses Barkin’s argument that repeated supply shocks are testing the inflation anchor, and it makes the “look through” framework increasingly untenable to defend publicly. Three portfolio-level transmissions: (1) For the rate path — the price surge gives the FOMC hawks the data ammunition they need to push for explicit tightening language at the June 16–17 meeting; the combination of PMI prices + FOMC April hawkish minutes + Barkin’s public questioning creates a coherent internal case for rate action; (2) For equities — a manufacturing expansion that delivers goods with an inflationary payload is stagflation-adjacent: real revenue growth exists, but margin compression from input costs will hit industrial and consumer goods companies simultaneously; (3) For the divergence story — manufacturing at 55.3 nationally while Philly Fed collapses to -0.4 regionally suggests the strength is concentrated in specific sectors (energy-adjacent, defense, construction materials) while traditional manufacturing faces the tariff and demand headwinds visible in the Philadelphia data and Walmart’s guidance.
What to watch:May CPI (June 10) for confirmation that PMI input price acceleration is transmitting into realized consumer inflation; June FOMC statement language on inflation risks; June Flash PMI for whether the price surge moderates or accelerates as the definitive test of transitory vs. structural.
BEARISH
5. Richmond Fed’s Barkin Publicly Questions Whether Fed Can Continue “Looking Through” Supply Shocks — Five Years Above Target Tests Inflation Anchor
The core facts:Richmond Fed President Tom Barkin stated on May 21 that repeated economic supply shocks are testing the Federal Reserve’s capacity to “look through” elevated inflation without initiating fresh interest rate hikes. Barkin questioned whether more than five consecutive years of inflation above the 2% target risk loosening the inflation anchor — a threshold condition under which continued forbearance becomes institutionally indefensible. He described the rate path as hinging on three conditions: (a) whether consumers remain resilient in their spending, (b) whether businesses use rising productivity as justification for layoffs, and (c) whether long-run inflation expectations remain anchored. Barkin did not give explicit rate guidance, but market pricing for at least one 25-basis-point hike by December 2026 currently exceeds 50%.
Why it matters:Barkin’s speech is not a standalone event — it is a public articulation of the internal policy drift already documented in the April FOMC minutes (released May 20), where a majority of participants indicated they would support additional firming if inflation persists. The significance lies in the philosophical framing: “look through” has been the Fed’s operational anchor since the 2022 tightening cycle ended — the policy doctrine that transitory shocks do not require permanent rate responses. Barkin is now asking publicly whether that doctrine is still defensible after five years of above-target inflation driven by a succession of shocks. For bond markets, this matters because: (1) If Chair Warsh endorses Barkin’s skepticism about “look through” at the June 16–17 FOMC meeting — his first as Chair — it effectively signals the doctrine is being retired and rate hikes become the default response to future supply shocks rather than the exception; (2) Today’s PMI price surge (input prices at 64.0, highest since Nov 2022) provides precisely the “another supply shock” scenario Barkin is warning about; (3) WMT’s tariff/fuel guidance miss and the Philly Fed collapse simultaneously show the costs — a consumer-economy recession risk — of tightening into this environment. The policy dilemma is sharpening.
What to watch:June 16–17 FOMC meeting — specifically whether Warsh explicitly modifies the “look through” framework or removes the easing bias in the policy statement; CME FedWatch December 2026 hike probability for re-pricing following today’s data cluster; any Barkin follow-up speech providing explicit rate guidance before June’s meeting.
— Quantifying recession risk so you don’t have to guess. Apply for membership at join.recessionalert.comD. MODERATE-IMPACT STORIES -> TOP
UNCERTAIN
6. NVIDIA Falls -1.77% Despite Record Q1 Beat — Fourth Straight Post-Earnings Decline as Market Demands Forward Narrative Beyond the Numbers
The core facts:NVIDIA (NVDA) closed -1.77% on May 21 in a “sell the news” session following record Q1 FY2027 results reported after Wednesday’s close: revenue +85% YoY to $81.62 billion (beat $78.91B est.), EPS $1.87 vs. $1.75 est., data center revenue $75.2 billion (beat $73.47B), Q2 guidance of approximately $89–93 billion (above the $87.36B consensus), and an $80 billion share repurchase program. The Q2 midpoint guide (~$91B) did not reach the upper end of analyst expectations — triggering profit-taking. This marks NVDA’s fourth consecutive session with a lower stock price following an earnings beat. (Earnings details covered in Section F.)
Why it matters:NVDA’s post-earnings performance now constitutes a defined behavioral pattern: the stock requires not just beats, but beat-and-exceed-the-highest-estimate to generate a positive session. This has direct implications for AI sector valuations: (1) The AI capex cycle is no longer rewarding the infrastructure layer simply for delivering — the market is beginning to demand evidence that the $1 trillion-plus annual AI capex committed by hyperscalers is generating commensurate revenue returns; (2) AMD, AVGO, and other AI chip beneficiaries face a similar “good results, falling stock” dynamic as the sector exits its initial euphoria phase and enters a fundamentals-evaluation period; (3) For hyperscalers (MSFT, AMZN, GOOGL, META) committed to multi-hundred-billion-dollar AI capex programs, the NVDA price signal creates pressure to articulate AI monetization timelines at their own Q2 earnings calls — investors are shifting the conversation from “are you spending on AI?” to “when does AI spending generate revenue?”
What to watch:NVDA’s next quarterly call for Q3 FY2028 guidance relative to upper-end analyst estimates; AMD Q2 2026 earnings for parallel AI infrastructure demand confirmation; hyperscaler Q2 earnings calls for explicit AI ROI framing vs. capex commitment data.
UNCERTAIN
7. April Housing Starts Beat but Fall 2.8% MoM; Building Permits Surge 5.8% — Mortgage Rates at One-Year Highs Shadow Homebuilder Recovery
The core facts:April 2026 housing starts came in at a seasonally adjusted annual rate of 1.465 million, beating the 1.41 million consensus but declining -2.8% month-over-month from March’s revised 1.507 million. Single-family starts fell -9% MoM. Building permits surged +5.8% MoM to 1.442 million, exceeding the 1.39 million estimate and signaling renewed pipeline activity. Regionally, the South fell -11.0% while the Northeast (+16.1%), West (+5.0%), and Midwest (+2.5%) all recorded gains. The 30-year fixed mortgage rate sits near a one-year high, with futures markets pricing approximately 60% probability of at least one rate hike by year-end. NAHB builder sentiment has registered negative for 25 consecutive months. (Full data detail covered in Section E.)
Why it matters:The housing data captures the economy’s rate-sensitivity inflection point: the permit surge (+5.8%) signals builders are confident enough in medium-term demand to break ground, but the starts decline (-2.8% MoM, single-family -9%) confirms that today’s mortgage rate environment is actively suppressing conversions from permits to active construction. For homebuilder equities (LEN, DHI, PHM): near-term revenue pipeline from permits is intact, but cost-of-capital pressures are extending project timelines and compressing land-to-start conversion ratios. The broader macro signal: housing is the most rate-sensitive major US economic sector, and the current data shows the Fed’s past tightening is still working its way through the construction pipeline. Any December 2026 rate hike would extend mortgage rate pressure into 2027, materially delaying the housing recovery that is only now beginning to stabilize from the mid-2025 lows.
What to watch:June housing starts for trend confirmation; 30-year mortgage rate for movement above or below 7.0% as the key affordability threshold for single-family starts recovery; Friday’s Existing Home Sales for the demand-side read on the current market.
BULLISH
8. Estée Lauder and Puig Terminate $40B Merger Talks — EL Surges +12% After Hours as Market Celebrates Removal of Integration Risk
The core facts:The Estée Lauder Companies and Spain’s Puig jointly announced on May 21 the termination of merger discussions that had been confirmed in March 2026. The proposed combination would have created a $40 billion luxury beauty conglomerate combining Estée Lauder brands (Tom Ford, Clinique, MAC, La Mer) with Puig brands (Carolina Herrera, Rabanne, Jean Paul Gaultier). EL shares surged approximately +12% in extended trading immediately following the announcement. RBC Capital analyst Nik Modi noted that analysts were “relieved,” citing the prolonged integration risk and execution complexity that would have weighed on the stock for an extended period. Estée Lauder indicated it remains fully focused on executing its “Beauty Reimagined” standalone strategy.
Why it matters:The deal termination is unambiguously bullish for EL in the near term: the market had embedded a meaningful M&A complexity discount into EL’s standalone valuation, reflecting the execution risk of integrating a Franco-Spanish luxury house with a US publicly traded company. The discount removal restores the full market value of EL’s organic strategy at a time when the “Beauty Reimagined” turnaround plan is showing early traction. Broader sector implications: (1) L’Oréal retains its dominant position as the world’s leading beauty conglomerate without facing a scaled challenger from a Puig-EL combination — a net positive for the sector leader’s competitive moat; (2) Puig, which IPO’d in 2024, must now reassess its standalone acquisition strategy without access to EL’s US distribution infrastructure and balance sheet; (3) The failed deal underscores the structural difficulty of cross-border luxury M&A — brand identity dilution, regulatory complexity, and shareholder skepticism create persistent execution risk premiums that often exceed the synergy estimates that justify premium valuations in LOI filings.
What to watch:EL’s regular-session price action for follow-through from AH gains; EL’s next earnings call for Beauty Reimagined strategy metrics and any new inorganic growth commentary; L’Oréal’s Q2 2026 results for competitive read on global beauty demand.
UNCERTAIN
9. Stellantis Bets $70B on 60-Model Turnaround — Sidelining Chrysler and Alfa Romeo While Planning Contract Manufacturing for Chinese Automakers
The core facts:Stellantis presented its “Dakar” strategic turnaround plan at Investor Day 2026 in Auburn Hills, Michigan on May 21, committing €60 billion (~$70 billion) through 2030. The plan concentrates 70% of brand and product investment on four brands: Jeep, Ram, Peugeot, and Fiat, while relegating Chrysler and Alfa Romeo to substantially reduced investment roles. The company targets launching 60 new models by 2030 and plans to convert underutilized North American and European factory capacity into a revenue-generating contract manufacturing business — including for Chinese automakers in Europe and Tata Motors’ Jaguar Land Rover in the US. Financial targets: 10% returns in North America and 5% for Europe by 2030.
Why it matters:Stellantis’s plan carries direct US market and political implications that exceed typical European automaker restructuring. Three dimensions matter: (1) Chrysler’s demotion to a second-tier brand at the company that produces Jeeps and Ram trucks in North American factories is a structural signal about US domestic auto heritage — Chrysler, one of the original Big Three, is being functionally retired to a reduced role at a Franco-Italian holding company, with no clear path to recovery; (2) The contract manufacturing proposal for Chinese automakers using North American factory capacity directly inverts the protectionist narrative that has defined US trade policy — Stellantis would use Ram truck plants to build vehicles for Chinese brands that face prohibitive import tariffs, effectively using domestic production infrastructure to circumvent US trade barriers for foreign competitors; (3) The 60-model blitz implies dramatically intensified competition for US market share across pickup trucks, SUVs, and crossovers — the same segments where Ford (F-150, Bronco) and GM (Silverado, Escalade) are currently most profitable.
What to watch:UAW and congressional reaction to the Chinese automaker contract manufacturing proposal; Stellantis Q2 2026 results for first financial signposts of the Dakar restructuring; Jeep and Ram US market share data for turnaround execution tracking.
UNCERTAIN
10. Federal Reserve Officials Propose Extending Dollar Swap Lines Amid Global Instability — Growing Questions About US Financial Reliability Cited
The core facts:Federal Reserve officials proposed on May 21 extending the US dollar swap line agreements with five major central bank partners (Bank of Japan, European Central Bank, Swiss National Bank, Bank of England, Bank of Canada). The proposal emerged from an account of a recent central bank meeting. Officials cited two specific drivers: (1) heightened global financial instability driven by energy market volatility from the ongoing Middle East conflict, and (2) growing international apprehension about US financial reliability as a backstop for global dollar liquidity. Dollar swap lines — through which the Fed provides dollars to foreign central banks in exchange for local currency — have served as the primary backstop for global banking-system dollar liquidity since the 2008 financial crisis.
Why it matters:The dual rationale for extending swap lines is the analytically significant element: energy volatility is expected and manageable, but the explicit acknowledgment of “growing doubts about US financial reliability” is a new development in Federal Reserve communication. This language mirrors the structural concerns that drove Moody’s to downgrade US sovereign credit from Aaa to Aa1 (May 16), that produced below-average demand at the 20-year Treasury auction (May 20), and that are now embedded in sovereign reserve managers’ discussions about marginal Treasury allocation. The Fed’s proposal to extend swap lines is itself a confidence-stabilizing action — it signals policymakers see global dollar stress as elevated enough to warrant explicit institutional reassurance. For institutional portfolios: (1) An extension of swap lines reduces acute systemic risk from dollar funding shortfalls in foreign markets — net positive for financial stability and credit spreads; (2) The explicit “reliability” concern language, if sustained, marks an incremental step in the slow-motion dollar reserve status debate; (3) The proposal highlights that the Fed is simultaneously managing a potential rate hike cycle (hawkish inflation response) and a global liquidity provision role (dovish financial stability response) — a policy tension that creates complexity for fixed-income positioning.
What to watch:Formal Fed Board vote on swap line extension and the terms approved; DXY (US Dollar Index) for whether “reliability” concerns translate into reserve diversification flows; foreign central bank statements on dollar dependency as the structural confidence indicator.
— Separating signal from noise since 2007. Apply for membership at join.recessionalert.comE. ECONOMY WATCH -> TOP
Thursday’s data delivered a study in contradictions: labor markets tightened further (claims 209K, continuing claims 1,782K below expectations) while national manufacturing hit a four-year high (S&P PMI 55.3), yet the Philadelphia Fed’s general activity index cratered from +26.7 to –0.4 — a 27-point swing driving new orders into contraction for the first time since April 2025. Walmart’s below-consensus FY27 EPS guidance ($2.75–$2.85 vs. $2.92 consensus) and explicit citation of “tariff uncertainty and elevated fuel prices” as headwinds underscore that even a top-line revenue beat hasn’t insulated the consumer from margin compression. S&P Global flagged input costs rising at the fastest pace since the 2022 energy shock, with firms passing increases directly to customers — a stagflation signal that gives the Fed no pivot room.
S&P Global US Flash PMI May 2026: Manufacturing Hits 4-Year High at 55.3 While Services Stalls at 50.9; Prices Surge at Fastest Pace Since 2022 Energy Shock (S&P Global, May 21, 2026)
What they’re saying:The S&P Global US Manufacturing PMI flash estimate rose to 55.3 in May from 54.5 in April — the strongest reading since May 2022 and above the 53.8 consensus. Output and new orders both expanded at their fastest pace in four years, with client precautionary stockpiling ahead of potential tariff escalations contributing to order volumes. The Composite PMI held steady at 51.7, but Services PMI slipped to 50.9 from 51.1 expected, putting it on pace for its weakest quarter since late 2023.
The context:The bifurcation between manufacturing (booming) and services (barely growing) reflects different tariff exposures: goods-side benefits from front-running inventory builds while services face weaker consumer discretionary demand. The more troubling signal is cost pressures — input prices rose at the fastest rate since the 2022 energy shock, with firms passing increases directly to customers. That’s a stagflationary pattern: growth in volumes, inflation in prices, and no catalyst for the Fed to ease. Supplier delivery times also lengthened the most since August 2022, partly due to Middle East conflict disruptions, artificially flattering the headline PMI.
What to watch:Friday’s University of Michigan Consumer Sentiment final (expected 48.2 — near-historic low) and CB Leading Index for April (expected –0.2%) will test whether the services/manufacturing divide widens further. ISM Manufacturing PMI for May is due June 2.
Philadelphia Fed Manufacturing Index Collapses to –0.4 in May from +26.7, Missing +18 Consensus by 18 Points as New Orders Turn Negative (Philadelphia Fed, May 21, 2026)
What they’re saying:The Philadelphia Fed’s May Manufacturing Business Outlook Survey general activity index plummeted to –0.4 from +26.7 in April — a 27-point collapse that obliterated the +18 consensus. The new orders index fell 35 points to –1.7, its lowest reading since April 2025, and shipments dropped 29 points to 4.9. Employment contracted at –2.8 (improved from –5.1 prior). Prices paid remained elevated at 47.9 (cooling from 59.3 prior). The lone bright spot: future general activity surged 12 points to 53.2 — the highest since June 2021 — with 67% of firms expecting increased activity over the next six months.
The context:The Philly Fed miss stands in stark contrast to today’s S&P Global Flash Manufacturing PMI (55.3, a four-year high) — the regional divergence likely reflects the Philadelphia district’s concentration in tariff-sensitive manufacturing and import-dependent supply chains. The sharp reversal from four consecutive months of gains also raises the question of whether April’s +26.7 reading was an inventory front-running spike that has now fully unwound. The elevated prices paid component, even while moderating, confirms cost pass-through pressure is not abating. Markets will discount the single-month Philly data but cannot ignore the new orders signal.
What to watch:ISM Manufacturing PMI for May (due June 2) will determine whether this is a Philadelphia-specific disruption or the leading edge of a national manufacturing turn. Empire State Manufacturing Survey (June 16) offers another regional cross-check.
Initial Jobless Claims Fall 3K to 209K for Week Ending May 16, Below 210K Consensus; Continuing Claims 1,782K (DOL, May 21, 2026)
What they’re saying:Initial unemployment insurance claims declined 3,000 to a seasonally adjusted 209,000 for the week ending May 16 — below the 210,000 consensus and down from 212,000 the prior week. The four-week moving average stands at 202,500. Continuing claims for the week ending May 9 rose 6,000 to 1,782,000, slightly below the 1,790,000 consensus.
The context:Claims at 209K remain well below the 250–300K range historically associated with recessionary conditions, confirming that the labor market’s layoff rate is still extremely low. The modest drift upward in continuing claims (1,782K vs. 1,776K prior) suggests displaced workers are taking incrementally longer to find new employment — a signal of tighter re-hiring conditions rather than renewed demand weakness. With the Fed watching for labor market deterioration as a trigger for cuts, these data actively extend the “higher for longer” timeline.
What to watch:Next week’s initial claims (due May 28) and the May nonfarm payrolls report (due June 6, consensus ~+175K) are the next key labor market reads.
Housing Starts Slip 2.8% MoM to 1.465M Annual Rate in April, but Building Permits Jump 5.8% to 1.442M — Both Beat Consensus (Census Bureau / HUD, May 21, 2026)
What they’re saying:Privately-owned housing starts fell to a seasonally adjusted annual rate of 1.465 million in April — a 2.8% MoM decline from March’s revised 1.507 million — but beat the consensus estimate of 1.41 million and are 4.6% above April 2025. Single-family starts fell sharply by 9.0% MoM to 930,000. Building permits rose 5.8% to 1.442 million (vs. 1.39M expected, vs. 1.363M prior), with multi-family units driving the gain; single-family permits fell 2.6% to 872,000.
The context:The divergence between the coincident (starts –2.8% MoM) and leading (permits +5.8% MoM) indicators creates an uncertain read. The pullback in starts after March’s 12% surge was expected, but the 9% decline in single-family starts is sharper than anticipated and likely reflects builder caution around tariff-driven lumber and materials cost uncertainty. Permits above 1.4M for the second consecutive month suggest the construction pipeline remains healthy even as current activity ebbs. With 30-year mortgage rates at 6.51% and affordability under persistent pressure, sustaining permit volumes into completions remains contingent on rate trajectory.
What to watch:Friday’s Existing Home Sales for April (expected ~4.13M SAAR) and Fed Waller’s speech Friday morning will frame the housing/rate outlook.
Walmart Q1 FY27: Revenue Beats at $177.8B (+7.3% YoY) but Below-Consensus EPS Guidance Flags Tariff and Fuel Headwinds; Stock –6.2% (Walmart, May 21, 2026)
What they’re saying:Walmart reported Q1 FY27 net revenues of $177.8 billion, up 7.3% year-over-year and above the ~$174.8 billion consensus. US comparable sales ex-fuel rose 4.1%, while global e-commerce, Walmart+ membership and advertising revenue all contributed positively. Full-year FY27 adjusted EPS guidance of $2.75–$2.85, however, came in below analyst expectations of ~$2.92. CEO John Furner cited “elevated fuel prices and a fluid tariff environment” as creating uncertainty around consumer behavior and pricing dynamics. Shares fell 6.2% to $122.78.
The context:As the world’s largest retailer, Walmart functions as the most direct real-time read on US consumer health. The 4.1% US comp growth confirms consumer spending is holding in nominal terms — but the cautious EPS outlook reveals margin compression from tariff pass-through and fuel costs that management is unwilling to fully absorb. The market’s 6.2% verdict despite a revenue beat reflects the same stagflation dynamic visible across today’s PMI and inflation data: companies selling more but earning less; consumers spending more but getting less purchasing power. For portfolio managers, WMT’s commentary corroborates the cautious guidance from other consumer-facing firms navigating a tariff-driven cost environment.
What to watch:Friday’s University of Michigan Consumer Sentiment final (expected 48.2 — near-record low) and Target’s Q1 earnings (due May 21 AMC per recent calendar) will provide additional consumer spending data points.
— Know the probability before the market prices in the risk. Apply for membership at join.recessionalert.comF. EARNINGS WATCH -> TOP
YESTERDAY AFTER THE BELL (Markets Reacted Today)
UNCERTAIN
11. NVIDIA Corporation (NVDA): -1.77% | Record Q1 FY2027 Beats on All Metrics — “Sell the News” Returns as Q2 Guide Misses Upper-End Estimates
The Numbers:Q1 FY2027 revenue: $81.62B vs. $78.91B est. (+3.4% beat); +85% YoY. EPS: $1.87 vs. $1.75 est. (+6.9% beat). Data center: $75.2B vs. $73.47B est. Gaming: record $3.76B (+42% YoY). China H20 revenue headwind absorbed (~$4.6B vs. prior year). Q2 FY2028 guidance: ~$89–93B (above $87.36B consensus, but below upper-end estimates). $80B share repurchase announced. Released: AMC May 20.
The Problem/Win:The WIN: NVIDIA absorbed the full China H20 export control headwind (~$4.6B lost vs. prior year) and still delivered an 85% revenue surge — definitively invalidating the “demand saturation” bear thesis. The $80B buyback signals management’s conviction in sustained cash generation at multi-hundred-billion annual revenue run rates. The PROBLEM: the market applied a discipline it has increasingly used over four consecutive post-earnings sessions — the Q2 guide midpoint (~$91B) was above consensus but did not reach the upper end of analyst estimates, triggering profit-taking from traders who had built positions in anticipation of a “beat and exceed all estimates” event. This is the fourth consecutive session in which NVDA closed lower following an earnings beat.
The Ripple:AMD and LRCX — which surged +8.1% and +6.84% respectively the prior session on AI cycle optimism — consolidated; Nasdaq edged up only +0.09% for the session, with NVDA’s decline acting as the primary index drag on what would otherwise have been a stronger technology day. Hyperscalers (MSFT, AMZN, GOOGL, META) will face renewed scrutiny to quantify AI revenue generation vs. NVDA order cadence at their Q2 earnings calls.
What It Means:NVDA is delivering on the fundamental AI infrastructure story at every quarter, but the stock’s valuation has run ahead of even exceptional execution. The market is now effectively pricing in an acceleration of the already-record growth rate — setting a bar that even the world’s most profitable semiconductor company struggles to clear.
What to watch:NVDA’s next quarterly call for Q3 FY2028 guidance relative to upper-range estimates; AMD Q2 earnings for parallel AI demand signal; hyperscaler Q2 AI capex and revenue commentary as demand-side validation.
UNCERTAIN
12. Intuit Inc (INTU): -11.45% AH | Q3 FY2026 Beat and Guidance Raise Overwhelmed by 17% Workforce Reduction Announcement
The Numbers:Q3 FY2026 revenue +10% YoY. TurboTax: $4.4B (+7%); Credit Karma: $631M (+15%); Global Business Solutions: $3.3B (+15%), Online Ecosystem $2.5B (+19%). Full-year FY2026 revenue guidance raised to $21.341–$21.374B (+13–14% growth). Non-GAAP EPS guidance raised to $23.80–$23.85 (+18% growth). Simultaneously announced: 17% reduction in full-time workforce, restructuring management layers to flatten the organization. Released: AMC May 20.
The Problem/Win:The WIN: every business segment grew double digits; full-year guidance raised meaningfully on both revenue and EPS. The PROBLEM: the simultaneous announcement of a 17% workforce reduction — the largest in Intuit’s history — signaled to the market that management is extracting margin through structural cost cuts rather than through organic operating leverage. Investors interpreted this as an AI-driven displacement restructuring: Intuit is replacing human-intensive roles with AI automation in TurboTax, QuickBooks, and customer support functions. The market penalized the guidance raise because workforce cuts of this magnitude often precede revenue growth deceleration, not acceleration — raising questions about whether the guidance raise is sustainable or whether it is being financed by a one-time cost reduction that cannot repeat.
The Ripple:The INTU workforce reduction adds to a growing pattern of large-cap enterprise software companies using AI-efficiency gains to reduce headcount while maintaining revenue guidance — a trend with direct implications for white-collar employment in financial software, tax services, and small-business tools. INTU’s 17% cut represents approximately 3,000 full-time positions.
What It Means:Intuit is demonstrating that AI-driven efficiency gains can simultaneously improve margins and raise guidance — but the market is skeptical this trajectory is sustainable without eventual revenue impact from reduced customer service capacity and product development throughput.
What to watch:INTU Q4 FY2026 earnings for revenue trajectory post-restructuring; small business software sector peers (ADBE, CRM) for parallel AI-driven headcount reduction signals; TurboTax market share data as customer retention post-workforce cut test.
TODAY BEFORE THE BELL (Markets Already Reacted)
UNCERTAIN
13. Walmart Inc (WMT): -7.27% | Q1 Revenue Beat Overwhelmed by Q2 Guidance Miss — CEO Explicitly Cites Tariffs and Fuel as Consumer Headwinds
The Numbers:Q1 FY2027 revenue: $177.75B vs. $174.84B est. (+1.66% beat; +7.3% YoY). EPS: $0.66 vs. $0.66 est. (+0.18%, inline). US comparable sales: +4.1%. Q2 FY2027 revenue guidance: ~$185.4B midpoint vs. $186.4B consensus. Full-year EPS guidance: $2.75–$2.85 vs. $2.92 consensus. Released: BMO May 21.
The Problem/Win:The WIN: Q1 revenue beat and solid US comp sales growth (+4.1%) confirm WMT’s continued category market share gains and eCommerce expansion. The PROBLEM: both Q2 and full-year guidance missed consensus, and CEO Doug McMillon’s explicit citation of tariff uncertainty and elevated fuel costs as the structural drivers was the most significant element of the earnings call. WMT does not give guidance misses casually — the company has historically set conservative targets it reliably meets. A deliberate guidance miss with an explicit tariff attribution signals management has visibility into a genuine demand deceleration driven by policy uncertainty, not cyclical softness.
The Ripple:Costco (COST) fell -2.19% in sympathy; the broader Consumer Staples sector underperformed. The market’s -7.27% reaction on a ~$1 trillion market cap company represented approximately $70 billion in market value destruction — a signal that institutional portfolios took the guidance miss seriously as a macro read-through, not a company-specific execution issue. Target (TGT) and Dollar General (DG) will be watched closely as the next consumer-health data points.
What It Means:Walmart’s guidance miss with an explicit tariff/fuel attribution is a definitive real-economy signal that policy uncertainty is now translating into corporate demand conservatism at the largest scale available — the company with the most comprehensive view of American household spending is guiding lower, and blaming trade policy for it.
What to watch:WMT Q2 actual results vs. $185.4B midpoint as the tariff-demand-destruction verification; June retail sales for national confirmation; Target Q2 earnings as the next large-format retail consumer health read.
UNCERTAIN
14. Deere & Company (DE): -5.19% | Q2 EPS Beats on One-Time Tariff Refund — Core Large Ag Demand Down 14%, Full-Year Industry Outlook -15 to -20%
The Numbers:Q2 FY2026 EPS: $6.55 vs. $5.70 est. (+14.95% beat). Total net sales and revenues: $13.37B (+5% YoY). Equipment Operations margin: 16.9% (includes $272M one-time IEEPA tariff refund, adding ~2.5 percentage points). Segment detail: Production & Precision Ag $4.50B (-14%); Small Ag & Turf $3.49B (+16%); Construction & Forestry $3.79B (+29%). Full-year FY2026 net income guidance maintained: $4.5–$5.0B. Large Ag industry demand outlook: -15 to -20% for full fiscal year. Released: BMO May 21.
The Problem/Win:The WIN: EPS significantly beat on headline, Construction & Forestry surged +29% (infrastructure boom), Small Ag & Turf recovered +16%. The PROBLEM: the market saw through the headline beat. Excluding the $272M one-time IEEPA tariff refund, Equipment Operations margins would have been approximately 14.4% rather than 16.9% — a quality-of-earnings concern. More critically, the core Production & Precision Ag segment (Deere’s largest and highest-margin business) declined -14%, and management’s full-year industry demand outlook of -15 to -20% for large agricultural equipment signals that the farm economy headwinds will persist through fiscal year-end. The combination of one-time margin support and structural Ag demand weakness drove the -5.19% session decline despite the headline beat.
The Ripple:AGCO and CNH Industrial will be watched for parallel large Ag demand confirmation; Caterpillar (CAT) may see positive spillover from DE’s Construction & Forestry strength (+29%), as the two companies share infrastructure/construction exposure. The large Ag demand weakness represents structural pressure in the US rural Midwest — a demographic and economic signal that diverges from the broader industrial recovery narrative.
What It Means:Deere’s results reveal a bifurcated agricultural and industrial economy: large farm operators are retrenching (trade uncertainty, commodity price volatility, equipment financing costs), while construction and infrastructure activity surges — the CHIPS Act and infrastructure bill investment cycle is generating real equipment demand that partially offsets the agricultural downturn.
What to watch:AGCO Q2 2026 earnings for large Ag demand corroboration; Caterpillar Q2 for Construction & Forestry sector read; USDA crop commodity price outlook as the underlying driver of farm equipment demand recovery timing.
TODAY AFTER THE BELL (Markets React Tomorrow)
No major earnings after the bell from companies with >$100B market cap.
WEEK AHEAD PREVIEW:
Q1 2026 earnings season is functionally complete — approximately 92% of the S&P 500 has reported, with NVIDIA’s record May 20 print marking the season’s final major data point. Q2 2026 guidance season is now the primary focus. US markets are closed Monday, May 25 (Memorial Day), making next week a four-session trading week.
Salesforce (CRM) — AMC Wednesday, May 27 — Key focus: Agentforce AI agent platform adoption and revenue contribution; enterprise software spending amid tariff uncertainty and corporate cost-cutting; Q2 2026 revenue guidance vs. analyst estimates for AI-driven upsell trajectory. Salesforce is the next major bellwether for enterprise AI monetization — its call will set the tone for the broader SaaS sector’s Q2 outlook.
No other companies with >$100B US market cap are currently confirmed to report during the May 26–29 window. Q2 2026 earnings season begins in earnest in mid-July.
— US market commentary trusted by family offices and institutions. Apply for membership at join.recessionalert.comG. WHAT’S NEXT -> TOP
UPCOMING RELEASES:
| Date | Event | Why It Matters |
|---|---|---|
| Fri, May 22 | Fed Governor Waller Speech (11:00 AM ET) | First Fed communication since Barkin publicly questioned the “look through” doctrine and today’s Flash PMI input prices surged to a post-2022 high. Markets watching for any signal on June 16–17 FOMC framing — particularly whether Waller echoes Barkin’s forbearance skepticism or reasserts the hold-and-wait stance. |
| Fri, May 22 | Michigan Consumer Sentiment Final — May (exp. 48.2, prior 49.8); Inflation Expectations (exp. 4.5%, prior 4.7%); Consumer Expectations (exp. 48.5); Current Conditions (exp. 47.8) | At 48.2, sentiment sits near historic lows — a final confirmation of the consumer fragility Walmart’s guidance miss flagged in hard earnings data today. The Inflation Expectations component is the Fed’s primary concern: at 4.5%, it remains far above the 2% target and, if sticky, makes the “look through” doctrine institutionally indefensible. A meaningful decline in inflation expectations would give the Fed cover to hold; a hold or rise accelerates the case for June tightening language. |
| Fri, May 22 | CB Leading Economic Index MoM — Apr (exp. −0.2%, prior −0.6%) | A second consecutive negative reading would extend the LEI’s deceleration signal and provide macro context for the demand stress visible in today’s Philly Fed collapse and Walmart guidance miss. At −0.2% expected, the index points to continued economic softening ahead — a further deterioration would sharpen the case that PMI input price inflation is coexisting with genuine growth deceleration. |
| Fri, May 22 | Existing Home Sales — April (no estimate) | The demand-side complement to today’s housing starts/permits data. With 30-year mortgage rates near a one-year high and single-family starts down 9% MoM, existing sales will confirm whether the rate environment is actively suppressing transactions or whether resilient seller-price flexibility is sustaining turnover. A weaker-than-prior reading would corroborate the housing-as-leading-indicator thesis for broader rate-sensitivity stress. |
KEY QUESTIONS:
1. Does Friday’s Michigan Consumer Sentiment final (exp. 48.2) validate Walmart’s consumer stress warning — and do inflation expectations remain elevated enough at 4.5% to rule out any near-term Fed relief, locking in the policy vice between growth risk and price pressure?
2. Will Fed Governor Waller’s Friday speech explicitly address Barkin’s “look through” challenge, and if two Fed speakers question forbearance within 48 hours, does the June 16–17 FOMC statement move toward removing the easing bias or signaling the first rate hike in this cycle?
3. With national Flash PMI manufacturing at a 4-year high but the Philadelphia Fed collapsing 27 points in the same week, which signal does next week’s regional and ISM data confirm — an isolated regional distortion driven by tariff-sensitive supply chains, or the leading edge of a national manufacturing downturn?
— US market commentary trusted by family offices and institutions. Apply for membership at join.recessionalert.comH. CHART OF THE DAY -> TOP
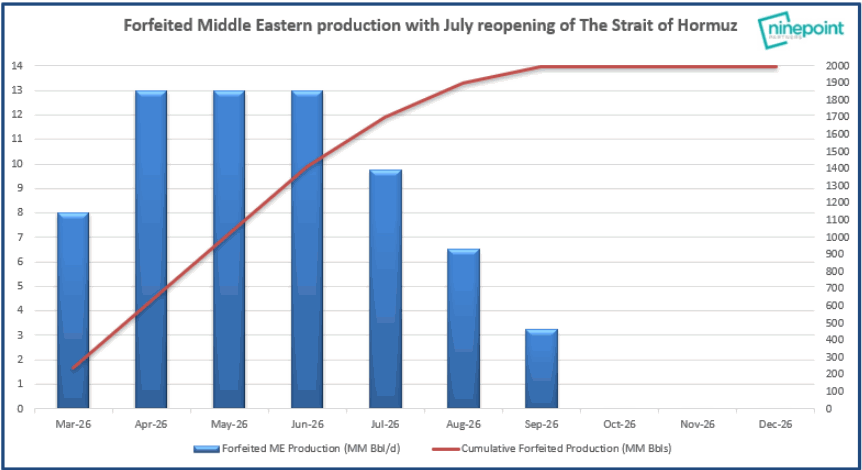
An oil shock fires a familiar reflex — US pump prices, a hotter CPI print, a Fed boxed in. That reflex points at the wrong victim. Strip ~13 MM Bbl/d from global supply at peak — roughly 13% of the world’s ~100 MM Bbl/d, two-to-three times the 1973, 1979, and 1990 shocks — and the damage isn’t a US story; it’s a synchronized stagflationary tax on everyone who imports crude. The US, now roughly oil-neutral, sits closest to the exit: higher prices that bleed consumers also flood domestic producers with revenue, leaving the net hit near zero. The real casualties are Europe, Japan, and above all China and India — growth-sensitive economies structurally short barrels, with no shale cushion to self-insure. Bypass pipelines cap the forfeit at 13 rather than 20, but they run flat-out from day one, a fixed floor with no give. And the cumulative red line — ~2 billion barrels, roughly 20 days of world demand gone — keeps climbing a full quarter after July’s reopening. The shock is global; the safe harbor flies a US flag.
Market Intelligence Brief (MIB) Ver. 18.25
For professional investors only. Not investment advice.
© 2026 RecessionALERT.com

Comments are closed.