
Dow hit a new record (50,580) on US-Iran diplomatic progress; QCOM surged +11.6% on a Stellantis Snapdragon automotive chip deal. Kevin Warsh was sworn in as Fed Chair while Waller dropped the easing bias — markets now price a two-in-three October rate hike. UMich final May sentiment hit an all-time low of 44.8 with 5-year inflation expectations jumping to 3.9%. MRK +5.6% on Phase III lung cancer win with raised guidance; Walmart C-suite shakeup deepens with two senior departures.
TABLE OF CONTENTS
A. EXECUTIVE SUMMARY
B. MARKET DATA
C. HIGH-IMPACT STORIES (5)
D. MODERATE-IMPACT STORIES (5)
E. ECONOMY WATCH (6)
F. EARNINGS WATCH (0)
G. WHAT’S NEXT
H. CHART OF THE DAY
A. EXECUTIVE SUMMARY -> TOP
The Dow Jones hit a new all-time record (50,580) on US-Iran diplomatic progress — a geopolitical relief trade amplified by QCOM’s +11.6% surge on the Stellantis Snapdragon automotive chip partnership, a discrete fundamental catalyst in an otherwise sentiment-driven session. The advance carried a sharp internal contradiction: equities rallied while the Treasury curve bear-flattened (10Y -3.9 bps, 2Y +3.6 bps) on the same day Kevin Warsh was sworn in as Fed Chair and Governor Waller dropped the easing bias, calling rate cuts “crazy” — bond markets refusing to endorse the equity advance. Record-low UMich final May sentiment (44.8) and 5-year inflation expectations surging 40 bps to 3.9% in a single month represent the macro pressures that bonds are already pricing but equity multiples have not yet absorbed. Sector breadth was broadly positive — Industrials and Technology led 8 of 11 sectors higher — while Communication Services (-0.55%) pulled back from its monthly leadership position, a rotation signal worth monitoring into June.
• Iran ceasefire stalls on uranium and Hormuz: Tehran’s demand to retain enriched uranium within its borders rejects the primary US verification demand; separately, the Trump administration called a joint Iran-Oman Hormuz toll proposal “unfeasible.” Brent held above $105, WTI near-flat after spiking intraday to $99.41 on deal headlines before reversing; IEA warned of a global oil supply “red zone” by July–August if unresolved.
• Fed Chair Warsh day-one hawkish signal: Sworn in 54-45 (narrowest modern confirmation) as Governor Waller simultaneously dropped the easing bias and called rate cuts “crazy” — CME FedWatch shifted to price ~two-in-three odds of a 25 bp October hike; the 2-year Treasury yield rose 3.6 bps to 4.123%, its highest since February 2025.
• UMich sentiment all-time record low 44.8: Final May print 3.4 points below consensus; 5-year inflation expectations jumped 40 bps in one month to 3.9% — well above the Fed’s anchor threshold — with 57% of consumers spontaneously citing high prices as eroding personal finances.
• QCOM +11.6% on Stellantis Snapdragon Digital Chassis deal: Multi-year expansion covers ADAS, cockpit, and connectivity across millions of Jeep, Ram, Peugeot, and Fiat vehicles including Level 2+ Ride Pilot; aiMotive autonomous driving unit LOI adds full-stack software angle. Automotive chip read-through: AMD +4.0%, TXN +3.6%; NVDA -1.9% on post-earnings sell-the-news dynamics.
• MRK +5.6% on Phase III lung cancer win with raised guidance: Sacituzumab tirumotecan + Keytruda met primary PFS endpoint in first-line PD-L1-positive NSCLC (OptiTROP-Lung05); validates ADC+checkpoint inhibitor strategy in the largest oncology market; full-year guidance raised on oncology strength — Merck partially decoupled from the consumer stress and rate headwind narratives.
• Walmart C-suite shakeup deepens: Sam’s Club COO Tom Ward (retiring) and EVP US Store Operations Cedric Clark departing days after Q1 guidance miss; separately, WMT disclosed sub-10 gallon fuel fills at Walmart stations for the first time since 2022 — behavioral evidence that lower-income consumers are rationing fuel spend at the margin, translating survey pessimism into observable checkout-level behavior.
1. The Equity-Bond Paradox — The Dow at an all-time record (50,580) and bond markets pricing an October rate hike are telling incompatible stories. The bear-flattening yield curve, Waller’s easing-bias abandonment, UMich record-low sentiment (44.8), and 5-year inflation expectations at 3.9% constitute the most hawkish macro backdrop since 2022 — one that equity valuations, still near peak forward P/E multiples, have not yet absorbed. The divergence between record-low sentiment and record-high equity levels is the widest since the 2022 inflation shock; historically it closes through equity compression, not sentiment recovery.
2. The Fed Transition Amplifies Rate Risk — Warsh inherits the most internally divided Fed since 1992 (four dissenting votes at April FOMC) with PCE running at 3.8% and inflation-anchoring expectations visibly deteriorating. His June 16-17 FOMC presser will be the first true test: does he formally endorse Waller’s hawkish framing or create political space under White House pressure? Either outcome reprices the rate-sensitive sector complex — utilities, REITs, homebuilders — that is built on assumptions of eventual cuts that are being systematically withdrawn.
3. Semiconductor Rotation — Automotive Accelerates, AI Consolidates — QCOM +11.6% and peers AMD/TXN sharply higher while NVDA fell -1.9% illustrates an intra-sector rotation: automotive and industrial semiconductor demand is accelerating with long-cycle visibility (multi-year, multi-brand OEM commitments) while AI GPU demand — strong but fully priced — offers diminishing upside surprise capacity. QCOM’s Stellantis deal, adding millions of vehicles across four brands, anchors an automotive revenue cycle that is only beginning to be valued at scale — a durable multi-year story independent of the AI capex cycle’s next inflection.
 — Leading economic indicators. Accurate market forecasts. Apply for membership at join.recessionalert.com
B. MARKET DATA -> TOP
US-Iran diplomatic progress eased energy supply fears and lifted the Dow Jones to a new all-time record close (+0.58%), the final session before the Memorial Day weekend. Breadth was broadly positive — 8 of 11 S&P sectors advanced, led by Industrials and Technology, while Communication Services lagged; the Russell 2000 (+0.89%) outpaced large-cap benchmarks, adding a small-cap confirmation signal. Qualcomm surged +11.6% on an expanded automotive chip deal with Stellantis, pulling peers AMD (+4.0%) and Texas Instruments (+3.6%) higher, while NVIDIA fell -1.9% in a post-earnings sell-the-news pattern. Treasury yields sent a mixed signal: the 10-year eased 3.9 bps to 4.551%, but the 2-year rose 3.6 bps — curve flattening that suggests bond markets remain cautious beneath the equity headline.
CLOSING PRICES – Friday, May 22, 2026:
MAJOR INDICES
Dow Theory bull confirmation extends into its 5th consecutive session — both DJIA (50,580, new 10-session closing high) and DJTA (+0.79%) confirming simultaneously, the textbook transport-industrial sync that underpins the Dow’s record. Russell 2000 (+0.89%) outpaced the S&P 500 (+0.37%) and Nasdaq 100 (+0.42%) on the day, though the 10-session cumulative gap between small-caps and large-caps remains within normal range — today’s small-cap lead is session-specific, not yet a sustained breadth signal.
| Index | Close | Change | %Move | Why It Moved |
|---|---|---|---|---|
| S&P 500 | 7,473.45 | +27.73 | +0.37% | Broad risk-on advance; Iran diplomatic progress eased energy fears; 10Y yields fell 3.9 bps; Memorial Day pre-holiday bid |
| Dow Jones | 50,579.70 | +294.04 | +0.58% | New all-time record close; Iran talks optimism; blue-chip industrials and financials provided stability; Dow outperformed Nasdaq |
| DJ Transportation | 20,767.4 | +163.2 | +0.79% | Logistics and industrial-adjacent names rallied; QCOM-Stellantis automotive deal boosted sector sentiment; confirms Dow Theory signal |
| Nasdaq 100 | 29,481.64 | +124.37 | +0.42% | Semiconductor split (QCOM +11.6%, AMD +4.0% vs NVDA -1.9%) kept Nasdaq gains moderate; tech broadly positive but mixed within sector |
| Russell 2000 | 2,868.78 | +25.33 | +0.89% | Small-caps led; domestically-focused names benefited as Iran risk eased; broader participation confirmed risk appetite beyond mega-caps |
| NYSE Composite | 23,225.75 | +98.06 | +0.42% | Broad advance confirmed across all exchanges; 8 of 11 S&P sectors rose; breadth positive but not extreme |
VOLATILITY & TREASURIES
The yield curve is sending an internal warning: the 10-year fell 3.9 bps to 4.551% (supportive for equities) while the 2-year rose 3.6 bps to 4.123%, compressing the 10Y-2Y spread from ~49 bps to ~43 bps. This bear flattener is inconsistent with a clean risk-on narrative — it suggests near-term rate caution persisting beneath the equity headline. VIX’s mild dip to 16.70 (-0.36%) confirms no acute fear, but the bond market is not fully endorsing this rally.
| Instrument | Level | Change | Why It Moved |
|---|---|---|---|
| VIX | 16.70 | -0.06 (-0.36%) | Modestly lower; Iran diplomatic progress reduced geopolitical risk premium; pre-holiday calm tempered volatility demand |
| 10-Year Treasury Yield | 4.551% | -3.9 bps | Iran deal narrative reduced inflation risk premium; bond buyers added long duration; long end decoupled from short end |
| 2-Year Treasury Yield | 4.123% | +3.6 bps | Fed rate cut expectations remain constrained; near-term rate path unchanged despite equity rally; 2Y and 10Y diverged |
| US Dollar Index (DXY) | 99.30 | +0.04 (+0.04%) | Dollar essentially unchanged; short-term yield uptick provided marginal support; risk-on equity flow offset haven demand release |
COMMODITIES
Gold fell -0.76% while copper gained +1.46% — a classic growth-confidence divergence where base metals rise on demand optimism as precious metals surrender safe-haven premium. Platinum’s -2.29% underperformed the complex, likely reflecting automotive end-market caution despite the QCOM-Stellantis deal. Bitcoin’s -2.25% decline tracked modest dollar strength and underperformed equities, behaving as a risk-off casualty rather than an inflation hedge today.
| Asset | Price | Change | %Move | Why It Moved |
|---|---|---|---|---|
| Gold | $4,507.75/oz | -$34.75 | -0.76% | Iran diplomatic progress reduced safe-haven demand; risk-on rotation weighed on precious metals complex |
| Silver | $75.828/oz | -$0.903 | -1.18% | Followed gold lower; precious metals complex under pressure in risk-on session; industrial silver demand tepid |
| Copper | $6.3857/lb | +$0.0918 | +1.46% | Industrial metals diverged positively from precious metals; growth optimism and Iran easing supported cyclical demand outlook |
| Platinum | $1,932.20/oz | -$45.20 | -2.29% | Underperformed the metals complex; automotive-catalytic demand uncertainty weighed; precious metal headwinds compounded the decline |
| Bitcoin | $75,962.0 | -$1,746.00 | -2.25% | Retreated as risk-on equity rally captured attention; marginal dollar strength weighed; tracking equities inversely today |
ENERGY
WTI closed near flat (+$0.02) after surging intraday to $99.41 on Iran deal headlines, then reversing as skepticism about a formal agreement emerged. Brent’s +0.75% outperformance widened the WTI-Brent spread — a regional supply premium persisting in global crude markets. Natural gas fell -3.31% on Memorial Day weekend weather moderation — entirely disconnected from crude’s geopolitical driver. Rising oil alongside rising equities reads as a demand story, not a supply shock; the intraday reversal confirmed this is headline-driven volatility, not structural repricing.
| Asset | Price | Change | %Move | Why It Moved |
|---|---|---|---|---|
| Crude Oil (WTI) | $96.37/bbl | +$0.02 | +0.02% | Near-flat close after intraday surge to $99.41 on Iran deal headlines; gave back gains as skepticism about a formal deal emerged |
| Crude Oil (Brent) | $103.35/bbl | +$0.77 | +0.75% | Geopolitical premium sustained Brent above WTI; Middle East risk not fully resolved; intraday high of $106.36 retreated on deal skepticism |
| Natural Gas (Henry Hub) | $2.918/MMBtu | -$0.100 | -3.31% | Memorial Day weekend weather moderation forecast; milder temperatures reduce cooling demand through early June; seasonal demand story |
| Natural Gas (Dutch TTF) | $16.55/MMBtu | -$0.28 | -1.64% | European gas fell on demand moderation; Iran deal skepticism limited LNG substitution expectations; followed Henry Hub lower |
S&P 500 SECTORS
Today’s leadership is a sharp contrast to the month’s winners: Industrials (+0.76%) and Healthcare (+0.66%) led on a day when Technology — up +11.72% in a month — consolidated to second place (+0.69%). Healthcare’s single-day leadership stands out against its structural weakness: -4.84% over three months and -2.36% YTD, making today’s bounce tactical (MRK-driven) rather than a sector-wide rotation. Communication Services (-0.55% today, -1.41% 1-week) is the month’s star (+4.04%) unraveling at the weekly horizon — a rotation signal worth watching.
| Sector | 1-Day | 1-Week | 1-Month | 3-Month | 6-Month | YTD | 12-Month |
|---|---|---|---|---|---|---|---|
| Industrials | +0.76% | +0.78% | -0.97% | -0.41% | +18.31% | +13.39% | +27.21% |
| Technology | +0.69% | +1.85% | +11.72% | +23.10% | +21.41% | +19.72% | +48.87% |
| Healthcare | +0.66% | +2.89% | +1.71% | -4.84% | -0.24% | -2.36% | +15.72% |
| Utilities | +0.56% | +3.17% | -2.87% | -2.85% | +3.96% | +6.94% | +15.83% |
| Consumer Cyclical | +0.13% | +1.66% | +1.40% | +3.51% | +4.20% | -0.95% | +10.74% |
| Basic Materials | +0.06% | -0.11% | -2.44% | -7.20% | +24.82% | +13.91% | +44.65% |
| Energy | +0.05% | -0.14% | +2.48% | +10.04% | +32.18% | +32.88% | +46.49% |
| Real Estate | +0.03% | +2.76% | +0.97% | +1.58% | +8.62% | +8.68% | +9.76% |
| Financial | 0.00% | +1.89% | +1.13% | +1.95% | +4.90% | -2.05% | +11.56% |
| Consumer Defensive | -0.22% | -1.24% | +0.34% | -4.50% | +11.81% | +8.98% | +6.05% |
| Communication Services | -0.55% | -1.41% | +4.04% | +9.79% | +12.32% | +6.44% | +36.49% |
TOP MEGA-CAP MOVERS:
GAINERS
| Company | Ticker | Close | Change | Why It Moved |
|---|---|---|---|---|
| Qualcomm | QCOM | $238.16 | +11.60% | Expanded multi-year automotive chip deal with Stellantis; Snapdragon Digital Chassis and Ride Pilot platforms across millions of vehicles; Melius Research raised PT to $220 |
| Merck & Co | MRK | $122.41 | +5.64% | Positive Phase III data for sacituzumab tirumotecan + Keytruda combination in non-small cell lung cancer; Q1 earnings beat with raised full-year guidance |
| Advanced Micro Devices | AMD | $467.51 | +3.99% | Semiconductor sector momentum; QCOM-Stellantis deal boosted automotive/industrial chip sentiment broadly; AI data center demand tailwinds |
| Texas Instruments | TXN | $309.21 | +3.63% | Direct automotive/industrial chip read-through from QCOM-Stellantis deal; TXN is a major supplier to the automotive sector |
| Palo Alto Networks | PANW | $260.58 | +3.03% | Cybersecurity sector recovery; tech-adjacent names rallied on Memorial Day risk-on tone; broad tech positive session |
DECLINERS
| Company | Ticker | Close | Change | Why It Moved |
|---|---|---|---|---|
| Sandisk Corp | SNDK | $1,478.69 | -4.12% | Profit-taking after 535%+ YTD surge; stock pulled back from near 52-week high; no specific negative catalyst; normal high-momentum drawdown |
| Costco Wholesale | COST | $1,028.24 | -2.11% | Consumer Defensive sector lagged in risk-on session; pullback from May 19 all-time high of $1,094.32; sector rotation away from defensives |
| NVIDIA Corp | NVDA | $215.33 | -1.90% | Post-earnings sell-the-news decline following Q1 results (reported May 21); strong results priced in; contrasts with sector peers QCOM and AMD surging |
— Institutional-grade intelligence for serious investors. Apply for membership at join.recessionalert.comC. HIGH-IMPACT STORIES -> TOP
UNCERTAIN
1. Iran Demands to Keep Enriched Uranium as US-Iran Deal Talks Stall — Hormuz Toll Dispute Clouds Ceasefire Framework; Oil Rebounds After Three-Day Slide
The core facts:Active US-Iran nuclear ceasefire negotiations hit a new stumbling block on May 22 as Iran’s Supreme Leader signaled that Tehran intends to retain its stockpile of highly enriched uranium within the country — directly rejecting a central US demand to remove the material abroad (including to US custody). Separately, the Trump administration issued a firm warning against a joint Iran-Oman proposal to establish a formal maritime transit toll system over the Strait of Hormuz. Secretary of State Marco Rubio stated that any peace deal would be “unfeasible” if Iran sought permanent toll control over the chokepoint. Brent crude rebounded to trade above $105 after a three-session decline, with WTI near $98 per barrel. The IEA warned this week that global oil markets are on track to enter a “red zone” supply deficit by July–August if the Hormuz blockade is not resolved, even as OPEC+ agreed in early May to raise July quotas by 188,000 bpd to partially offset Gulf supply losses. The Dow Jones hit a new all-time record close of 50,579.70 on the session, reflecting investor optimism that a framework deal remains achievable despite the new snags.
Why it matters:The uranium-retention demand is the most significant negotiating obstacle to emerge since ceasefire talks began. US administrations have historically required physical removal of enriched stockpiles as a non-negotiable condition — keeping the material within Iran under domestic custody leaves the breakout timeline largely intact and eliminates the primary verification mechanism. For energy markets, the Hormuz toll dispute adds a secondary friction point: even if an enrichment deal is reached, Iran and Oman’s toll proposal could create a permanent economic lever over global shipping that the US views as strategically unacceptable. The practical market implication is bifurcated: equities are pricing a deal (Dow all-time high), while oil is pricing persistent supply risk (Brent above $105 despite a three-day prior decline). The IEA’s “red zone” July–August supply deficit forecast creates a hard deadline — if no resolution before peak summer travel demand, the oil market faces a structural inventory drawdown that would push Brent materially above current levels, accelerating inflation transmission already visible in PMI input prices and WMT’s fuel-cost guidance.
What to watch:Whether the US accepts any modified uranium framework short of physical removal; formal Hormuz toll proposal language and US/allied shipping-nation response; Brent crude vs. the $110 level as the equity-market pain threshold where energy cost transmission forces S&P 500 earnings estimate cuts.
UNCERTAIN
2. Kevin Warsh Sworn In as Federal Reserve Chair at White House Ceremony — Begins Tenure With Inflation at Three-Year Highs and Trump Demanding Rate Cuts
The core facts:Kevin Warsh was sworn in as Chairman of the Federal Reserve Board of Governors at a White House East Room ceremony on May 22, 2026, succeeding Jerome Powell. Supreme Court Justice Clarence Thomas administered the oath with President Trump in attendance. The FOMC subsequently voted unanimously to elect Warsh as its chair. The Senate confirmed Warsh 54-45 on May 13 — the narrowest confirmation margin for a Fed Chair in the modern era. Trump publicly stated he wants Warsh to remain “totally independent” from the administration. Warsh steps into the role at a moment of acute policy stress: US inflation is running at a three-year high, mortgage rates are at nine-month highs, and the ongoing Iran war has generated the largest oil supply disruption in decades. Markets broadly view Warsh as more inflation-hawkish than Powell — a posture that directly conflicts with Trump’s repeated demands for lower interest rates.
Why it matters:The Fed Chair transition is the single most important institutional event in US monetary policy since the Powell-Yellen handover in 2018. Warsh’s first FOMC meeting as Chair is the June 16–17 session — where he will inherit: (1) an April FOMC minutes record showing “many” officials called for removing the easing bias and a majority supported rate hikes if inflation persists; (2) today’s Waller statement explicitly dropping the easing bias and calling rate cut talk “crazy”; (3) the May UMich survey showing inflation expectations at a 74-year record low for consumer confidence and 5-year inflation expectations at 3.9%. The key question Warsh must answer at June is whether he endorses Waller’s hawkish pivot or attempts to navigate the political pressure from Trump — who has made clear that rate cuts are a policy priority and who appointed Warsh specifically. His first post-swearing-in public statement will be scrutinized for any signal on his June stance. The narrowness of his confirmation (54-45) and Trump’s explicit public expectations create an unprecedented political overhang on Fed independence that fixed-income markets are only beginning to price.
What to watch:Warsh’s first public statement or speech as Chair for any signal on the June FOMC direction; CME FedWatch rate-hike probability shifts; June 16–17 FOMC statement language on easing bias removal as the definitive test of Warsh’s policy direction.
BEARISH
3. Fed Governor Waller Drops Easing Bias — “Inflation Not Headed Right Direction”; Markets Price 2-in-3 Chance of October Rate Hike
The core facts:Federal Reserve Governor Christopher Waller stated on May 22 in remarks prepared for an economic forum in Germany that he supports removing the “easing bias” from the Fed’s policy statement and that interest rate cuts should no longer be viewed as the most likely next policy move. “Inflation is not headed in the right direction,” Waller said, adding that rate-cut talk is now “crazy” given the inflation trajectory. Waller stopped short of explicitly advocating an immediate rate hike, but said the Fed must at minimum hold policy rates in place until inflation shows clear signs of returning toward the 2% target. Markets reacted swiftly: rate futures shifted to price approximately a two-in-three probability of a 25-basis-point rate hike by the October 2026 FOMC meeting — moved forward from the prior December 2026 pricing. Two-year Treasury yields surged to their highest levels since February 2025.
Why it matters:Waller’s statement is not a peripheral voice — he is a Fed Governor (permanent voting member) whose views on rate policy carry institutional weight. Delivered on the day of Warsh’s swearing-in, the statement effectively sets the hawkish framing that the new Chair inherits on day one. Three direct market transmissions: (1) The 2Y yield surge is the fastest re-pricing of near-term Fed expectations since the April FOMC minutes (released May 20) showed four dissenting votes and “many” officials calling for an easing-bias removal. Together, Waller’s statement plus those minutes constitute the most hawkish sequential signal from the Fed in three years; (2) Rate-sensitive sectors — utilities, REITs, homebuilders, regional banks — face direct valuation compression as the cost-of-capital floor rises. Homebuilder equities are particularly exposed: 30-year mortgage rates are already at nine-month highs, and an October hike would extend housing affordability pressure into 2027; (3) For equity portfolios broadly, the shift from “easing bias” to “neutral/tightening bias” removes the primary valuation support mechanism that has justified elevated equity multiples since 2024 — a structural repricing risk that is not yet fully reflected in S&P 500 forward P/E ratios. PCE running at 3.8% (noted in phase2 context) with Polymarket Fed hike odds now at ~43% and rising confirms the market is beginning to internalize the new regime.
What to watch:CME FedWatch October 2026 hike probability for whether the 2-in-3 probability firms or fades; 10Y Treasury yield for a breach above 4.75% as the equity-market stress threshold; Warsh’s first public statement as Chair for endorsement or qualification of Waller’s hawkish framing.
BEARISH
4. Michigan Consumer Sentiment Hits All-Time Record Low 44.8 — 5-Year Inflation Expectations Surge to 3.9%; Inflation Anchor Stress at Historic Extreme
The core facts:The University of Michigan’s final May 2026 Consumer Sentiment Index printed at 44.8 — an all-time record low since the survey began in 1952, well below the 48.2 preliminary estimate and consensus. Both sub-indices set records: Current Economic Conditions fell to 45.8 (lowest ever, -12.8% month-over-month, -22.2% year-over-year) and Consumer Expectations fell to 44.1 (lowest ever, -8.3% MoM). Year-ahead inflation expectations rose to 4.8% (from 4.7%); five-year inflation expectations surged to 3.9% from 3.5% — well above the range where they hovered throughout 2024. Fifty-seven percent of consumers spontaneously cited high prices as eroding their personal finances, with lower-income households and those without college degrees posting the steepest declines. The primary driver is the energy and cost-of-living shock from the Iran-related oil disruption. Data coverage is in Section E.
Why it matters:A record-low sentiment print is significant in isolation, but its most important feature for markets today is the simultaneous inflation expectations de-anchoring. The 5-year inflation expectation at 3.9% — up 40 basis points in a single month — is precisely the threshold that pushes the Fed from “watch and wait” to “act.” The Fed’s inflation-fighting credibility rests on the public believing that long-run inflation will return to 2%; at 3.9%, that belief is visibly eroding. For the equity market, the dual compression of collapsing confidence and rising inflation expectations represents the worst of both worlds: consumption-driven earnings risk (spending pullback from sentiment collapse) plus cost-of-capital risk (inflation expectations driving rates higher). The divergence between record-low sentiment (44.8) and record-high equity index levels (Dow 50,579) is the widest since the 2022 inflation shock — a gap that historically closes through equity valuation compression rather than sentiment recovery. The market impact today was mixed: initial risk-off on the open, but equities recovered as the Dow hit a new record on Iran diplomacy optimism, masking the structural concern embedded in the data.
What to watch:5-year UMich inflation expectations for a move above 4.0% as the level historically associated with Fed emergency action; June 10 CPI for whether the expectation surge is validated by actual price data; Warsh’s first speech for any acknowledgment of the inflation expectations de-anchoring risk.
BULLISH
5. Qualcomm-Stellantis Expand Snapdragon Digital Chassis Partnership Across Millions of Next-Gen Vehicles; QCOM +11.6%, Automotive Chip Complex Surges
The core facts:Qualcomm and Stellantis announced an expanded multi-year technology partnership to integrate Qualcomm’s Snapdragon Digital Chassis — encompassing ADAS, cockpit, and connectivity platforms — across Stellantis’s next-generation vehicle architectures including Jeep, Ram, Peugeot, and Fiat. The deal also includes Snapdragon Ride Pilot, enabling Level 2+ hands-free automated driving across Stellantis’s global fleet. Additionally, the companies signed a non-binding letter of intent for Stellantis’s autonomous driving and simulation subsidiary aiMotive to join Qualcomm Technologies, subject to closing conditions. QCOM surged +11.6% on the announcement — its largest single-session gain in several months — with automotive chip peers also rallying sharply: AMD +4.0%, Texas Instruments +3.6%. Qualcomm’s automotive revenue now exceeds $5 billion annually.
Why it matters:The Stellantis deal is the most significant automotive semiconductor partnership announced in the current cycle and redefines Qualcomm’s competitive position in a market it has been aggressively targeting for three years. Three portfolio-level implications: (1) Qualcomm’s automotive revenue stream ($5B+ annually) is now poised to accelerate with a multi-brand, multi-million-vehicle commitment from the world’s fourth-largest automaker — providing a durable, long-cycle revenue anchor that offsets handset market cyclicality; (2) The Level 2+ autonomous driving expansion (Snapdragon Ride Pilot) places Qualcomm in direct competition with Mobileye (MBLY) and Nvidia (NVDA) in the ADAS segment — the highest-margin, fastest-growing subsegment of automotive semiconductors; (3) The aiMotive acquisition letter of intent brings in-house simulation and autonomous driving software capability, signaling Qualcomm’s intent to own the full stack from chip to algorithm — a value capture move that peers cannot replicate quickly. The sector read-through is uniformly bullish: TI (+3.6%) and AMD (+4.0%) benefited from the signal that OEM automotive chipset budgets are expanding meaningfully, not contracting as feared amid the EV demand deceleration narrative.
What to watch:aiMotive closing conditions and final LOI conversion; Mobileye (MBLY) and NVDA Drive competitive response; QCOM’s next investor update for automotive revenue guidance revision upward given the expanded Stellantis scope.
— Quantifying recession risk so you don’t have to guess. Apply for membership at join.recessionalert.comD. MODERATE-IMPACT STORIES -> TOP
BULLISH
6. Merck’s Keytruda Combination Wins Phase III in First-Line Lung Cancer; Company Raises Full-Year Revenue Guidance — MRK +4.5%
The core facts:Merck announced positive Phase III results on May 22 for sacituzumab tirumotecan (sac-TMT), an antibody-drug conjugate developed in partnership with Kelun Biotech, combined with Keytruda in first-line PD-L1-positive non-small cell lung cancer (NSCLC). The Phase III study (OptiTROP-Lung05) met its primary endpoint of progression-free survival at an interim analysis with a “statistically significant and clinically meaningful” improvement versus Keytruda alone. Merck also raised its full-year revenue guidance, citing oncology strength. MRK surged +4.5% on the session — its strongest single-day gain in several months — lifting the Healthcare sector to one of the day’s top performers despite the sector’s recent three-month underperformance.
Why it matters:The Phase III win in first-line NSCLC is strategically critical for Merck at a moment when Keytruda faces growing biosimilar and competitive pressures as its patent cliff approaches in 2028. NSCLC is the largest oncology market by revenue, and first-line PD-L1-positive treatment is the highest-volume indication — a win here directly addresses the pipeline gap concerns that have weighed on MRK’s valuation. The ADC (antibody-drug conjugate) combination strategy also validates Kelun Biotech as a credible development partner, with Merck expected to advance toward regulatory submission. Broader sector signals: (1) The ADC-plus-checkpoint-inhibitor combination approach is now validated in a major indication, benefiting peers with similar pipeline strategies (BMY, AZN); (2) The guidance raise signals that oncology revenues are tracking above consensus despite the macroeconomic headwinds visible in other sectors — Healthcare is partially decoupled from the tariff/consumer stress narrative; (3) For institutional portfolios, MRK functions as a defensive growth offset against the hawkish rate environment — a company with durable oncology cash flows that becomes relatively more attractive as risk premiums rise.
What to watch:Merck’s regulatory submission timeline for OptiTROP-Lung05 data; ASCO Annual Meeting (upcoming) for full data presentation and peer response; Keytruda biosimilar entry dynamics in 2028 and whether sac-TMT combinations provide durable revenue replacement.
BEARISH
7. Walmart C-Suite Shakeup Deepens — Sam’s Club COO and US Store Operations VP Depart Days After Guidance Miss; Execution Risk Compounds Macro Stress
The core facts:Walmart confirmed on May 22 the departure of two senior executives: Tom Ward, Chief Operating Officer of Sam’s Club, is retiring; and Cedric Clark, Executive Vice President of US Store Operations, is leaving the company. Both departures come under new CEO John Furner, who took the role in February 2026 — approximately four months into his tenure. The exits follow Walmart’s May 21 Q1 FY2027 earnings report in which the company posted a guidance miss citing tariff uncertainty and elevated fuel costs, and CEO Furner’s team issued a new consumer warning signal: for the first time since 2022, budget-conscious consumers are purchasing fewer than 10 gallons of gas per visit at Walmart fuel stations. Separately, Walmart executives indicated the company is preparing to redeploy upcoming tariff refunds into direct retail price cuts to alleviate pressure on lower-income households.
Why it matters:The simultaneous departure of two senior operational leaders — one overseeing Walmart’s fastest-growing business unit (Sam’s Club) and one overseeing all US store operations — creates execution risk at precisely the moment WMT needs organizational stability to navigate the tariff-and-fuel headwinds identified in yesterday’s guidance miss. The sequential signal from Walmart over two days is now deeply bearish: guidance miss → C-suite departures → fuel behavior data (sub-10 gallon fills for the first time since 2022). The fuel data point is particularly significant: it captures a behavioral shift in how lower-income households manage purchasing power at the margin — a signal that real consumer stress has moved beyond survey data into observable behavioral change at the checkout. For the sector, the combination of WMT’s operational disruption and the ongoing consumer strain further depresses the outlook for Consumer Staples and broadens the sector rotation risk away from defensive equities that had been benefiting from the May equity recovery.
What to watch:Replacement announcements for Ward and Clark — the speed and seniority of successors will signal whether this is a managed transition or a more disruptive leadership break; WMT Q2 revenue vs. the $185.4B guidance midpoint as the definitive execution test for Furner’s team under the new structure.
UNCERTAIN
8. Google Files Antitrust Appeal — Challenges “Search Monopoly” Ruling and Proposed Remedies at DC Circuit; GOOG -1.07%
The core facts:Alphabet filed an appeal on May 22 with the US Court of Appeals for the DC Circuit challenging Judge Amit Mehta’s 2024 landmark ruling that found Google illegally maintained a monopoly in the online search and search advertising markets. Google’s appeal argues that Mehta misapplied antitrust law, that Apple chose Google as the default search engine “fair and square” (not under duress), and that the proposed behavioral remedies — including data-sharing requirements and syndication of search results to competitors — overstep the court’s authority. GOOG fell -1.07% on the session. The DC Circuit appeal will likely take 18–24 months to resolve, extending the cloud over Alphabet’s core search business into 2028.
Why it matters:The appeal prolongs regulatory uncertainty over the most profitable segment of Alphabet’s business — Google Search generates approximately 57% of Alphabet’s total revenues. Two dimensions matter for institutional investors: (1) The data-sharing remedy, if upheld, would structurally weaken Google’s search moat by forcing it to provide competitors with the behavioral data that trains its ranking algorithms — a permanent competitive disadvantage that could not be remedied even if Google later won on appeal; (2) The Apple default-payment model ($20B+ annually estimated) is the specific revenue arrangement at risk — if the DC Circuit upholds Mehta’s ruling that the Apple deal was anti-competitive, the remedies could prohibit or materially restructure this relationship, removing a guaranteed default-search revenue stream. The broader tech sector implication: the duration of this litigation ensures that the DOJ Big Tech antitrust agenda remains a structural overhang on GOOG, META, and AAPL valuations through Warsh’s first two years as Fed Chair — a period already complicated by the inflation/rate environment.
What to watch:DC Circuit briefing schedule and any preliminary indication of appetite for expedited review; any DOJ counter-filing on remedies; Apple’s own litigation posture and whether it files an amicus brief defending the default deal as a legitimate commercial arrangement.
UNCERTAIN
9. Conference Board Leading Index Surprises With +0.1% Beat in April — First Positive Monthly Reading Since November 2025; 6-Month Trend Remains Negative
The core facts:The Conference Board Leading Economic Index (LEI) for April 2026 rose +0.1% month-over-month versus expectations of -0.2%, reversing part of March’s -0.6% decline and posting its first positive monthly reading since November 2025. The beat was driven primarily by equity prices and building permits. However, the six-month trend in the LEI remains negative at approximately -0.7%, and the Conference Board’s full-year 2026 GDP growth projection is 1.7%. Data detail is in Section E.
Why it matters:The LEI’s positive surprise provides the first green shoot in forward-looking composite economic data since late 2025, and it matters precisely because it arrives on the same day as the record-low UMich sentiment reading and the hawkish Waller/Warsh compound signal. For equity bulls, the LEI beat is a data point supporting the soft-landing thesis: activity-based leading indicators are not collapsing even as sentiment surveys reach historic extremes. For the Fed, the LEI complicates the narrative — a positive surprise in a composite measure driven by building permits and equities does not contradict Waller’s inflation-first framework, but it does reduce the urgency of the “emergency hike” scenario. The six-month trend remaining negative at -0.7% keeps recession risk on the table; the one-month positive reading is insufficient to declare a trend reversal. The Conference Board’s 1.7% GDP projection for 2026, combined with Atlanta Fed GDPNow at 4.3% for Q2 and sentiment at all-time lows, illustrates the extreme divergence between real-time activity data and forward-looking survey data — a split that will take several more data releases to reconcile.
What to watch:May LEI reading (released late June) for trend confirmation; whether the 6-month LEI trend shifts from negative to positive as the definitive signal that economic leading conditions have genuinely stabilized.
UNCERTAIN
10. Atlanta Fed GDPNow Q2 2026 Upgraded to 4.3% SAAR — Real-Time Activity Diverges Sharply From Record-Low Consumer Sentiment
The core facts:The Atlanta Fed upgraded its GDPNow real-time Q2 2026 GDP growth estimate to 4.3% SAAR (seasonally adjusted annual rate), up from 4.0% on May 14. The upgrade was driven by stronger personal consumption expenditure tracking (+2.9%) and gross private investment (+11.4%). The model incorporates hard economic data released through mid-May and does not incorporate survey or sentiment data. Data detail is in Section E.
Why it matters:A 4.3% Q2 GDP tracking estimate — if realized — would represent one of the strongest quarterly growth readings of the current cycle, creating a stark paradox with today’s record-low consumer sentiment (44.8) and escalating inflation concerns. The portfolio implications of this divergence are significant: (1) For equity bulls, 4.3% real GDP growth supports robust corporate revenue growth that justifies current S&P 500 valuations — the soft-landing thesis gains its most credible quantitative support yet; (2) For the Fed, 4.3% Q2 growth eliminates the cyclical slack argument that would otherwise justify looking through inflation — a strong economy combined with de-anchoring inflation expectations provides the cleanest case for a rate hike since 2023; (3) The consumption (+2.9%) and investment (+11.4%) drivers suggest the energy shock has not yet transmitted into a broad spending slowdown, which contradicts the WMT fuel behavior signal and the UMich collapse. The discrepancy between GDPNow (hard data) and UMich (survey data) is now at an extreme, and historically these gaps close within one to two quarters — either activity slows toward the survey pessimism, or the sentiment rebound toward the activity strength. Given the direction of tariff, fuel, and rate headwinds, the former scenario is higher probability.
What to watch:Q2 GDP advance estimate (late July) for whether GDPNow’s 4.3% tracking materializes in official data; Atlanta Fed GDPNow updates in June as more Q2 data flows in; consumer spending monthly data for the first signs of the UMich survey pessimism transmitting into hard spending slowdown.
— Separating signal from noise since 2007. Apply for membership at join.recessionalert.comE. ECONOMY WATCH -> TOP
Today’s data crystallized a stagflation trap: Michigan Consumer Sentiment hit an all-time record low (44.8, vs. 48.2 expected), while 5-year inflation expectations spiked to 3.9% — signaling that Iran-war energy costs are simultaneously crushing confidence and de-anchoring long-run price expectations. The Conference Board LEI technically beat in April (+0.1% vs. −0.2% est.) but the 6-month growth rate remains negative, pointing to fragile underlying momentum. Kevin Warsh’s first day as Fed Chair arrived alongside Governor Waller signaling readiness to drop the easing bias and potentially hike — a stance corroborated by FOMC minutes described as the most hawkish in three years. The lone counterweight: GDPNow at 4.3% for Q2, keeping the soft-landing narrative alive — for now.
FOMC Minutes Signal Most Hawkish Fed Stance in Three Years, Four Officials Dissent (Federal Reserve, May 20, 2026)
What they’re saying:Minutes from the April/May FOMC meeting — the most hawkish in nearly three years — reveal that “many” officials called for dropping the easing bias from the Fed’s policy statement, with a majority warning that rate hikes would likely be necessary if inflation remains persistently above 2%. The meeting featured four dissenting votes, the most since 1992, as the FOMC held its benchmark rate at 3.5%–3.75% amid sharp internal disagreement over the policy path.
The context:The Iran conflict has reset the inflation calculus: soaring energy prices have pushed most inflation measures above 3%, forcing even previously dovish officials to reconsider the path. The four-way dissent is a rare show of internal fracture and signals that the consensus around “patient holding” is eroding. With PCE running at 3.8% and the easing bias still formally in place, the minutes effectively pre-announced a hawkish pivot that Governor Waller confirmed verbally this morning.
What to watch:Fed communications over the next 30 days for formal removal of easing bias language; June FOMC meeting as the next decision point; Fed Logan (Wed May 27), Cook (Wed May 27), and Jefferson (Wed May 27) speeches for confirmation of hawkish alignment.
Fed’s Waller Signals Readiness to Drop Easing Bias, Cannot Rule Out Rate Hike (Federal Reserve, May 22, 2026)
What they’re saying:Governor Christopher Waller, speaking in Germany on Friday, said he would support removing the “easing bias” language from the Fed’s policy statement, stating “a rate cut is no more likely in the future than a rate increase.” Waller said inflation — running at 3.8% on the PCE measure in April and broadening across goods and services — is “not headed in the right direction,” and he cannot rule out voting for a rate hike if inflation fails to slow. He stopped short of advocating an imminent hike, calling for patience while the Iran war’s impact becomes clearer.
The context:This marks a significant hawkish shift for Waller, who had previously been among the more dovish members of the Board of Governors. His remarks align with the FOMC minutes released Wednesday and underscore that the rate-cut cycle is effectively dead for 2026. Polymarket’s Fed hike odds jumped 9 percentage points over the past 24 hours to 43%, reflecting the market’s rapid repricing of the rate path. The statement on the day Warsh takes the chair also sets a hawkish baseline for the new leadership regime.
What to watch:April Core PCE (Thu May 28, exp. +0.3% MoM) — the next hard inflation data point; June FOMC meeting as the first decision under Chair Warsh; whether the formal easing bias removal appears in the next policy statement.
Kevin Warsh Sworn In as Federal Reserve Chair at Pivotal Moment for Monetary Policy (White House, May 22, 2026)
What they’re saying:Kevin Warsh was sworn in Friday at the White House as the 17th Chairman of the Federal Reserve, succeeding Jerome Powell. The ceremony — attended by Treasury Secretary Bessent and NEC Director Hassett — capped a 54-45 Senate confirmation on May 13, the narrowest in the modern era. Warsh inherits a Fed grappling with all-time-low consumer sentiment, surging war-driven inflation, and internal policy division. He faces immediate pressure on both rate policy and institutional credibility.
The context:Warsh, a former Fed Governor, is viewed by markets as inflation-hawkish. His inaugural day coincided with Waller’s hawkish speech and the release of record-low consumer sentiment data — a baptism of fire that immediately tests his capacity to balance political pressure (the White House has historically pushed for lower rates) with price stability. The narrow Senate margin signals ongoing political sensitivity around the Fed’s independence. Markets will scrutinize Warsh’s first public statements and June FOMC presser for signals on the new leadership’s rate posture.
What to watch:Warsh’s first public remarks as Chair; June FOMC meeting and press conference; whether the new Chair formally endorses or resists removing the easing bias at the next meeting.
Michigan Consumer Sentiment Hits All-Time Record Low; Inflation Expectations Surge to Post-COVID Highs (University of Michigan, May 22, 2026)
What they’re saying:The University of Michigan’s final May Consumer Sentiment Index fell to 44.8 — a 3.4-point miss vs. the 48.2 consensus and below the preliminary reading — marking the lowest level recorded since the survey began in 1952, worse than readings during the 1970s oil crisis, the Great Recession, and COVID. Simultaneously, 1-year inflation expectations rose to 4.8% (vs. 4.5% expected, prior 4.7%) and 5-year expectations jumped to 3.9% (vs. 3.4% expected, prior 3.4%) — the sharpest long-run spike in the survey’s recent history. Some 57% of consumers spontaneously cited high prices as eroding their personal finances, up from 50% in April.
The context:The Iran conflict and resulting oil price shock are the proximate cause, but the breadth of the decline across income levels, party affiliation, and education signals that confidence erosion is not confined to any demographic cohort. The 5-year inflation expectations surge to 3.9% is the most alarming element for the Fed: long-run de-anchoring of inflation expectations is the scenario policymakers fear most, as it validates more aggressive tightening. The combination — collapsing sentiment alongside surging expectations — is a textbook stagflationary signal that simultaneously depresses consumption and constrains the Fed’s ability to provide relief.
What to watch:June University of Michigan preliminary reading (mid-June) for trend confirmation; April Core PCE (Thu May 28) as the hard inflation counterpart; CB Consumer Confidence (Tue May 26, prior 92.8) for cross-validation; retail sales data for behavioral follow-through on sentiment deterioration.
Conference Board Leading Index Surprises to Upside in April but Six-Month Trend Stays Negative (Conference Board, May 22, 2026)
What they’re saying:The Conference Board’s Leading Economic Index rose 0.1% in April to 97.4 (2016=100), beating the consensus expectation of −0.2% and partially reversing March’s 0.6% decline. The upside surprise was driven mainly by rebounding stock prices and stronger building permits. The Conference Board projects 1.7% year-over-year GDP growth for 2026, citing AI infrastructure investment and energy capex as partial offsets to consumer-side weakness.
The context:The monthly beat should not be over-read: the six-month growth rate over October 2025 to April 2026 remains negative at −0.7%, and the LEI has fallen in two of the past three months. The Conference Board flags that higher energy costs and weak hiring will likely erode household purchasing power even as AI and data-center investment sustains business spending. The index’s signal is consistent with below-trend growth rather than expansion, and the April rebound does not materially change the near-term outlook.
What to watch:May LEI (released ~Jun 19) for confirmation of trend reversal; GDP 2nd estimate for Q1 (Thu May 28, exp. +2.0%) as the hard growth anchor; Chicago Fed CFNAI (Tue May 26) for a concurrent read on activity breadth.
Atlanta Fed GDPNow Lifts Q2 2026 Estimate to 4.3%, Driven by Investment Surge (Atlanta Fed, May 21, 2026)
What they’re saying:The Atlanta Fed’s GDPNow model raised its Q2 2026 real GDP growth estimate to 4.3% (SAAR) on May 21, up from 4.0% on May 14. The upgrade was driven by stronger-than-expected nowcasts for personal consumption expenditures (now tracking +2.9% vs. +2.7% prior) and gross private domestic investment (+11.4% vs. +10.2% prior). The next GDPNow update is Thursday, May 28.
The context:The 4.3% GDPNow reading stands in sharp contrast to the record-low consumer sentiment reported today, creating a notable tension between survey-based and activity-based measures of economic health. Investment in AI infrastructure, data centers, and energy production appears to be generating a significant portion of the Q2 tracking estimate, while the consumer component — though upgraded — faces headwinds from the Iran-driven energy shock and eroding purchasing power. GDPNow has historically been more volatile early in a quarter and may be revised materially as Q2 data accumulates through June.
What to watch:Next GDPNow update (Thu May 28) after the GDP 2nd estimate and Durable Goods releases; Q1 GDP 2nd estimate (Thu May 28, exp. +2.0% SAAR) as the backward-looking anchor; ADP Employment (Wed May 27) for labor input into Q2 consumption tracking.
— Know the probability before the market prices in the risk. Apply for membership at join.recessionalert.comF. EARNINGS WATCH -> TOP
YESTERDAY AFTER THE BELL (Markets Reacted Today)
No major earnings yesterday after the bell from companies with >$100B market cap.
TODAY BEFORE THE BELL (Markets Already Reacted)
No major earnings before the bell from companies with >$100B market cap. (BJ’s Wholesale Club, the sole Friday BMO reporter, has a $11.1B market cap — below the $100B threshold.)
TODAY AFTER THE BELL (Markets React Tomorrow)
No major earnings after the bell from companies with >$100B market cap.
WEEK AHEAD PREVIEW:
Q1 2026 earnings season is functionally complete (~92% of S&P 500 reported). US markets are closed Monday, May 25 (Memorial Day) — four-session trading week. The focus shifts to three mega-cap technology names reporting Wednesday, May 27 after market close.
Marvell Technology (MRVL) — AMC Wednesday, May 27 — Key focus: custom AI XPU (accelerator) demand from hyperscaler clients (Google, Amazon, Microsoft); validation of NVIDIA’s $2B strategic investment and NVLink Fusion partnership economics; 800G/1.6T optical transceiver ramp cadence; Q1 FY2027 revenue guidance vs. ~$2B consensus. MRVL is the primary custom AI silicon beneficiary after NVDA and AMD — its results will be read as a forward demand indicator for the entire AI infrastructure buildout.
Salesforce (CRM) — AMC Wednesday, May 27 — Key focus: Agentforce AI platform adoption metrics and enterprise deal count; Q2 revenue guidance vs. consensus; enterprise software spending durability amid macro uncertainty; any AI monetization timeline update. CRM is the bellwether for enterprise software demand and the first major SaaS company to report Q1 following the tariff/macro disruption.
Synopsys (SNPS) — AMC Wednesday, May 27 — Key focus: Ansys ($35B acquisition) integration progress and “Silicon-to-Systems” revenue synergy realization; EDA software demand from advanced-node semiconductor clients; near-term profitability outlook amid integration-year cost structure; $9.61B full-year revenue guidance confirmation.
Beyond Wednesday, no other companies with >$100B US market cap are confirmed for the May 26–29 window. Q2 2026 earnings season begins mid-July.
— US market commentary trusted by family offices and institutions. Apply for membership at join.recessionalert.comG. WHAT’S NEXT -> TOP
UPCOMING RELEASES:
| Date | Event | Why It Matters |
|---|---|---|
| Tue, May 26 | Chicago Fed National Activity Index (prior: -0.20) | Concurrent activity breadth gauge; a second consecutive negative reading would confirm below-trend growth despite GDPNow’s 4.3% Q2 tracking — the key question is whether hard activity data is beginning to reflect the Iran-driven headwinds visible in sentiment surveys. |
| Tue, May 26 | CB Consumer Confidence (prior: 92.8) | First post-UMich all-time-low cross-validation: if CB Confidence accelerates the sentiment collapse, it confirms breadth of consumer pessimism beyond the Michigan survey cohort and raises the probability that spending slowdown will transmit into Q2 consumption data; a stabilization would support the soft-landing divergence thesis. |
| Tue, May 26 | Dallas Fed Manufacturing Index (prior: -2.3) | Regional manufacturing barometer for the energy-exposed Texas economy; a further deterioration would signal the Iran-driven energy cost shock is compressing industrial margins even in production-side, energy-producing regions — a bearish divergence from the sector’s equity performance. |
| Wed, May 27 | ADP Employment Change (prior: 42.25K) | Private payroll early read ahead of the June jobs report; a soft print would complicate Waller’s hawkish framing by introducing labor market softness into the inflation calculus — the Fed cannot easily hike into a deteriorating jobs market; a strong print removes the final cyclical argument against June tightening. |
| Wed, May 27 | Fed Speeches: Logan, Cook, Jefferson | Three Board-level voices on the same day Waller’s hawkish framing and Warsh’s swearing-in have reset the policy baseline; market will parse these for alignment with or resistance to easing-bias removal and October hike pricing — any dovish dissent from this trio would create confusion about June FOMC direction and compress 2Y yields. |
| Thu, May 28 | Core PCE Price Index MoM — Apr (expected: +0.3%) | The Fed’s preferred inflation gauge and the single most market-moving data point of the week: a +0.3% or above print alongside UMich 5-year expectations at 3.9% constitutes the clearest case for the June FOMC to formally drop the easing bias and signal a rate hike path; a surprise +0.4% would likely push the 10-year above 4.75% and force an immediate repricing of rate-sensitive equities. |
| Thu, May 28 | GDP Growth Rate Q1 2nd Estimate (expected: +2.0% SAAR) | Backward-looking anchor for the growth vs. inflation tradeoff: a downward revision below +2.0% would signal Q1 was weaker than thought and provide the cyclical cushion that could moderate Waller’s hike urgency; an upward revision reinforces the strong-economy + rising-inflation combination that is the cleanest justification for a rate hike since 2023. |
| Thu, May 28 | Durable Goods Orders MoM — Apr | Forward-looking investment gauge that will test whether GDPNow’s +11.4% gross private investment tracking is grounded in hard order data; a strong print supports the soft-landing/growth case; a miss would suggest the investment surge is AI and energy capex concentrated, not broad-based — relevant for industrial and manufacturing sector positioning. |
| Thu, May 28 | Initial Jobless Claims (week ending May 23) | Weekly labor market pulse; claims trending above 240K would signal labor market softening beginning to emerge alongside the energy shock — a Fed-constraining data point that complicates the hawkish consensus forming around Waller’s easing-bias removal. |
| Thu, May 28 | Building Permits Final — Apr (expected: 1.442M) | Housing activity gauge particularly sensitive to the rate environment; 30-year mortgage rates at nine-month highs make any deterioration in permits a leading indicator of housing sector stress — rate-sensitive sector where Warsh’s hawkish posture has the most immediate transmission impact. |
KEY QUESTIONS:
1. Does Thursday’s Core PCE (exp. +0.3% MoM) confirm the inflation de-anchoring signaled by UMich’s 5-year expectations surging to 3.9% — and at what level does the data compel the June FOMC to formally drop the easing bias and begin pricing a hike, pushing the 10-year above 4.75%?
2. Will Warsh’s first public statement as Chair endorse Waller’s hawkish framing or create political space under White House pressure — and does the resolution of that question begin to close the equity-bond paradox between Dow all-time highs and an October rate hike being priced at two-in-three odds?
3. Do the US-Iran uranium retention demand and Hormuz toll dispute prove to be negotiating postures or hard red lines — and at what Brent crude price level does sustained energy cost pressure begin forcing S&P 500 forward earnings estimate cuts, closing the gap between bond market caution and equity market complacency?
— US market commentary trusted by family offices and institutions. Apply for membership at join.recessionalert.comH. CHART OF THE DAY -> TOP
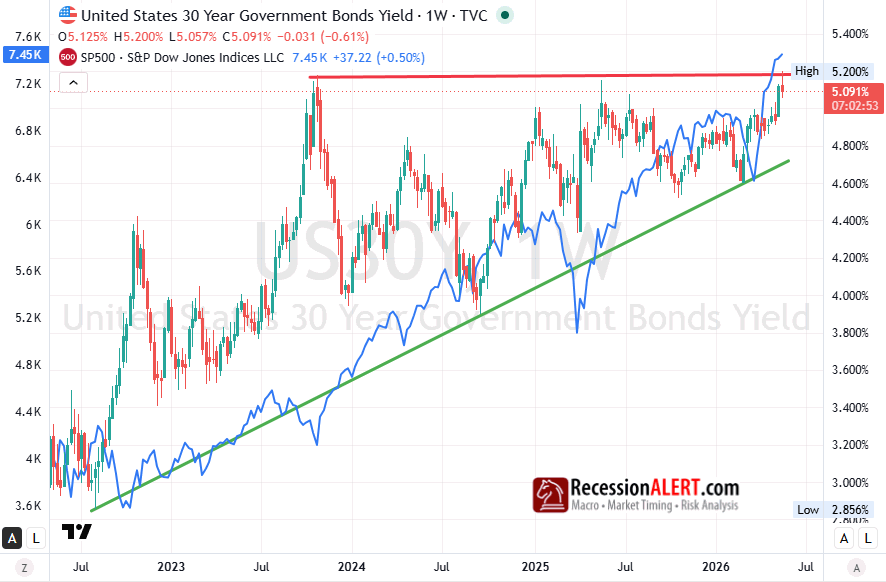
Three times in three years the 30-year Treasury yield has climbed to roughly 5.20% — and conventional wiring says that retest of a multi-decade ceiling should crush equity multiples. It hasn’t. The S&P 500 prints records near 7,450 while the long bond presses the same line that capped it in late 2023, and the reason is what the candlesticks won’t show. This is not the Fed tightening into a slowdown; it is term premium repricing — the hottest CPI in three years, an Iran oil shock, and swelling Treasury supply against persistent deficits. A bear steepener carries no recession signal, so earnings outrun the discount-rate drag and stocks pay the tax. But households cannot. The 30-year yield is the benchmark the 30-year mortgage is priced against — already near 6.36%, having retraced only partway from 8% — and the housing recovery rests on that retrace holding. A weekly close above 5.20% stops being a bond-desk story: it resets the cost of permanent capital, and reaches mortgages, auto loans, and credit-card APRs first. Households pay the spread.
Market Intelligence Brief (MIB) Ver. 18.33
For professional investors only. Not investment advice.
© 2026 RecessionALERT.com

Comments are closed.