
MARKET INTELLIGENCE BRIEF (MIB)
Wednesday, July 29, 2026
The Fed held at 3.50%-3.75% but three members dissented for a hike — the first three-way hawkish split since 2016 — and the Dow fell 2.18%, its worst day since April 2025. The 30-year hit a 19-year high at 5.21%. Iran struck a US base in Jordan and rejected Oman’s Hormuz plan; WTI jumped 6.74%. SK Hynix’s miss tipped the Nasdaq 100 into correction, erasing $1 trillion of global chip value. Caterpillar sank 6.91% on data-centre permitting risk.
TABLE OF CONTENTS
A. EXECUTIVE SUMMARY
B. MARKET DATA
C. HIGH-IMPACT STORIES (6)
D. MODERATE-IMPACT STORIES (7)
E. ECONOMY WATCH (5)
F. EARNINGS WATCH (12)
G. WHAT’S NEXT
H. CHART OF THE DAY
A. EXECUTIVE SUMMARY -> TOP
Equities sold off broadly after the FOMC held at 3.50%-3.75% but drew hawkish dissents from three regional presidents — the first unified three-way dissent since 2016 — with the Dow shedding 2.18% for its worst session since April 2025 and the VIX up 13.29% to 20.63. The instructive move was in the long end: the 30-year closed at a 19-year high of 5.21% while the 2-year fell, a bear steepener that prices inflation credibility rather than a higher policy path, and the dollar’s 0.47% decline on a day that offered every reason to bid it corroborates that read. Iran’s missile strike on a US base in Jordan and its rejection of Oman’s Hormuz plan sent WTI up 6.74%, hardening the hawkish bloc’s inflation case. Breadth was the tell: only Energy (+2.05%), Consumer Defensive (+0.35%) and Communication Services (+0.15%) closed higher, and with Industrials (-3.40%) leading the decline ahead of Technology (-2.49%) the damage was as much capex-sensitive as rate-sensitive.
• Fed holds a fifth straight meeting on a 9-3 vote — Logan, Hammack and Kashkari all dissent for a 25bp hike, and Warsh strips forward guidance out of the statement entirely. Polymarket’s 2026 hike probability fell 14 points to 63%, so the hold, not the dissent, drove the front end.
• 30-year Treasury yield closes at 5.21%, a 19-year high (+12bps), while the 2-year eases 0.6bps to 4.271% — a bear steepener. The dollar index fell 0.47% to 100.89 and gold rose 0.69% to $4,066.50/oz on the same session.
• Nasdaq 100 confirms a technical correction, closing 2.06% lower at 27,192.31 and more than 11% below its June peak, after SK Hynix missed despite record revenue and profit. KLA -10.80%, Micron -9.94%, Applied Materials -8.40%, AMD roughly -8%; over $1 trillion of global chip value has now been erased.
• Iran fires ballistic missiles at a US base in Jordan (all intercepted) and rejects Oman’s Hormuz management plan; Trump promises a “beating.” WTI +6.74% to $84.60 and Brent +7.36% to $88.12, with EIA crude stocks drawing 7.167 million barrels against 1.3 million expected and the SPR at a 43-year low of 307.7 million.
• June durable goods orders rose only 0.3% versus roughly 1.6% consensus, but core ex-transport gained 0.6% on the month and 11.0% year-over-year, the fastest since March 2022. Richmond Fed manufacturing ticked to 5 from 4, well short of the ~10 expected.
• Caterpillar fell 6.91% to $782.71 after Baird cut it to Neutral and slashed its target 25% to $900 on data-centre permitting risk, dragging Industrials to -3.40%. Separately, Republic National Distributing — the No. 2 US wine and spirits distributor — filed Chapter 11 with up to $10 billion of liabilities and more than 100,000 creditors.
1. The Fed Put Repriced, Not the Fed Path — Nothing changed in policy today, yet the entire forward distribution moved. Three simultaneous hawkish dissents plus a statement stripped of forward guidance means the market must now price a committee rather than a chair, and distributions are wider than medians. The front end barely moved while the long end broke to a 19-year high — confirmation that this is a credibility and term-premium repricing, not a rate-path repricing. Practically: the strike on the “Fed put” has moved lower, every data release becomes a live event rather than a confirmation, and the information content of Fed-speak between meetings has fallen. Raise the weighting on macro hedges and lower it on positioning built off guidance.
2. Stagflationary Inputs Without Growth Confirmation — Oil rallied 6.74% while equities fell 1.51%, which is a supply shock rather than a demand signal. Beneath the geopolitical headline the supply layer is more durable: commercial crude stocks at 2018 operating lows, an SPR at a 43-year low that removes Washington’s non-military lever, and OPEC+ reportedly freezing quota increases from October — all while OPEC cuts its 2026 demand growth forecast to 780,000 bpd. Rising input costs without growth confirmation is the worst combination for equity multiples: it lifts the discount rate (30-year at 5.21%) and compresses margins at the same time, and it hands the three dissenters their inflation argument ahead of Thursday’s Core PCE.
3. The Rotation Is Working — But Its Landing Spot Just Wobbled — The S&P has outpaced the Nasdaq 100 by more than 4% over ten sessions for a fifth consecutive session, and index-level resilience is being supplied entirely by breadth outside technology. That only holds while the non-tech complement holds. Today it did not: Industrials fell 3.40% because Baird attacked the data-centre power thesis at its foundation, arguing municipal siting risk makes the power-generation backlog a political variable rather than an engineering one. That is the same AI capex assumption de-rating semiconductors, arriving from the opposite direction — and the sell side has no consensus on it, upgrading Bloom Energy on the same day it cut Caterpillar 25%. The read-through covers turbine makers, electrical equipment, E&C and the utilities underwriting the load growth.
 — Leading economic indicators. Accurate market forecasts. Apply for membership at join.recessionalert.com
B. MARKET DATA -> TOP
Equities sold off sharply after the Fed held rates steady but three officials dissented in favor of a hike — the Dow fell 2.18%, Nasdaq 2.06%, and VIX spiked 13% as the bond market signaled the Fed may be falling behind on inflation. Energy was the lone gainer (+2.05%) as WTI and Brent both surged over 6% after the U.S. and Saudi Arabia struck Iran-backed groups in Iraq, while Industrials (-3.40%) and a battered semiconductor complex (KLAC, MU, AMAT, LRCX all down 6-11%) led the decline. The clearest anomaly: the dollar fell 0.47% even as stocks tumbled and the 10-year yield rose 8bps — hawkish repricing, not a classic flight to safety. Microsoft, Meta, and Qualcomm report after today’s close, colliding mega-cap earnings with the Fed’s inflation warning.
CLOSING PRICES – July 29, 2026:
MAJOR INDICES
All five major indices fell in lockstep today (-1.2% to -2.2%) after the Fed’s hawkish hold — a broad, non-narrow selloff with no meaningful Dow/DJIA-DJTA divergence (0.24% spread, below the 1.5% threshold). Dow Theory sits just short of a formal non-confirmation: DJIA is now ~2% off its 10-session high while DJTA sits nearly 6% below its own. The more entrenched signal: the S&P has outpaced the Nasdaq 100 by 4%+ over 10 sessions for a fifth straight session — a deeply embedded broadening-rotation pattern away from mega-cap tech.
| Index | Close | Change | %Move | Why It Moved |
|---|---|---|---|---|
| S&P 500 | 7,316.40 | -112.38 | -1.51% | Broad selloff after hawkish FOMC hold with 3 dissents favoring a hike |
| Dow Jones | 51,594.86 | -1152.46 | -2.18% | Hit hardest as CAT slid ~7% on a Baird downgrade, compounding Fed-driven selloff |
| DJ Transportation | 21,463.9 | -425.2 | -1.94% | Tracked the broad risk-off tone into the Fed decision |
| Nasdaq 100 | 27,192.31 | -570.83 | -2.06% | Semiconductor rout (KLAC, MU, AMAT, LRCX) weighed ahead of MSFT/META/QCOM earnings |
| Russell 2000 | 2,906.44 | -47.36 | -1.60% | Small-caps fell in line with the broad risk-off tone |
| NYSE Composite | 23,944.97 | -284.70 | -1.17% | Broadest measure showed the same risk-off tone, marginally less severe than cap-weighted indices |
VOLATILITY & TREASURIES
VIX’s 13% spike came alongside a genuinely hawkish signal — three FOMC dissents favoring a hike and a bond market pricing the Fed as behind on inflation — so this reads as inflation-fear repricing, not recession fear. The 10Y rose 8bps while the 2Y slipped slightly, steepening the curve on the long end. DXY’s 0.47% decline despite both the equity selloff and rising yields is the disconnect: a classic safe-haven dollar bid did not materialize.
| Instrument | Level | Change | Why It Moved |
|---|---|---|---|
| VIX | 20.63 | +2.42 (+13.29%) | Spiked as the bond market signaled the Fed may be falling behind on inflation |
| 10-Year Treasury Yield | 4.688% | +8.4 bps | Rose after the Fed’s hawkish hold and 3 dissents favoring a hike |
| 2-Year Treasury Yield | 4.271% | -0.6 bps | Roughly flat, holding steady into the decision |
| US Dollar Index (DXY) | 100.89 | -0.48 (-0.47%) | Fell despite the equity selloff and rising yields — no safe-haven bid materialized |
COMMODITIES
Gold and silver’s modest gains against copper’s decline is a clean safe-haven-vs-industrial-demand split, consistent with today’s broad equity selloff. Platinum sat out entirely, essentially flat. Bitcoin’s -0.51% tracked the risk-off tape rather than decoupling, reinforcing that today’s move is conventional de-risking rather than a crypto-specific catalyst.
| Asset | Price | Change | %Move | Why It Moved |
|---|---|---|---|---|
| Gold | $4,066.50/oz | $+27.80 | +0.69% | Modest safe-haven bid amid the equity selloff |
| Silver | $57.835/oz | $+0.306 | +0.53% | Tracked gold’s modest gain |
| Copper | $6.3483/lb | $-0.0112 | -0.18% | Slipped on industrial-demand concerns, diverging from precious metals |
| Platinum | $1,624.60/oz | $+1.30 | +0.08% | Essentially flat |
| Bitcoin | $63,594.0 | $-325.0 | -0.51% | Tracked the broader risk-off tape |
ENERGY
WTI and Brent surged in lockstep (+6.7%/+7.4%) after the U.S. and Saudi Arabia struck Iran-backed groups in Iraq and Iran threatened the Strait of Hormuz — a geopolitical supply shock, not a demand story. Henry Hub barely budged (+0.93%) while Dutch TTF spiked over 5%, underscoring a European-specific gas dynamic. Critically, oil rallied while equities sold off sharply — a stagflationary combination, not a risk-on energy trade.
| Asset | Price | Change | %Move | Why It Moved |
|---|---|---|---|---|
| Crude Oil (WTI) | $84.60/bbl | $+5.34 | +6.74% | Surged as U.S./Saudi strikes on Iran-backed groups in Iraq escalated Middle East tensions |
| Crude Oil (Brent) | $88.12/bbl | $+6.04 | +7.36% | Rallied with WTI on the same Middle East supply-risk escalation |
| Natural Gas (Henry Hub) | $2.726/MMBtu | $+0.025 | +0.93% | Muted move, decoupled from the crude rally |
| Natural Gas (Dutch TTF) | $20.28/MMBtu | $+1.01 | +5.24% | European gas spiked on a region-specific supply dynamic |
S&P 500 SECTORS
Energy was the lone gainer, extending its dominant YTD (+30.75%) and 12-month (+33.85%) leadership on today’s oil spike even as it lagged over the past week. Technology, this week’s and month’s worst performer, extended losses today despite still-positive longer horizons — a genuine pullback, not a trend reversal. Industrials confirmed as the persistent structural laggard, posting the day’s steepest decline (-3.40%) atop an already-negative month (-8.78%).
| Sector | 1-Day | 1-Week | 1-Month | 3-Month | 6-Month | YTD | 12-Month |
|---|---|---|---|---|---|---|---|
| Energy | +2.05% | -0.78% | +9.82% | -0.11% | +18.05% | +30.75% | +33.85% |
| Consumer Defensive | +0.35% | +3.67% | +2.86% | +2.86% | +4.08% | +10.96% | +9.80% |
| Communication Services | +0.15% | -1.21% | -1.48% | -5.45% | -4.03% | -2.24% | +15.15% |
| Real Estate | -0.26% | +1.63% | +2.00% | +5.14% | +10.55% | +13.33% | +10.50% |
| Healthcare | -0.52% | +3.49% | +1.92% | +13.54% | +5.17% | +7.23% | +22.66% |
| Consumer Cyclical | -0.99% | -3.36% | -4.19% | -5.90% | -11.03% | -8.51% | -4.04% |
| Basic Materials | -1.03% | -1.79% | -0.99% | -6.56% | -9.27% | +7.01% | +27.70% |
| Utilities | -1.70% | -3.26% | -3.49% | -5.52% | +0.48% | +4.03% | +9.15% |
| Financial | -1.74% | +0.05% | +4.03% | +9.09% | +6.02% | +5.89% | +12.85% |
| Technology | -2.49% | -7.19% | -7.80% | +2.35% | +8.53% | +11.02% | +19.17% |
| Industrials | -3.40% | -2.33% | -8.78% | -3.11% | +0.71% | +8.99% | +10.59% |
TOP MEGA-CAP MOVERS:
GAINERS
| Company | Ticker | Close | Change | Why It Moved |
|---|---|---|---|---|
| ExxonMobil Holdings Corp | XOM | $156.75 | +2.42% | Rallied with crude oil on the Middle East supply-risk surge |
| Chevron Corp | CVX | $191.86 | +2.28% | Tracked XOM higher on the oil price spike |
| Netflix Inc | NFLX | $73.63 | +1.71% | Held up amid the broader tech selloff |
| Walmart Inc | WMT | $114.22 | +0.99% | Defensive rotation amid broad equity weakness |
| Alphabet Inc | GOOG | $335.76 | +0.95% | Outperformed mega-cap tech peers amid the Nasdaq selloff |
DECLINERS
| Company | Ticker | Close | Change | Why It Moved |
|---|---|---|---|---|
| KLA Corp | KLAC | $170.19 | -10.80% | Fell despite beating EPS estimates and raising guidance Tuesday AH — sold off with the sector |
| Micron Technology Inc | MU | $739.00 | -9.94% | Extended the multi-week semiconductor selloff on AI-demand sustainability doubts |
| Applied Materials Inc | AMAT | $436.45 | -8.40% | Continued profit-taking after 2026’s outsized chip-equipment rally |
| Caterpillar Inc | CAT | $782.71 | -6.91% | Baird downgrade to Neutral, PT cut to $900 from $1,200, on data-center regulatory pushback |
| Lam Research Corp | LRCX | $252.35 | -6.40% | Continued semiconductor-sector profit-taking ahead of tonight’s earnings |
— Institutional-grade intelligence for serious investors. Apply for membership at join.recessionalert.comC. HIGH-IMPACT STORIES -> TOP
BEARISH
1. Three FOMC Members Dissent in Favour of a Hike — the First Unified Three-Way Dissent Since 2016 — and the Dow Posts Its Worst Session Since April 2025
The core facts:The FOMC held the target range at 3.50%-3.75% for a fifth consecutive meeting, but Cleveland’s Beth Hammack, Minneapolis’s Neel Kashkari and Dallas’s Lorie Logan all dissented in favour of a 25 basis point increase — the first time since September 2016 that three policymakers have dissented in the same direction. Chair Kevin Warsh said the Fed “will not hesitate” to act on sticky inflation and, asked about the split, replied: “I asked for a good family fight, and I got one. That’s the designed feature.” Equities took the hawkish configuration badly. The Dow fell 1,152.46 points, or 2.18%, to 51,594.86 — its worst single session since April 2025 — while the S&P 500 lost 1.51% to 7,316.40 and the Nasdaq 100 dropped 2.06% to 27,192.31. The VIX jumped 13.29% to 20.63. Every S&P sector except Energy (+2.05%) and two defensives finished lower, with Industrials down 3.40% and Technology down 2.49%.
Why it matters:A hold is not a hold when three voting members want the opposite direction. Dissent count is the market’s cheapest read on the distribution of committee opinion, and a unified three-way hawkish dissent reprices the entire forward path without a single basis point of actual policy change — Polymarket’s implied probability of a 2026 hike moved 14 points to 63% on the day. The more consequential signal is what it says about the reaction function: this committee is now visibly split on whether current policy is restrictive enough with inflation still above target and a Middle East conflict feeding into the energy complex. For portfolio construction, the practical consequence is that the “Fed put” strike has moved materially lower. Equity duration was the first casualty — the Nasdaq 100’s 2.06% loss against the Dow’s 2.18% understates the damage, because the Dow decline was concentrated in Industrials rather than rate-sensitives.
What to watch:Whether the dissent bloc holds together at the September meeting — three becoming four would make a hike the base case rather than a tail. Watch also whether the VIX sustains above 20, a level it has spent most of July below.
BEARISH
2. The 30-Year Treasury Yield Closes at 5.21%, a 19-Year High, While the 2-Year Falls — a Bear Steepener That Prices Credibility, Not Policy
The core facts:The long end did the talking after the Fed’s decision. The 30-year Treasury yield surged 12 basis points to 5.21%, its highest level since 2007 — a 19-year high. The 10-year rose 8.4 basis points to 4.688%. The 2-year, the maturity most directly tied to the expected policy path, actually fell 0.6 basis points to 4.271%. The dollar index declined 0.47% to 100.89 in the same session, and gold rose 0.69% to $4,066.50/oz.
Why it matters:The shape of the move matters more than its size. If the market were simply repricing a higher policy path, the 2-year would have led — it did not. A steepening driven entirely by the long end, with the front end flat to lower, is the signature of a term-premium and inflation-credibility repricing rather than a rate-path repricing. In plain terms: investors are not demanding more compensation for the next twelve months of Fed policy, they are demanding more compensation for holding duration through a decade in which the Fed may tolerate above-target inflation. That the dollar fell on the same day yields rose reinforces the reading — foreign capital did not treat the yield move as an invitation. A 5.21% long bond resets the discount rate for every long-duration asset in the market: growth equities, commercial real estate, infrastructure and utility rate bases, and the 30-year mortgage that anchors housing affordability. Utilities, the most bond-proxy sector in the index, fell 1.70% and Real Estate 0.26%.
What to watch:Whether 5.21% holds as a floor or a ceiling — a sustained break above 5.25% on the 30-year would put the 2007 highs decisively in play. Watch the 2s30s spread: further steepening with a flat front end confirms the credibility read; a front-end selloff would revert it to a conventional policy repricing.
UNCERTAIN
3. Warsh Strips Forward Guidance Out of the FOMC Statement Entirely — a Communication Regime Change Distinct From the Rate Decision
The core facts:The post-meeting statement was materially shorter than recent practice and contained no forward guidance at all. At the press conference Warsh defended the leaner format, arguing that pulling back from intensive forward guidance gives markets room to react directly to incoming data rather than to anticipate specific Fed moves. He also reiterated that there is “no soft implicit inflation target — only a target of 2 percent.” The statement cited solid economic activity amid elevated uncertainty owing “in part to the conflict in the Middle East,” with inflation still well above target.
Why it matters:For fifteen years the Fed has used forward guidance as an active policy instrument — a way to ease or tighten financial conditions without moving the funds rate. Removing it does not make policy more hawkish or more dovish; it makes policy less predictable, which is a distinct and separately priceable change. The immediate consequence is higher rate volatility: if the statement no longer pre-commits, every data release becomes a live event rather than a confirmation of an already-communicated path. That raises the value of macro hedging and lowers the information content of Fed-speak, which has been a reliable trading input since 2011. Second-order, it degrades the usefulness of the dot plot and of inter-meeting speeches as positioning tools. The combination of no guidance plus three visible dissents means the market must now price the committee’s distribution, not its median — and distributions are wider than medians.
What to watch:The MOVE index and rate-vol pricing over the next two weeks — a structural step up would confirm the market has repriced Fed unpredictability. Watch also whether the September statement retains the abbreviated format, which would establish it as regime rather than experiment.
BEARISH
4. Iran Fires Ballistic Missiles at a US Base in Jordan and Rejects Oman’s Hormuz Plan the Same Day — WTI Jumps 6.74% and Trump Promises a “Beating”
The core facts:The IRGC Aerospace Force fired several ballistic missiles at the Muwaffaq Salti Air Base and US Central Command headquarters in Jordan. CENTCOM said all were intercepted with no casualties or damage. This was Iran’s first ballistic missile attack on a US base in the region since Trump paused strikes last Friday to allow diplomacy — shattering that pause and landing a day after he described negotiations as “very friendly.” Trump told Fox News that Iran “is going to get a beating” and “we’ll be hitting them hard.” Separately, a senior Iranian official told Reuters that Tehran has ruled out Oman’s proposal for regional joint management of the Strait of Hormuz — the de-escalation framework Gulf states had backed only 24 hours earlier. The US also worked with Saudi Arabia to strike Iran-backed militias in Iraq. WTI settled up 6.74% at $84.60 and Brent up 7.36% at $88.12; Energy was the only S&P sector to gain (+2.05%), with ExxonMobil +2.42% and Chevron +2.28%.
Why it matters:The two events compound in a way neither does alone. The missile strike converts a pause into an escalation ladder with a publicly committed US retaliation at the top of it; the Hormuz rejection removes the only near-term diplomatic exit from a chokepoint that Iran has largely blocked since 28 February. What was priced yesterday as a de-escalation trade — Gulf states institutionalising passage, WTI below $80 — has fully reversed inside one session. For a US portfolio the transmission runs through two channels. The direct one is energy input costs at a moment when the Fed has three members already voting for a hike; a sustained $85 WTI feeds headline CPI and hardens the hawkish bloc. The indirect one is that geopolitical risk premium is now embedded in the crude curve rather than sitting in the spot price, which means the equity market cannot mark it out on a single day of good news. Crude remains well below April’s ~$112 high, so the escalation is not yet priced as a supply catastrophe — it is priced as a persistent tax.
What to watch:The form and scale of the promised US retaliation, and whether it touches Iranian energy infrastructure rather than proxy targets — that distinction is the difference between $85 and $100 crude. Watch WTI’s ability to hold $84 as a floor.
BEARISH
5. Crude Inventories Fall 7.167 Million Barrels — Five Times the Expected Draw — as the SPR Hits a 43-Year Low and OPEC+ Prepares to Freeze Output From October
The core facts:EIA data for the week ended 24 July showed commercial crude stocks down 7.167 million barrels against a 1.3 million expected draw, after a 2.011 million build the prior week. Gasoline was roughly flat at +0.007 million versus a 0.7 million expected draw; distillate built 1.062 million; Cushing drew 0.771 million. The draw pulled commercial stockpiles to their lowest operating levels since 2018. A further 3.7 million barrels left the Strategic Petroleum Reserve, taking it to 307.7 million barrels — the lowest in more than 43 years. Separately, sources told Reuters that OPEC+ will likely pause quota increases for three months beginning in October, once scheduled voluntary-cut barrels have returned, pending an internal capacity review before setting 2027 quotas. The group is still expected to raise the September target by roughly 188,000 bpd at its 2 August meeting.
Why it matters:This is the supply-side layer beneath the geopolitical headline, and it is the more durable of the two. Geopolitical premium can evaporate on a diplomatic breakthrough; inventory does not rebuild on a press release. Commercial stocks at 2018 lows and an SPR at a 43-year low together mean the US has spent its two principal shock absorbers before the shock has fully arrived. The policy consequence is that Washington no longer has a credible non-military lever to cap crude — SPR releases at 307.7 million barrels are politically and operationally constrained in a way they were not in 2022. Layering an OPEC+ output freeze onto that from October removes the other source of marginal barrels precisely as the Hormuz impasse enters its sixth month. Note the tension with demand: OPEC has cut its 2026 global demand growth forecast to 780,000 bpd, a third consecutive reduction, so this is a tightening driven by supply withdrawal rather than demand strength — the worst combination for equities, since it raises input costs without signalling growth.
What to watch:The 2 August OPEC+ meeting for confirmation of both the September increase and the October freeze. Watch next week’s EIA print for whether the 7.167 million draw was a one-week distortion or the start of a trend.
BEARISH
6. The Nasdaq 100 Confirms a Technical Correction as an SK Hynix Miss Wipes More Than $1 Trillion off Global Chip Stocks
The core facts:The Nasdaq 100 opened down 10% from its June peak of 30,660 and closed 2.06% lower at 27,192.31, finishing more than 11% below that high and confirming a technical correction. The catalyst was SK Hynix, which missed estimates despite posting record quarterly revenue and profit; the stock closed down 9.61% in Seoul after falling more than 15% intraday. Samsung Electronics fell about 5%, LG Innotek 10.89%, Seoul Semiconductor 8.89% and Kioxia 18%. The damage carried into US names: KLA fell 10.80%, Micron 9.94%, Applied Materials 8.40% and Lam Research 6.40% ahead of its own report, with AMD down roughly 8% and Intel 6%. Global semiconductor market value has fallen by more than $1 trillion across the selloff. Analysts attribute the move to AI-infrastructure financing concerns, doubts about AI-demand sustainability, and Chinese advances in advanced chipmaking equipment. Technology was the second-worst S&P sector on the day at -2.49%, and is now down 7.19% on the week and 7.80% on the month.
Why it matters:The significant detail is that SK Hynix posted record revenue and profit and still triggered a rout. That tells you the market is no longer trading semiconductors on results — it is trading them on the credibility of the multi-year AI capex assumption embedded in the multiple. When record numbers are insufficient, the bar has moved from delivery to acceleration, and a sector priced for acceleration de-rates violently on merely excellent. The correction is therefore better read as a multiple event than an earnings event, which matters because multiple compression does not self-correct on the next good print. For US portfolios the concentration risk is now the dominant consideration: the Nasdaq 100 sits 11% off its high while the S&P 500 remains within a far shallower drawdown, meaning index-level resilience is being supplied entirely by breadth outside technology. Yesterday’s equal-weight S&P record and today’s Energy-only sector gain are the same phenomenon. The rotation is working — but it only works while the non-tech complement holds, and today Industrials fell 3.40%.
What to watch:Whether the Nasdaq 100 finds support before the 20% bear-market threshold near 24,530. The immediate test is tonight’s hyperscaler capex commentary — Microsoft guided FY2027 capital expenditure to $255-260 billion, well above the roughly $220 billion analysts expected, which either validates memory demand or confirms the financing concern.
— Quantifying recession risk so you don’t have to guess. Apply for membership at join.recessionalert.comD. MODERATE-IMPACT STORIES -> TOP
BEARISH
7. Baird Cuts Caterpillar to Neutral and Slashes Its Target 25% on Data-Centre Regulatory Pushback — Shares Fall 6.91%
The core facts:Baird analyst Mircea Dobre downgraded Caterpillar to Neutral from Outperform and cut the price target to $900 from $1,200, a 25% reduction. The rationale was not machinery demand or construction cycles but a broadening campaign of state and local regulatory intervention against data-centre development — the pillar under Caterpillar’s power-generation demand narrative. Shares closed down 6.91% at $782.71, the fourth-largest decline among US mega-caps on the day. Industrials was the worst-performing S&P sector at -3.40%, atop an already-negative month of -8.78%.
Why it matters:Caterpillar has spent two years being re-rated as an AI-infrastructure derivative rather than a construction cyclical, on the strength of reciprocating engines and gensets sold into data centres. Baird’s call attacks that re-rating at its foundation: if municipalities can slow or block data-centre siting, the power-generation backlog is a political variable, not an engineering one — and political variables do not support cyclical-peak multiples. The read-through extends well beyond one name. Every industrial that has been repriced on data-centre power demand — turbine makers, electrical equipment, engineering and construction, and the utilities underwriting the load growth — carries the same regulatory exposure. That Industrials fell 3.40% on a day when the broad index lost 1.51% suggests the market took the call as a sector signal rather than a single-stock view. Note the tension with the sector’s own fundamentals: General Dynamics reported a beat-and-raise with record backlog this morning and still finished down 3.11%.
What to watch:Whether other sell-side houses follow Baird on the data-centre siting thesis, and whether Caterpillar addresses permitting risk directly in its power-generation backlog commentary. Watch state-level moratorium proposals in Virginia, Georgia and Texas.
BEARISH
8. America’s Second-Largest Wine and Spirits Distributor Files Chapter 11 — a Distribution-Layer Failure With Supplier Write-Down Risk
The core facts:Republic National Distributing Company, the second-largest wine and spirits distributor in the United States, has filed for Chapter 11 protection in Texas, listing liabilities of between $1 billion and $10 billion and more than 100,000 creditors, and is seeking a sale or wind-down. Proximo Spirits and Empower Annuity are among the largest unsecured creditors. Section E of this report carries the filing detail and creditor structure; the focus here is the equity read-through.
Why it matters:The US alcohol market runs on a legally mandated three-tier system in which producers cannot sell directly to retailers — they must go through distributors. That makes distribution a regulated bottleneck rather than a competitive service, and it means the failure of the number-two player is not absorbed the way a failed reseller would be in an ordinary supply chain. Public beverage suppliers face two distinct exposures: receivables written down against a filing entity with 100,000-plus creditors, and, more importantly, route-to-market disruption in states where RNDC held the franchise. Rebuilding distribution coverage takes quarters, not weeks, and typically at worse terms as the surviving distributor gains negotiating leverage. The broader signal is that this is a credit event in a defensive, non-cyclical consumer category — the part of the economy that is supposed to be insulated. Consumer Defensive was one of only three S&P sectors to close higher today (+0.35%), so the market is not yet treating it as a sector-wide solvency question.
What to watch:Disclosure of RNDC receivable exposure in the next round of public beverage-supplier earnings, and whether the case converts to a going-concern sale or a liquidation — the latter would force a far more disruptive scramble for shelf access.
UNCERTAIN
9. Millennium Management in Talks for a Record $20 Billion Raise — Double Its Original Target
The core facts:Millennium Management, the multistrategy platform with more than $92 billion in assets, is in talks to raise approximately $20 billion in new capital — roughly double the at-least-$10 billion target it set in late June. The raise would be structured in two tranches. Separately, the firm is seeking deals to replace the external capital of outside managers, mirroring the earlier Jain Global arrangement in which Bobby Jain’s firm returned investor cash to manage money exclusively for Millennium. The effort is led by president Ajay Nagpal. Millennium was founded in 1989 by Israel Englander with $35 million.
Why it matters:A $20 billion single raise would be the largest in hedge fund history and continues an unambiguous trend: capital is concentrating into a handful of multistrategy platforms that can absorb it. Two consequences matter for a long-only portfolio manager. First, multistrategy platforms deploy through levered, market-neutral pod structures — so incremental capital of this size translates into a much larger gross exposure footprint across equities, rates and credit, which raises the market’s sensitivity to coordinated deleveraging. Pod-shop risk limits are tight and mechanical; when they bind simultaneously, the resulting unwind hits crowded factor positions rather than individual names. Second, the arrangement to absorb outside managers’ external capital signals that the independent-manager launch model is losing to the platform model, further concentrating who sets marginal prices in liquid markets. The timing is notable — this capital is being raised into a session in which the VIX rose 13% and the Nasdaq 100 confirmed a correction.
What to watch:Confirmation of the final size and tranche structure, and whether peer platforms announce competing raises — a cluster of large multistrat raises would mark a positioning regime, not a single-firm event.
UNCERTAIN
10. The Dollar Falls and Gold Rises on a Day of Surging Yields and a 2% Equity Rout — the Safe-Haven Bid Skipped the Dollar Entirely
The core facts:The US dollar index fell 0.47% to 100.89 on a session in which the Dow lost 2.18%, the VIX rose 13.29% to 20.63, the 30-year Treasury yield hit a 19-year high and a US military base came under ballistic missile attack. Gold rose 0.69% to $4,066.50 an ounce. Bitcoin fell 0.51% to $63,594. In a conventional risk-off session with rising US yields, all four of those variables would normally point the dollar higher.
Why it matters:The dollar failing to bid on a day that offered it every possible reason to rally is the most informative cross-asset signal of the session, and it corroborates the term-premium reading of the bond move. Rising yields attract capital when they reflect growth or policy tightening; they repel it when they reflect a demand for inflation compensation. That gold rallied simultaneously — a real-asset hedge, not a rates hedge — points the same direction. The practical consequences for a US portfolio are threefold. Unhedged foreign equity exposure gained a tailwind on a day domestic equities fell 1.51%. Import costs face upward pressure precisely as crude rises 6.74%, compounding the inflation problem the three FOMC dissenters are voting on. And for multinationals, translation effects turn modestly favourable into the next reporting cycle. The caution is that one session is not a trend — the dollar’s 100.89 level remains within its recent range, and a single day of failed safe-haven demand can reflect positioning as easily as conviction.
What to watch:Whether DXY breaks below 100.00 — a decisive move through that round number on rising yields would confirm the credibility repricing rather than positioning. Watch gold’s ability to hold above $4,000.
BULLISH
11. Dutch TTF Gas Jumps 5.24% While Henry Hub Adds Just 0.93% — the Middle East Premium Is a European Problem, and US LNG Is the Arbitrage
The core facts:European benchmark Dutch TTF natural gas rose 5.24% to $20.28/MMBtu on the Middle East escalation, while US Henry Hub gained only 0.93% to $2.726/MMBtu. The resulting spread is roughly 7.4x. Crude, by contrast, moved almost identically on both sides of the Atlantic — WTI +6.74%, Brent +7.36%.
Why it matters:Crude is a globally fungible commodity and prices as one market; natural gas is not, and the divergence measures exactly how much of the Middle East risk premium is being absorbed by buyers who lack domestic supply. Europe imports its marginal molecule and therefore pays the full geopolitical premium; the US produces its own at record volumes and does not. For a US portfolio this asymmetry is a direct positive on three fronts. It widens the netback economics for American LNG exporters, whose margin is the spread between Henry Hub feedgas cost and the delivered European price — a spread that just expanded materially in a single session. It preserves the domestic industrial cost advantage in energy-intensive manufacturing, chemicals and fertiliser at a moment when European competitors face the opposite. And it insulates US utility fuel costs from an escalation that will feed directly into European power prices. The constraint is liquefaction and shipping capacity, which is fixed in the short run — so the near-term benefit accrues to existing export capacity rather than to announced projects.
What to watch:Whether the TTF-Henry Hub spread holds above 7x, which would sustain full utilisation of US export terminals. Watch European storage injection rates through August — a shortfall entering the heating season would extend the divergence.
UNCERTAIN
12. Shein Discloses an FTC Consumer-Protection Investigation Into Its US Business in a Hong Kong Listing Prospectus
The core facts:Shein disclosed in a draft prospectus filed with the Hong Kong Stock Exchange that the Federal Trade Commission is “conducting an investigation into our US business operations,” and said it is “actively cooperating.” An FTC spokesperson confirmed the probe is focused on potential consumer-protection violations. The company warned that the outcome “may require us to make significant monetary payments that could have a material adverse effect on our financial condition and results of operations.” The filing appears to be the probe’s first public disclosure, and Shein offered no detail on its scope.
Why it matters:Shein is not US-listed, so the direct equity impact is nil — the relevance is entirely in the read-through. Shein and its ultra-low-price peers have been the principal competitive pressure on US apparel and general-merchandise e-commerce margins, and their cost structure has depended on import-compliance treatment that is already under legislative and enforcement scrutiny. An FTC consumer-protection action, distinct from the de minimis tariff debate, opens a second regulatory front. If it produces a material settlement or operating restrictions, the effective landed cost of the ultra-fast-fashion model rises and the pricing umbrella over domestic competitors lifts. That is a genuine, if slow-moving, positive for US apparel retailers and marketplaces. The uncertainty is real, though: the FTC gave no scope, no timeline and no theory of the case, and the disclosure surfaced in an IPO risk-factor section — a context that systematically over-discloses. Treat this as an open regulatory question, not a resolved competitive shift.
What to watch:Any FTC statement clarifying the theory of the case, and whether the Hong Kong listing timetable slips — a delay would signal the company views the exposure as material rather than routine.
UNCERTAIN
13. Arete Upgrades Texas Instruments to Buy Into the Chip Rout While JPMorgan Lifts CarMax’s Target 58% — the Sell Side Steps Into the Selloff
The core facts:Wednesday’s notable rating changes ran conspicuously against the tape. Arete raised Texas Instruments to Buy from Neutral with a $405 target — landing on the day the Nasdaq 100 confirmed a correction and global chip stocks completed a $1 trillion drawdown. JPMorgan upgraded CarMax to Neutral from Underweight and raised its target to $60 from $38, a 58% increase. Citigroup upgraded Ford to Buy from Neutral, target to $20 from $19. Clear Street raised Bloom Energy to Buy from Hold with a $290 target, and Fearnley raised Noble to Buy from Hold with a $50 target.
Why it matters:The composition of these calls is more informative than any single one. Texas Instruments is analogue and embedded silicon, not AI memory or leading-edge logic — upgrading it during a memory-driven rout is an explicit statement that the selloff is being applied indiscriminately across a sector with very different end-market exposures. That is the first sell-side attempt to differentiate within the chip complex since the drawdown began, and if it gains traction it marks the point where the sector stops trading as one instrument. The CarMax move is a different signal: a 58% target increase from an Underweight rating is an unusually large capitulation on a consumer-cyclical name, implying the analyst sees used-vehicle pricing and credit conditions inflecting. The Bloom Energy call sits directly against the Caterpillar downgrade thesis — both names are levered to data-centre power demand, and today one was upgraded while the other was cut 25%. That disagreement is the honest summary of where the sell side stands on AI infrastructure: no consensus, high conviction on both sides.
What to watch:Whether other houses follow Arete in separating analogue from AI-memory semiconductors — a broadening of that distinction would be the first sign the chip selloff is maturing into differentiation rather than liquidation.
— Separating signal from noise since 2007. Apply for membership at join.recessionalert.comE. ECONOMY WATCH -> TOP
Wednesday’s FOMC meeting exposed a rare governance rift: Chair Warsh held rates at 3.75% for a fifth straight meeting, but three regional presidents dissented in favor of a hike — the first three-way same-direction split since 2016 — even as Polymarket’s implied hike-odds for 2026 fell 14 points to 63% on the hold itself. Hard data reinforced the split character of the day: durable goods orders missed headline consensus but core orders hit an 11% annual pace, while Richmond Fed’s factory gauge improved sequentially yet missed estimates. Credit stress also surfaced as RNDC, the industry’s second-largest spirits distributor, filed Chapter 11. Markets are treating today’s hold as dovish; three FOMC votes disagree.
Fed Holds at 3.75% as Record Three-Way Hawkish Dissent Splits Committee, Markets Trim Hike Odds (Bloomberg / U.S. News, July 29, 2026)
What they’re saying:The FOMC voted 9-3 to hold the federal funds rate in a 3.5%-3.75% range for a fifth straight meeting. Dallas Fed’s Lorie Logan, Cleveland’s Beth Hammack, and Minneapolis’s Neel Kashkari all dissented in favor of a 25bp hike — the first time three members have dissented in the same direction since 2016. Chair Kevin Warsh told reporters he “asked for a good family fight and I got one.”
The context:Markets had priced meaningful hike risk into the meeting — Polymarket’s “Fed rate hike in 2026” contract implied 77% probability heading in — but the hold itself, not the dissents, drove the reaction: short-dated Treasury yields fell and the contract’s implied probability dropped 14 points to 63% by session’s end. The split exposes unresolved tension between the committee’s median view and a hawkish minority alarmed that inflation hasn’t converged to target.
What to watch:Thursday’s Core PCE and Q2 GDP advance release (Jul 30) will be the next test of whether the hawkish dissenters’ inflation concerns are validated by the data.
Republic National Distributing Files Chapter 11, Second-Largest Wine & Spirits Distributor Winds Down (Bloomberg Law / BevNET, July 26, 2026)
What they’re saying:RNDC, the country’s second-largest wine and spirits distributor, filed for Chapter 11 in the Southern District of Texas, listing liabilities of $1 billion to $10 billion against assets of $500 million to $1 billion and over 100,000 creditors. The company said the filing is meant to facilitate a sale of remaining operations and an orderly wind-down rather than a reorganization.
The context:The filing threatens a cascade of losses across the beverage supply chain — major unsecured creditors include Proximo Spirits (>$93.9M owed) and Empower Annuity (>$62M), among dozens of wine and spirits suppliers now facing receivable writedowns. Distributors sit at a chokepoint in the three-tier alcohol system, so RNDC’s collapse raises delivery and shelf-space risk for producers nationwide, not just credit losses.
What to watch:Bankruptcy court proceedings for a stalking-horse buyer or asset sale process in the coming weeks.
Durable Goods Orders Miss Consensus in June Despite Strong Core Reading (Advisor Perspectives, July 27, 2026)
What they’re saying:Headline durable goods orders rose just 0.3% in June to $334.77 billion, well below consensus estimates near 1.6%, following a revised 4% drop in May. Core orders excluding transportation — a cleaner read on capex demand — rose 0.6% on the month and 11.0% year-over-year, the fastest annual pace since March 2022.
The context:The headline miss was concentrated in transportation (-0.2%, driven by a 0.6% drop in motor vehicles), while capital goods (+1.1%) and computers/electronics (+3.1%) posted solid gains — a pattern consistent with resilient AI-linked capex spending offsetting softer traditional manufacturing.
What to watch:Thursday’s Q2 GDP advance print (Jul 30), which will show how much business investment contributed to growth.
Richmond Fed Manufacturing Index Ticks Up But Misses Estimates in July (Advisor Perspectives, July 28, 2026)
What they’re saying:The Richmond Fed’s composite manufacturing index rose to 5 in July from 4 in June, but came in well below the roughly 10 consensus estimate. Components were mixed: shipments jumped to 8 from 4 and employment improved to 2 from -1, while new orders slipped to 5 from 8.
The context:The report reinforces a “mostly flat” regional manufacturing picture — sequential improvement in production and hiring intentions, but softening forward demand as new orders decelerate, echoing the national ISM survey’s recent hover near the expansion/contraction line.
What to watch:ISM Manufacturing PMI (first business day of August) for a national read on whether the regional softening is broadening.
Former Fed Governor Miran Calls Current Inflation “Transitory,” Backs Hold Ahead of FOMC (CNBC, July 28, 2026)
What they’re saying:Stephen Miran, now a Hudson Bay Capital senior strategist and former Fed governor, said on CNBC he sees the current inflation bout as “much more likely to be transitory,” attributing recent price pressure to temporary effects from the Iran conflict and pointing to negative monthly inflation readings in June when oil prices fell. He said the Fed was right to stay on hold “based on this, but also based on everything else that’s going on in the economy.”
The context:Miran’s comments landed a day ahead of the FOMC decision and offered a dovish counterweight to the hawkish dissent camp — the same debate that played out inside the committee room 24 hours later, where three regional presidents concluded the opposite: that inflation risk still warranted a hike.
What to watch:Whether Thursday’s Core PCE print supports the “transitory” read or validates the hawkish dissenters’ concern.
— Know the probability before the market prices in the risk. Apply for membership at join.recessionalert.comF. EARNINGS WATCH -> TOP
YESTERDAY AFTER THE BELL (Markets Reacted Today)
UNCERTAIN
14. Visa (V): -2.31% | Double Beat and 14% Revenue Growth, Undercut by a Same-Day 7% Workforce Cut
The Numbers:Released: AMC July 28. Fiscal Q3 net revenue $11.6B, up 14% year over year. Non-GAAP EPS $3.32 versus $3.29 consensus, up 11%; GAAP net income $5.6B or $2.97 per share, up 7% and 10% respectively. Payments volume +10% constant dollar, total cross-border volume +13% (+12% excluding intra-Europe), processed transactions 71.7 billion, +10%.
The Problem/Win:The operating result was clean — cross-border, the highest-margin line in the business, grew faster than total volume for another quarter, and 14% revenue growth against 10% volume growth means pricing and value-added services are contributing. What the market focused on instead was the announcement, released the same day, that Visa will eliminate roughly 2,600 roles — about 7% of its workforce, concentrated in technology and product teams. A cost action of that scale from a company posting double-digit growth invites the question of what management sees that the quarter does not show.
The Ripple:Visa’s cross-border figures are the cleanest available real-time proxy for global travel and commerce, and +13% argues against the consumer-weakness narrative that Consumer Confidence’s third straight monthly decline implies. Mastercard reports tomorrow before the bell against consensus of $4.77 EPS on $9.06B revenue and will provide the cross-check.
What It Means:The payments duopoly is still compounding at low-double-digit revenue growth with no visible volume deceleration. The 2.31% decline reads as a reaction to the restructuring headline and the broad risk-off tape rather than to the quarter itself.
What to watch:Mastercard’s cross-border volume growth tomorrow morning — a similar +13% confirms the consumer; a material gap would suggest Visa-specific share gains rather than category strength.
UNCERTAIN
15. KLA Corp (KLAC): -10.80% | Record Revenue and Raised Guidance Still Fall Short of a Bar Set Too High
The Numbers:Released: AMC July 28. Fiscal Q4 revenue a record $3.66B, up 7% sequentially and 15% year over year, above the ~$3.6B Street estimate. Non-GAAP EPS $1.05 versus $1.00 consensus, at the top of guidance. September-quarter guidance: revenue $4.0B ±$200M, gross margin 62.5% ±1pt, non-GAAP EPS $1.16 ±$0.10. Advanced packaging process-control revenue guided to approximately $1.1B in 2026, up more than 70% year over year.
The Problem/Win:There is no operational problem in this release. Revenue was a record, EPS beat, guidance was raised, and advanced packaging — the segment most directly levered to AI accelerator production — is growing more than 70%. The stock fell 10.80% anyway, closing at $170.19. Analysts framed it as guidance failing to clear heightened expectations rather than guidance being weak: the September outlook of roughly $4B was in line with where the buy side had already marked the quarter, leaving nothing for a stock that had run hard into the print.
The Ripple:KLA’s decline was the largest among US mega-caps today and it dragged the equipment complex with it — Applied Materials -8.40%, Lam Research -6.40% into its own report. The pattern is identical to SK Hynix’s: record fundamentals, negative reaction. Two names posting records and falling double digits on the same day is the sector’s clearest de-rating signal.
What It Means:Semiconductor capital equipment is no longer being valued on delivered results but on the sustainability of the 2027 capex assumption. Until that assumption is re-anchored, beats will not be rewarded.
What to watch:Whether Lam Research’s stronger after-hours reaction tonight holds through tomorrow’s session — divergent treatment of two equipment names reporting a day apart would be the first evidence of differentiation returning to the group.
TODAY BEFORE THE BELL (Markets Already Reacted)
UNCERTAIN
16. Procter & Gamble (PG): -1.87% | Organic Sales Flat as Volume Contributes Nothing and Revenue Misses
The Numbers:Released: BMO. Fiscal Q4 net sales $21.2B versus $21.38B consensus, a 0.84% miss. Core EPS $1.43 versus $1.41 estimate; GAAP EPS $1.26 versus $1.39 estimate, down from $1.48 a year ago, with GAAP net income $3.04B against $3.62B. Organic sales were unchanged for the quarter with volume contributing no net impact. Full year fiscal 2026: net sales +3%, organic sales +1%, diluted EPS +2%, core EPS +1%.
The Problem/Win:Flat organic sales with zero volume contribution is the defining number. P&G’s model depends on pricing power translating into revenue growth while volumes hold; a quarter in which volume adds nothing means the pricing lever is fully extended. Beauty was the bright spot, with volume up 3% and organic sales up 4% on Pantene, Olay and SK-II. Fabric and home care added 1% volume. Health care was the weak point, volume down 3% on softening oral care in North America and Greater China. The GAAP-to-core gap of 17 cents reflects restructuring charges.
The Ripple:P&G is the broadest single read on US and global household consumption available in any quarter. Flat volumes corroborate the demand signal in this week’s Consumer Confidence miss and decelerating weekly hiring. Notably, Consumer Defensive was still one of only three S&P sectors to close higher (+0.35%) — the sector is being bought for its defensive characteristics, not its growth.
What It Means:Staples are now a rate-and-safety trade rather than an earnings-growth trade. With the 30-year at 5.21%, that basis is less comfortable than it looks.
What to watch:Whether volume turns positive in fiscal Q1 — a second consecutive quarter of zero volume contribution would force a reassessment of the pricing-led model.
BULLISH
17. Amphenol (APH): +4.49% | Revenue Up 55% and Records Across the Board — the Only AI-Levered Name to Gain on a Day Chips Lost $1 Trillion
The Numbers:Released: BMO. Q2 revenue $8.76B versus $8.26B consensus, a 6.05% beat and up 55% year over year. EPS $1.35 versus $1.18 estimate, a 14.75% beat; GAAP EPS $1.37 versus $1.21, +12.95%. Q3 guidance: revenue $9.3-9.4B, EPS $1.40-1.42 — both above the current quarter. Management guided IT datacom sales to a sequential increase in the low-teens percentage range.
The Problem/Win:CEO Adam Norwitt said record sales and record adjusted diluted EPS both exceeded the high end of guidance. The driver is IT datacom — the interconnect content that goes into AI server racks — where hyperscale and enterprise customers continue expanding deployments. Fifty-five percent revenue growth at $8.76B scale is exceptional for a components business, and the sequential guide to $9.3-9.4B says the momentum is not decelerating.
The Ripple:The contrast with the semiconductor complex is the story. On a session when the Nasdaq 100 confirmed a correction, KLA fell 10.80%, Micron 9.94% and Applied Materials 8.40%, Amphenol — as direct an AI-infrastructure derivative as exists outside silicon — rose 4.49%. That divergence argues the selloff is a memory and equipment problem, not an AI-demand problem, and it directly supports Arete’s contrarian Texas Instruments upgrade today.
What It Means:AI capex is still being spent — the market is simply reallocating which links in the chain it will pay a premium for. Interconnect is currently winning that reallocation.
What to watch:Whether Amphenol’s low-teens sequential IT datacom guide is corroborated by the hyperscaler capex numbers tonight — Microsoft’s FY2027 guidance of $255-260 billion is the direct upstream confirmation.
BULLISH
18. Automatic Data Processing (ADP): +3.48% | Double Beat, 140bp Margin Expansion and a Solid Fiscal 2027 Guide
The Numbers:Released: BMO. Fiscal Q4 adjusted EPS $2.64 versus $2.59 consensus; revenue $5.47B versus $5.44B. GAAP EPS $2.45 versus $2.60 estimate. Adjusted EBIT +13% to $1.4B with margin up 140 basis points to 25.1%. Full-year fiscal 2026 revenue $21.95B, +7% (organic constant currency +6%), adjusted diluted EPS +11% to $11.12. Employer Services new business bookings +6% to $2.2B; client revenue retention 92.1%; Retirement Services passed $1B in annual revenue. Fiscal 2027 guidance: revenue +5-6%, adjusted EBIT margin +70-90bp, adjusted EPS +9-11%.
The Problem/Win:The win is margin, not growth. A 140 basis point expansion to 25.1% on 7% revenue growth, with management attributing it to AI-driven efficiency, is the operating leverage story the market wants from a mature services business. Bookings growth of 6% and 92.1% retention indicate the demand base is intact. The fiscal 2027 guide of 9-11% EPS growth on 5-6% revenue growth explicitly assumes that leverage continues.
The Ripple:ADP is the largest private payroll processor in the country, and its Employer Services metrics are a bottom-up labour market read independent of the BLS. Six percent bookings growth is not a picture of employers retrenching — which sits uneasily beside the weekly ADP tracker showing hiring decelerating for a fifth consecutive week to roughly 15,000 per week. New client wins and existing-client headcount growth are different variables, and they are currently pointing in opposite directions.
What It Means:ADP’s 3.48% gain on a 1.51% down day makes it one of the session’s clear relative winners, and the AI-efficiency margin narrative is the rare version of that story that shows up in reported numbers rather than in guidance.
What to watch:Pays-per-control growth in the fiscal Q1 report — that metric, not bookings, is the direct read on whether existing clients are still adding headcount.
BULLISH
19. General Dynamics (GD): -3.11% | Record $136.5B Backlog and a Raised Outlook, Sold Off With the Industrials Complex
The Numbers:Released: BMO. Q2 adjusted EPS $4.24 versus $3.96 consensus, a 6.95% beat and up 13.4% year over year; GAAP EPS $4.24 versus $3.94, +7.72%. Revenue $14.09B versus $13.52B estimate, a 4.23% beat and up 8.1%. Operating earnings +11.9% with margin up 40 basis points to 10.4%. Record backlog of $136.5B, up 32% year over year. Gulfstream delivered 41 aircraft including the 100th G700; Aerospace book-to-bill 1.5x with backlog up 20%. Full-year Aerospace guidance approximately $13.8B revenue at 14.7% margin on about 160 Gulfstream deliveries; company outlook lifted.
The Problem/Win:This was a beat on every line with an outlook increase, and the quality is in the backlog: $136.5B up 32% and an Aerospace book-to-bill of 1.5x mean orders are being taken faster than revenue is being recognised, which is the leading indicator that matters in defence and business jets. The stock still closed down 3.11%. The explanation is external — Industrials was the worst S&P sector at -3.40%, dragged by Caterpillar’s 6.91% decline on the Baird downgrade, and GD was carried down with the group on a 1,152-point Dow day.
The Ripple:A record defence backlog reported on the day Iran fires ballistic missiles at a US base and the President promises retaliation is an unusually direct fundamental-plus-catalyst alignment, and the market ignored it entirely. That the whole sector fell regardless of company-specific news illustrates how completely the macro tape overwhelmed micro information today.
What It Means:The disconnect between a 32% backlog increase and a 3.11% decline is the clearest single example of indiscriminate selling in today’s session.
What to watch:Whether defence names decouple from the broader Industrials complex if US retaliation against Iran materialises — that would separate the geopolitical bid from the data-centre-power de-rating currently driving the sector.
TODAY AFTER THE BELL (Markets React Tomorrow)
BULLISH
20. Microsoft (MSFT): +3%+ AH | Azure Growth Accelerates to 43% and Passes $100B for the Year — but FY2027 Capex Guides to $255-260B
The Numbers:Released: AMC, approximately 4:10pm ET. Fiscal Q4 revenue $90.0B versus $87.7B consensus; EPS $4.74 versus $4.24 estimate — a 12% earnings beat. Intelligent Cloud revenue $39.31B, +31.6% year over year, against $38.16B consensus. Azure growth accelerated to 43% in constant currency from 40% the prior quarter, and Azure surpassed $100B in annual revenue for the first time. Microsoft 365 Copilot exceeded 30 million paid seats. FY2027 capital expenditure guided to $255-260B, against roughly $190B in FY2026 and analyst expectations near $220B.
The Problem/Win:Azure accelerating from 40% to 43% at a $100B revenue base is the single most important datapoint in the quarter — deceleration at scale is the default expectation, and Microsoft delivered the opposite. Thirty million paid Copilot seats converts the AI narrative into recurring per-seat revenue rather than consumption experiments. The offsetting item is capex: $255-260B for FY2027 is roughly 35% above FY2026 and materially above what the sell side had modelled, which compresses free cash flow and lengthens the payback horizon on the AI build.
The Ripple:This lands directly on today’s chip rout. The sector sold off on doubts about AI-demand sustainability and AI-infrastructure financing; the largest single buyer of that infrastructure just guided capex up 35%. Amphenol’s 4.49% gain on its low-teens sequential IT datacom guide points the same way. The tension is that the same number is simultaneously the bull case for suppliers and the bear case for the financing concern that triggered the selloff.
What It Means:The demand signal is intact and accelerating. The question the market must now price is not whether AI revenue is real but whether $255-260B of annual capex earns an acceptable return.
What to watch:Whether semiconductor names trade higher tomorrow on the capex guide — if chips fail to rally on a 35% hyperscaler capex increase, the de-rating is about valuation rather than demand, and the correction has further to run.
BEARISH
21. Meta Platforms (META): -5.06% AH | Revenue Beats and Grows 28%, but EPS Misses by 13% and Free Cash Flow Collapses to $784 Million
The Numbers:Released: AMC. Q2 revenue $60.80B versus $59.50B consensus, up 28% year over year. Adjusted EPS $6.18 versus $7.13 estimate — a 13% miss. Ad impressions +14% and average price per ad +12% year over year. Cash flow from operations $31.86B; free cash flow just $784 million. R&D expense topped $21B in the quarter. Full-year capital expenditure guidance raised at the low end to $130-145B from $125-145B.
The Problem/Win:The advertising business is performing — 28% revenue growth with impressions up 14% and pricing up 12% means both volume and yield are expanding, which is as healthy a mix as the model produces. Everything below the revenue line is the problem. A 13% EPS miss against a revenue beat is definitionally a cost problem, and the composition is explicit: R&D above $21B and capex guidance lifted again. The number that will dominate tomorrow’s discussion is free cash flow of $784 million against $31.86 billion of operating cash flow — a 97.5% conversion loss to capital spending in a single quarter.
The Ripple:Meta and Microsoft reported within minutes of each other and are being received in opposite directions — Microsoft up more than 3%, Meta down 5.06%. The distinction is not capex size but capex visibility: Microsoft’s spending has an Azure revenue line accelerating alongside it, while Meta’s has advertising revenue that would be growing anyway. That is the cleanest available illustration of how the market is now differentiating within AI capex, and it validates the financing-concern thesis behind today’s chip selloff.
What It Means:Meta is being repriced from an advertising compounder to a capital-intensive infrastructure business, and those carry different multiples. Communication Services was one of only three sectors to close higher today (+0.15%); that support is unlikely to survive tomorrow’s open.
What to watch:Whether free cash flow recovers in Q3 or the $784 million figure proves to be the new run rate — a second sub-$1B quarter would put the buyback and the equity story under direct pressure.
BULLISH
22. Lam Research (LRCX): +5.91% AH | Revenue Up 30% and an Outlook That Beat Estimates, Hours After Falling 6.40% With the Sector
The Numbers:Released: AMC. Fiscal Q4 EPS $1.82 versus the $1.69 consensus carried into the print, a beat of roughly 8%. Revenue $6.72B, up 30% year over year, against a $6.66B estimate. Management raised the 2026 wafer fab equipment outlook to “$140 billion with a bias to the upside” from $135 billion, and flagged roughly $40 billion of NAND conversion spending being pulled forward. Shares rose 5.91% after the close, having fallen 6.40% to $252.35 in the regular session.
The Problem/Win:The wafer fab equipment guide is the substantive item. Lifting the 2026 industry-wide WFE forecast to $140B with an upward bias, and identifying $40B of NAND conversion spending being pulled forward, is a direct rebuttal to the AI-demand-sustainability doubts that drove today’s rout — pulled-forward spending is the opposite of a demand air pocket. Thirty percent revenue growth against a modest estimate confirms it in delivered results rather than commentary.
The Ripple:The sequence within 24 hours is instructive: KLA beat and raised on Tuesday night and fell 10.80% today; Lam beat and raised tonight and rose 5.91%. Same sector, same quarter, opposite reactions. The plausible distinction is positioning — KLA had run harder into its print — but if Lam’s gain holds through tomorrow it would be the first evidence that the equipment complex is being differentiated rather than sold as a block, which is what Arete’s Texas Instruments upgrade also argued today.
What It Means:A raised industry WFE forecast from the second-largest equipment vendor is the most concrete counterargument available to the $1 trillion chip drawdown.
What to watch:Whether Applied Materials and KLA follow Lam higher tomorrow. A sector-wide bounce validates the WFE guide; Lam rising alone would mean the market is trading positioning, not fundamentals.
UNCERTAIN
23. Qualcomm (QCOM): -4% AH | Revenue Beats but Falls 4% Year on Year, EPS Drops 20%, and the Memory Crunch Clouds the Guide
The Numbers:Released: AMC, with the call at 1:45pm Pacific. Fiscal Q3 revenue $9.947B for the period ended 28 June, beating the $9.69B consensus but down 4% from $10.365B a year earlier. Non-GAAP EPS $2.21 against a $2.23 estimate, down 20% year over year; GAAP net income $2.002B, down 25%, GAAP EPS $1.87, down 23%. QCT revenue $8.504B, -5%; QTL revenue $1.278B, -3%. QCT pre-tax margin contracted four percentage points to 26%. Current-quarter guidance was light on in-line revenue, explicitly attributed to memory supply constraints and related pricing affecting several handset OEMs. The fiscal 2029 non-handset revenue target was raised to $40B, roughly double the prior goal.
The Problem/Win:Beating a lowered bar while revenue and earnings both decline year over year is not a good quarter, and the four-point QCT margin contraction is the sharpest signal in the release. The stated cause is the memory supply crunch — the same shortage that made SK Hynix’s record numbers possible is now raising Qualcomm’s input costs and constraining its customers’ handset builds. CEO Cristiano Amon’s response is direct: across-the-board price increases from 1 September and supply chain streamlining. The offsetting positive is the fiscal 2029 non-handset target doubling to $40B, an explicit bet that automotive and AI can replace smartphone dependence.
The Ripple:This is the memory shortage transmitting from suppliers to buyers, and it reframes today’s chip selloff. High memory prices are a windfall for SK Hynix and Micron and a cost for everyone downstream — Qualcomm is the first mega-cap to quantify that as guidance risk. A September price increase across smartphone silicon also puts upward pressure on consumer electronics prices at a time when three FOMC members are already voting to hike on inflation.
What It Means:Qualcomm is caught between a decelerating handset market and rising component costs, and the $40B non-handset target is a 2029 answer to a 2026 problem.
What to watch:Whether other handset-exposed names cite the memory crunch in guidance over the next two weeks — a pattern would confirm this as an industry cost shock rather than a Qualcomm execution issue.
BULLISH
24. Starbucks (SBUX): +7.88% AH | Global Comps Up 7.9% Against a 6% Estimate and Full-Year EPS Guidance Lifted Roughly 12%
The Numbers:Released: AMC. Fiscal Q3 comparable store sales +7.9% versus a 6% consensus, with North America +8.1% and International +5.7%. Revenue $9.32B versus $9.16B estimate, down 1% year over year owing to the sale of a controlling stake in the China business. Adjusted EPS $0.85 versus $0.66 estimate — a 29% beat. Fiscal 2026 adjusted EPS guidance raised to $2.55-2.65 from $2.25-2.45. Shares traded at $112.35 after hours, up 7.88%, at a 52-week high.
The Problem/Win:North American comps of +8.1% are the number that matters. Starbucks’ turnaround has been a two-year question about whether US store traffic and throughput could be restored, and 8.1% against a 6% consensus is a decisive answer. The 1% revenue decline is entirely a structural artefact of deconsolidating China following the Boyu Capital joint venture, not an operating deterioration — and it makes the reported comp growth more impressive, since it is being generated by a smaller, more US-weighted base. Raising the full-year EPS floor by 30 cents mid-year signals management confidence that the trajectory holds.
The Ripple:Eight percent US comps in a discretionary daily-purchase category cut directly against the consumer-weakness narrative running through this week’s Consumer Confidence miss and P&G’s zero volume growth. Coffee is a small-ticket, high-frequency purchase — exactly where trade-down shows up first if household budgets are tightening. It is not showing up. Chipotle also rallied on accelerating comparable sales today, giving two independent restaurant datapoints in the same direction.
What It Means:The US consumer is spending selectively rather than retrenching — weak on staples volume, strong on convenience and experience. That is a mix shift, not a downturn, and it argues against reading Consumer Confidence as a spending forecast.
What to watch:Whether transaction growth or ticket growth drove the 8.1% North American comp — traffic-led growth is durable, price-led growth is not.
BULLISH
25. Fortinet (FTNT): AH: n/a | Revenue Up 26%, Product Revenue Up 52%, Billings Up 33% and Full-Year Guidance Raised Sharply
The Numbers:Released: AMC. Q2 revenue $2.05B versus a $1.89B consensus, up 26% year over year. EPS $0.90 versus $0.75 estimate, a 20% beat. Product revenue $773M, up 52%. Billings +33%. Full-year 2026 guidance raised to EPS $3.41-3.47 from $3.10-3.16 and revenue to $8.02-8.18B (roughly 19% growth), with billings of $9.35-9.55B. Q3 guidance of $2.01-2.10B revenue and $0.83-0.87 EPS is above Street estimates of $1.95B and $0.76.
The Problem/Win:Product revenue up 52% is the standout. In network security, product revenue is the hardware and appliance refresh line — it is discretionary, it leads service revenue by several quarters, and it is the first thing customers defer when IT budgets tighten. Fifty-two percent growth means the opposite is happening. Billings up 33% against revenue up 26% confirms it in the forward book, since billings recognise contract value ahead of revenue. The guidance raise of roughly 30 cents at the EPS midpoint is unusually large for a mid-year revision.
The Ripple:Enterprise IT spending is not uniformly weak — it is being reallocated. Security budgets are expanding on an accelerating refresh cycle while other categories consolidate, which fits alongside Amphenol’s 55% growth and Microsoft’s accelerating Azure. The common thread across all three is infrastructure, and the common absence is anything consumer-facing.
What It Means:A 52% product revenue increase with a sharply raised full-year outlook makes this one of the strongest enterprise software prints of the season.
What to watch:Whether the refresh cycle shows up in peer security vendors’ billings over the coming weeks — if it does not, Fortinet is taking share rather than riding a category expansion.
WEEK AHEAD PREVIEW:
Q2 2026 earnings season is at roughly 27% reported and enters its heaviest stretch tomorrow, with the two largest companies in the index reporting on the same evening alongside the quarter’s key macro releases — Core PCE, advance Q2 GDP, personal income and spending, and initial jobless claims.
Apple (AAPL) — AMC, Thursday July 30 — Consensus $1.89 EPS on $109.04B revenue. The largest company in the index at roughly $4.97 trillion. Key focus: iPhone unit trajectory and gross margin guidance into a memory shortage that Qualcomm tonight quantified as a direct cost and supply constraint on handset OEMs — Apple is the largest such OEM, and its commentary is the definitive read on whether the memory crunch is an industry-wide margin event.
Amazon (AMZN) — AMC, Thursday July 30 — Consensus $1.82 EPS on $197.03B revenue. Key focus: AWS growth rate against Azure’s accelerating 43%, and 2027 capital expenditure guidance. Microsoft’s $255-260B FY2027 capex guide has reset the bar for what hyperscaler spending looks like; AWS growth that fails to keep pace with Azure would make the capex commitment harder to underwrite.
Mastercard (MA) — BMO, Thursday July 30 — Consensus $4.77 EPS on $9.06B revenue, implying roughly 14.9% earnings and 11.4% revenue growth. Key focus: cross-border volume as the cross-check on Visa’s +13%, plus value-added services growth. Mastercard has beaten consensus in each of the last four quarters.
Bristol Myers Squibb (BMY) — BMO, Thursday July 30 — Consensus approximately $1.59-1.61 EPS on $11.67B revenue. Key focus: whether the growth portfolio — Eliquis at roughly $3.3B and Opdivo at roughly $2.4B in Q1 — can outrun the legacy decline, with Revlimid, Pomalyst, Sprycel and Abraxane down about 6% year over year. Management’s $46-47.5B full-year revenue guidance depends on execution across 12 late-stage pipeline readouts.
Altria (MO) — BMO, Thursday July 30 — Consensus $1.50 EPS on $5.36B revenue, implying 4.2% earnings and 1.4% revenue growth. Key focus: net price realisation against continued cigarette shipment declines, and nicotine pouch competitive intensity — heightened promotional spending and mix pressure are expected to have weighed on segment margins. Guidance assumes NJOY ACE does not return to market in 2026.
Southern Company (SO) — BMO, Thursday July 30 — Consensus $1.00 diluted EPS, up 9.9% year over year. Key focus: data-centre load growth, which rose 42% in Q1, against today’s Caterpillar downgrade thesis that state and local regulatory intervention is a genuine threat to data-centre siting. Southern has 10GW fully contracted for large-load customers, a 75GW interest pipeline, and an $81 billion 2026-2030 capital plan predicated on that demand materialising.
Stryker (SYK) — AMC, Thursday July 30 — Consensus $3.46-3.49 EPS on approximately $6.56B revenue, up 8.9-9.1% year over year but decelerating from 11.1% in the year-ago quarter. Key focus: recovery of deferred Q1 orders, robotic surgery adoption and capital equipment order strength, with MedSurg and Neurotechnology net sales estimated at $3.59B.
Friday July 31 carries no >$100B US reporters on the current calendar; the session is dominated by the Employment Cost Index, Chicago PMI and final Michigan Consumer Sentiment. The next FactSet earnings scorecard update is also due July 31.
— US market commentary trusted by family offices and institutions. Apply for membership at join.recessionalert.comG. WHAT’S NEXT -> TOP
UPCOMING RELEASES:
| Date | Event | Why It Matters |
|---|---|---|
| Thu, Jul 30 | Core PCE Price Index — June (expected +0.2% MoM, +3.3% YoY; headline PCE +3.7% YoY) | The Fed’s preferred inflation gauge, landing one day after three members voted to hike. An upside surprise validates the dissent bloc and pulls a September hike from tail risk into base case; a soft print supports the “transitory” read that oil is doing the work. |
| Thu, Jul 30 | Q2 GDP Growth Rate QoQ, advance (expected +2.1%); GDP Price Index QoQ (expected +3.6%) | First read on Q2 growth and the cleanest test of how much business investment contributed after June durable goods missed on the headline while core ex-transport rose 11.0% YoY. The price index matters as much as the growth number given the committee’s split. |
| Thu, Jul 30 | Personal Income MoM (expected +0.3%) and Personal Spending MoM (expected +0.3%) | Consumer momentum into H2 with crude back above $84. Firm PCE alongside soft spending is the stagflationary combination that leaves the Fed with no clean option. |
| Thu, Jul 30 | Initial Jobless Claims (expected 200K) | Labour-market resilience has been the majority’s central argument that current policy is not too restrictive. A break higher would split the committee in the other direction. |
| Fri, Jul 31 | Employment Cost Index QoQ — Q2 (expected +0.8%) | The broadest measure of labour costs. An acceleration would establish a domestic wage component to inflation rather than an imported energy one, which is the difference between a hawkish minority and a hawkish majority. |
| Fri, Jul 31 | Chicago PMI (expected 56) | Regional manufacturing check after Richmond’s composite came in at 5 against roughly 10 expected, with new orders decelerating to 5 from 8. |
| Fri, Jul 31 | Michigan Consumer Sentiment, final (expected 54.0) | The embedded inflation-expectations series matters more than the headline with pump prices set to follow WTI’s 6.74% jump. Unanchored expectations are the one variable that would unify the committee behind a hike. |
| Sun, Aug 2 | OPEC+ meeting — September quota decision (roughly +188,000 bpd expected), plus the reported plan to freeze increases from October | Determines whether marginal barrels keep arriving while Hormuz stays impaired, commercial stocks sit at 2018 lows and the SPR sits at a 43-year low. A confirmed October freeze removes the last non-military source of supply relief. |
| Mon, Aug 3 | ISM Manufacturing PMI — July (first business day of August) | National read on whether the softening in regional new orders is broadening, and on how much of the AI-linked capex strength in core durable goods is offsetting weakness in traditional manufacturing. |
KEY QUESTIONS:
1. Does Thursday’s Core PCE validate the three dissenters or the “transitory” camp — and if it prints above +0.2%, does the dissent bloc grow from three to four in September, making a hike the base case rather than the tail?
2. With the SPR at a 43-year low and OPEC+ preparing to freeze output from October, what actually caps crude if the promised US retaliation touches Iranian energy infrastructure rather than proxy targets?
3. Index resilience has depended entirely on breadth outside technology — so if the data-centre power thesis de-rates industrials the way memory pricing has de-rated semiconductors, where does the rotation have left to go?
H. CHART OF THE DAY -> TOP
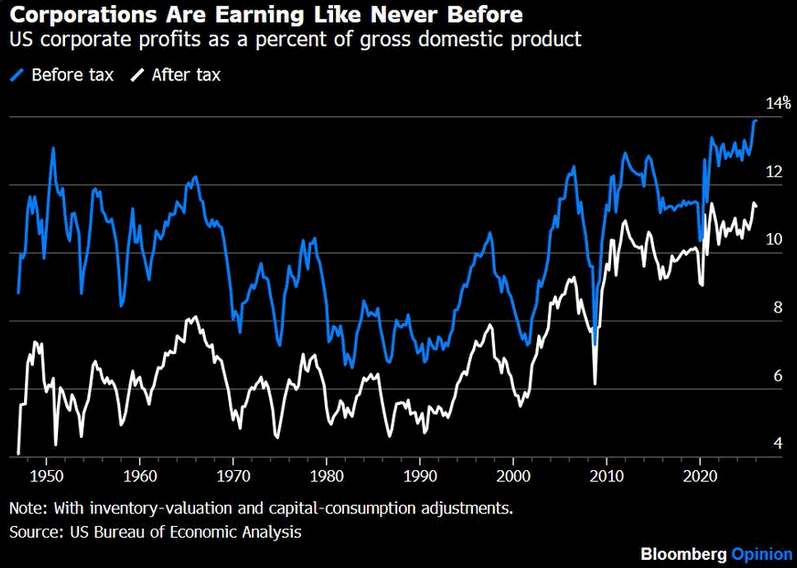
The state’s cut of corporate profit collapsed from better than half in the mid-1960s — six points of tax on eleven points of pretax profit — to under a fifth today, and that retreat alone explains roughly half of everything the white line has done. Had the effective take stayed where it sat in the early 1980s, the after-tax share would print near 7.4% of GDP instead of 11%. But tax explains only half, and the other half is stranger still, because this used to be the most reliably mean-reverting series in macro: 1950, 1966, 1997, 2006 — every peak surrendered within a few years to competition and wage bargaining. Since 2010 the before-tax line has not once broken 11% on the downside, and it now sits at 13.8%. Nothing operational holds it there. A $1.9tn federal deficit, 5.8% of GDP, gets spent and lands as somebody’s revenue with no matching cost — someone’s deficit is always someone’s receipt — and a debt-financed capex wave funded from outside the corporate sector does the same, one firm’s borrowed outlay arriving as another’s sales. The bill goes to the same households twice: through the price level already paid, and through future taxes landing on a wage base whose share of national income fell to 53.8%, the lowest since 1947. Every model normalizing margins to a mean has been wrong for fifteen years — for reasons one legislature can reverse in one session. This is not earning power. It is a subsidy that hasn’t been billed.
Market Intelligence Brief (MIB) Ver. 18.45
For professional investors only. Not investment advice.
© 2026 RecessionALERT.com

Comments are closed.