
MARKET INTELLIGENCE BRIEF (MIB)
Thursday, July 30, 2026
Wall Street erased Wednesday’s Fed-day rout: Nasdaq 100 +3.36%, S&P 500 +1.67%, VIX -17.33%. Microsoft surged 15.5% on 43% Azure growth; Meta sank 7.95%. Semis went vertical — Micron +18%, Lam +18%, AMAT +15%, AMD +13%. But Q2 GDP undershot at 1.5% with the price index spiking to 6.3%, and Dow Transports fell 1.74%. June core PCE cooled to 3.3%; jobless claims held at 197K. US strikes hit Iran overnight, yet crude closed lower and the dollar broke below 100.
TABLE OF CONTENTS
A. EXECUTIVE SUMMARY
B. MARKET DATA
C. HIGH-IMPACT STORIES (5)
D. MODERATE-IMPACT STORIES (5)
E. ECONOMY WATCH (5)
F. EARNINGS WATCH (13)
G. WHAT’S NEXT
H. CHART OF THE DAY
A. EXECUTIVE SUMMARY -> TOP
Equities executed a V-shaped reversal of Wednesday’s Fed-day rout, the Nasdaq 100 gaining 3.36% and the VIX collapsing 17.33% to 17.08 — a fear-unwind rather than a repricing, since the three-way hawkish FOMC dissent did not become less hawkish overnight. A cooler June PCE print (headline 3.7% from 4.1%, core 3.3%) removed the cleanest version of the hawkish case and trimmed discount-rate tail risk, which is how a 1.67% S&P rally coexisted with a Q2 GDP advance estimate of just 1.5% against 2.1% consensus and a GDP price index spiking to 6.3%. The rebound also held through overnight US strikes on dozens of IRGC sites, with crude closing lower after Saudi Arabia proposed a naval coalition. Breadth was the warning: seven of eleven sectors advanced but the gain was funded by dumping defensives, and Dow Transports fell 1.74% against the Dow’s +1.19% — a Dow Theory non-confirmation beneath a 600-point rally.
• Semiconductors reversed violently — MU +18.36%, LRCX +17.98% (best session since 1999), AMAT +14.97%, AMD +13.00%; Technology added 5.55% yet remains -5.23% over one month.
• Microsoft +15.51% on 43% Azure growth and FY2027 capex guided well above expectations; Meta -7.95% on its EPS miss and free-cash-flow collapse.
• Q2 GDP advanced at 1.5% vs 2.1% consensus with the GDP price index at 6.3% — a stagflationary mix, though final sales to private domestic purchasers still rose 3.9%.
• June core PCE eased to 3.3% and headline to 3.7% from 4.1%, but personal income rose just 0.2% against 0.3% spending — a second month of savings drawdown.
• Jobless claims came in at 197K versus 200K expected, keeping the “slow hire, slow fire” labor market intact; Atlanta Fed’s first Q3 GDPNow printed a noisy 5.0%.
• DXY broke below 100 to 99.86 (-0.94%) for a second session against rising yields, while gold rose 1.58% to $4,099.90, copper 2.99% and the 30-year touched a 19-year high near 5.23%.
1. A Positioning Unwind, Not a Re-Rating — Nothing in the day’s information set improved: the hawkish FOMC dissent stands, Q2 growth undershot and the GDP price index accelerated to 6.3%. What changed is that the market decided Wednesday’s news was already known rather than newly threatening. A 17.33% single-session VIX collapse rebuilds precisely the short-volatility exposure that made Wednesday’s air pocket possible, so the fear premium has been sold without the underlying policy risk being resolved.
2. The Index and the Economy Are Pricing Different Things — Copper at $6.50 (+2.99%, up 46% year-on-year) and a 5.55% Technology day price a multi-year AI power-infrastructure buildout; Dow Transports -1.74% and a 1.5% GDP print price physical throughput. Both readings are honest — one part of the economy is building furiously while the rest decelerates — but it leaves the index level supplied by a shrinking set of names, with the removal of the growth cushion raising the cost of a Fed policy error in either direction.
3. The Hedge Is Being Sold to Fund the Position It Hedges — Lilly -4.55%, J&J -3.66%, Philip Morris -3.25% and Walmart -2.73% fell without company-specific news, one day after Consumer Defensive led the week at +3.19%. This is a funding trade, not a change of view on staples fundamentals. The defensive complement meant to buffer a drawdown in concentrated growth exposure is being liquidated by the same flows inflating that exposure — leaving the ballast thinnest exactly when the position needing it is largest, and creating valuation improvement in high-quality cash generators for anyone willing to take the other side.
 — Leading economic indicators. Accurate market forecasts. Apply for membership at join.recessionalert.com
B. MARKET DATA -> TOP
Equities rebounded sharply from Wednesday’s Fed-driven selloff as Microsoft’s blowout earnings (+15% AH) and a resurgent semiconductor complex (MU +18%, LRCX +18%, AMAT +15%, AMD +13%) drove a concentrated tech rally — Nasdaq 100 +3.36% far outpaced the Dow’s +1.19%. Breadth was narrow: seven of eleven sectors advanced, but Communication Services (-2.26%, dragged by Meta’s post-earnings -7.95% slide), Consumer Defensive, Healthcare, and Real Estate all lagged as capital rotated toward AI-linked growth names. The clearest divergence: Dow Transports fell 1.74% even as Dow Industrials rose, with Q2 GDP slowing to 1.5% flagging softer underlying growth beneath the rally. VIX collapsed 17.33% as Wednesday’s Fed-hold fear unwound, while gold (+1.58%) and copper (+2.99%) firmed together — safe-haven and AI-driven industrial demand advancing side by side.
CLOSING PRICES – July 30, 2026:
MAJOR INDICES
S&P and Dow lag the Nasdaq’s 3.36% surge — this is a concentrated AI/semis story, not a broad rally. NYSE Composite’s modest 0.81% gain versus Nasdaq’s 3.36% confirms narrow leadership. Dow Theory non-confirmation emerges today: DJIA sits within 2% of its 10-session high while DJTA remains 7.6% below its own high, and today’s DJIA +1.19% vs DJTA -1.74% split — a nearly 3-point divergence — underscores transports failing to confirm industrial strength, likely reflecting today’s soft 1.5% Q2 GDP print. Large-cap/small-cap and growth/broad 10-session spreads remain within normal range.
| Index | Close | Change | %Move | Why It Moved |
|---|---|---|---|---|
| S&P 500 | 7,437.98 | +121.83 | +1.67% | Broad rebound from Wednesday’s Fed-hold selloff, led by AI/tech earnings |
| Dow Jones | 52,209.57 | +615.43 | +1.19% | Blue-chip gains capped by Transports and healthcare/defensive weakness |
| DJ Transportation | 21,089.0 | -372.8 | -1.74% | Lagged on soft Q2 GDP (+1.5%, below consensus) signaling growth concerns |
| Nasdaq 100 | 28,106.35 | +914.04 | +3.36% | Microsoft +15% AH earnings beat, semis rally (MU, LRCX, AMAT, AMD) |
| Russell 2000 | 2,944.97 | +38.66 | +1.33% | Tracked broad market rebound |
| NYSE Composite | 24,138.29 | +193.32 | +0.81% | Broad-based rebound, narrower gain than tech-heavy indices |
VOLATILITY & TREASURIES
VIX’s 17.33% collapse alongside rising 10Y (+5.1bps) and 2Y (+1.4bps) yields is a fear-unwind, not a growth-confidence signal — yields ticking up post-Fed-hold reflects reduced near-term cut odds, not economic optimism. The 2Y outpacing the 10Y in direction confirms rate-path repricing rather than a recession read. DXY’s -0.94% decline despite firmer yields is notable — risk-on equity flows outweighed rate support for the dollar today.
| Instrument | Level | Change | Why It Moved |
|---|---|---|---|
| VIX | 17.08 | -3.58 (-17.33%) | Fear unwind as risk appetite returned after Wednesday’s Fed-hold selloff |
| 10-Year Treasury Yield | 4.673% | +5.1 bps | Reduced near-term rate-cut odds following Fed hold |
| 2-Year Treasury Yield | 4.250% | +1.4 bps | Rate-path repricing after Fed held at 3.75% |
| US Dollar Index (DXY) | 99.86 | -0.94 (-0.94%) | Risk-on equity flows outweighed rate support |
COMMODITIES
Gold (+1.58%) and copper (+2.99%) rose together despite typically opposite drivers — safe-haven demand persisted even as risk assets rallied, while copper’s gain is a distinct AI-data-center and clean-energy demand story, not a recession hedge. Platinum’s outsized +4.19% move confirms broad-based precious/industrial metals strength. Bitcoin’s modest +1.42% tracked equities, suggesting no independent crypto catalyst today.
| Asset | Price | Change | %Move | Why It Moved |
|---|---|---|---|---|
| Gold | $4,099.90/oz | $+63.60 | +1.58% | Safe-haven bid persisted despite equity rally |
| Silver | $59.260/oz | $+1.171 | +2.02% | Tracked gold’s safe-haven bid |
| Copper | $6.5003/lb | $+0.1888 | +2.99% | AI data-center and clean-energy demand outlook |
| Platinum | $1,669.50/oz | $+67.20 | +4.19% | Broad-based precious/industrial metals strength |
| Bitcoin | $64,777.0 | $+910 | +1.42% | Tracked broad equity risk-on tone |
ENERGY
WTI (-1.08%) and Brent (-0.19%) both softened modestly and in tandem — a demand-side read consistent with today’s weaker 1.5% Q2 GDP print rather than a supply disruption. Natural gas (Henry Hub +0.69%) decoupled from crude entirely, while Dutch TTF was essentially flat, pointing to a US-specific gas driver rather than a global energy story. Oil falling while equities rallied is a demand-growth divergence worth watching.
| Asset | Price | Change | %Move | Why It Moved |
|---|---|---|---|---|
| Crude Oil (WTI) | $81.15/bbl | $-0.89 | -1.08% | Demand-side softening tied to weak Q2 GDP |
| Crude Oil (Brent) | $87.04/bbl | $-0.17 | -0.19% | Tracked WTI’s modest demand-side pullback |
| Natural Gas (Henry Hub) | $2.788/MMBtu | $+0.019 | +0.69% | Decoupled from crude on US-specific supply/demand |
| Natural Gas (Dutch TTF) | $20.38/MMBtu | $-0.01 | -0.03% | Essentially flat; European gas market steady |
S&P 500 SECTORS
Technology’s +5.55% 1-day surge is a sharp reversal from its -1.04% 1-week and -5.23% 1-month drawdown — a single-day AI/earnings-driven snapback, not trend continuation. Consumer Defensive, the week’s leader (+3.19% 1W), reversed hard today (-1.89%), confirming today’s move as pure risk-on rotation out of defensives. Communication Services extended its 1-month slide (-3.52%) with another -2.26% today, the session’s most persistent laggard.
| Sector | 1-Day | 1-Week | 1-Month | 3-Month | 6-Month | YTD | 12-Month |
|---|---|---|---|---|---|---|---|
| Technology | +5.55% | -1.04% | -5.23% | +7.65% | +14.01% | +17.16% | +26.16% |
| Basic Materials | +2.21% | +1.82% | +0.44% | -2.91% | -8.36% | +9.38% | +30.53% |
| Financial | +1.39% | +2.13% | +5.46% | +11.15% | +7.86% | +7.37% | +14.86% |
| Consumer Cyclical | +1.19% | +2.54% | -3.22% | -4.64% | -9.36% | -7.43% | -1.97% |
| Industrials | +1.17% | -2.67% | -9.36% | -1.17% | +2.33% | +10.27% | +12.86% |
| Energy | +0.99% | -0.45% | +11.44% | -1.10% | +18.25% | +32.03% | +33.70% |
| Utilities | +0.28% | -3.21% | -1.88% | -3.83% | +0.84% | +4.33% | +8.45% |
| Healthcare | -1.15% | +1.24% | +1.71% | +13.34% | +5.17% | +6.00% | +22.89% |
| Real Estate | -1.16% | +0.84% | +2.80% | +4.81% | +10.27% | +12.03% | +7.52% |
| Consumer Defensive | -1.89% | +3.19% | +2.41% | +1.33% | +2.85% | +8.87% | +6.95% |
| Communication Services | -2.26% | +1.29% | -3.52% | -7.68% | -6.52% | -4.70% | +12.17% |
TOP MEGA-CAP MOVERS:
GAINERS
| Company | Ticker | Close | Change | Why It Moved |
|---|---|---|---|---|
| Micron Technology Inc | MU | 874.66 | +18.36% | Semis/memory rally on AI capex demand following Microsoft’s guidance beat |
| Lam Research Corp | LRCX | 297.72 | +17.98% | Extending yesterday’s AH pop on raised 2026 WFE outlook to $140B |
| Microsoft Corp | MSFT | 451.10 | +15.51% | Azure growth accelerated to 43%, FY2027 capex guided well above expectations |
| Applied Materials Inc | AMAT | 501.77 | +14.97% | Riding the same semis-equipment demand wave as Lam Research |
| Advanced Micro Devices Inc | AMD | 485.39 | +13.00% | AI/GPU demand tailwind from broader semis rally |
DECLINERS
| Company | Ticker | Close | Change | Why It Moved |
|---|---|---|---|---|
| Meta Platforms Inc | META | 539.03 | -7.95% | Yesterday’s AH EPS miss and free-cash-flow collapse on rising capex |
| Eli Lilly & Co | LLY | 1,154.97 | -4.55% | Defensive/healthcare rotation as capital shifted to AI-linked growth names |
| Johnson & Johnson | JNJ | 255.82 | -3.66% | Defensive/healthcare rotation as capital shifted to AI-linked growth names |
| Philip Morris International Inc | PM | 192.00 | -3.25% | Consumer Defensive rotation out of staples on broad risk-on rally |
| Walmart Inc | WMT | 111.10 | -2.73% | Consumer Defensive rotation out of staples on broad risk-on rally |
— Institutional-grade intelligence for serious investors. Apply for membership at join.recessionalert.comC. HIGH-IMPACT STORIES -> TOP
BULLISH
1. Equities Execute a V-Shaped Reversal of the Fed-Day Rout — the Nasdaq 100 Gains 3.36% and the VIX Collapses 17.33% in a Single Session
The core facts:One session after the worst day since April 2025, the major averages reversed hard. The Nasdaq 100 rose 3.36% to 28,106.35, the S&P 500 gained 1.67% to 7,437.98 and the Dow added 1.19%, or 615 points, to 52,209.57, recovering more than half of Wednesday’s 1,152-point decline. The VIX fell 3.58 points, or 17.33%, to 17.08 — surrendering the entire fear premium built into Wednesday’s Fed-hold selloff and then some. Leadership was narrow and mechanical: the Nasdaq’s gain was more than four times the NYSE Composite’s 0.81%, and seven of eleven S&P sectors advanced while Communication Services fell 2.26%, Consumer Defensive 1.89%, Real Estate 1.16% and Healthcare 1.15%. The rebound held despite fresh US strikes on Iran overnight, a Q2 GDP print that undershot consensus, and Treasury yields that rose across the curve.
Why it matters:The speed of the reversal tells you what Wednesday’s selloff actually was. A 17.33% single-day VIX collapse is not how markets behave when a repricing has occurred; it is how they behave when a positioning shock unwinds. The three-way hawkish FOMC dissent did not become less hawkish overnight — what changed is that the market decided the information was already known rather than newly threatening. That distinction matters for risk budgeting, because a fear-unwind rally rebuilds the same short-volatility exposure that made Wednesday’s air pocket possible in the first place. The more durable read is in the composition. This was not a broad recovery: it was a rotation into a single theme, funded by selling everything defensive. When the Nasdaq outpaces the NYSE Composite by more than four to one and staples, healthcare, real estate and communication services all finish red on a 1.67% index day, the index level is being supplied by a shrinking set of names. That is a fragile configuration — it works while the AI-capex narrative holds and offers no ballast if it does not.
What to watch:Whether the VIX can hold below 17 into next week — a re-expansion above 20 without a new catalyst would confirm Wednesday’s spike as regime rather than noise. Watch also whether breadth broadens: a second consecutive session of gains led by the Nasdaq alone would mark the rally as narrow and vulnerable.
BULLISH
2. The Semiconductor Complex Reverses in One Session — Micron +18.36%, Lam +17.98%, Applied Materials +14.97% — as Technology Adds 5.55% and Undoes Most of July’s Drawdown
The core facts:Technology was the best-performing S&P sector by a wide margin at +5.55%, against a sector one-month return that had stood at -5.23% going in. Memory and equipment names led: Micron closed +18.36% at $874.66, Lam Research +17.98% at $297.72 — its best session since 1999 — Applied Materials +14.97% at $501.77 and AMD +13.00% at $485.39. Intel and Marvell each rose roughly 13%, TSMC about 7% and Nvidia about 3%; SanDisk gained roughly 26% after Samsung warned the memory shortage could persist into 2028. Nvidia’s Jensen Huang described demand as “through the roof.” The move follows a semiconductor drawdown that had taken the SOXX ETF down roughly 23% month-to-date, on pace for its worst month since 2021, and it comes 24 hours after the Nasdaq 100 confirmed a technical correction on an SK Hynix-driven $1 trillion global chip selloff.
Why it matters:Yesterday the market punished a memory maker for posting record revenue and profit, because the bar had moved from delivery to acceleration. Today it paid 18% for the opposite signal — confirmation that hyperscaler capital expenditure is still climbing. Both sessions are the same trade expressed in opposite directions, and that is the point: semiconductors are no longer being valued on their own earnings but as a leveraged claim on a single macro variable, the durability of AI infrastructure spending. A sector that round-trips 20% in 48 hours on capex commentary has effectively become a sentiment instrument, and instruments of that kind carry realised volatility far above what index-level position sizing usually assumes. The constructive reading is that the July drawdown was a financing scare rather than a demand break — the equipment names, which sit closest to actual order books, led the recovery, and the memory shortage narrative extending to 2028 lengthens the visible cycle rather than shortening it. The caution is symmetry: the same concentration that delivered a 5.55% sector day will deliver its mirror image on the first capex disappointment, and the sector remains down 5.23% over one month despite today’s surge.
What to watch:Whether memory pricing commentary from the next round of supplier updates corroborates the 2028 shortage claim, or whether it proves to be a single vendor’s view. Watch the SOXX ETF’s ability to recover its 50-day moving average — a failed retest would mark today as a bear-market rally within the July downtrend.
UNCERTAIN
3. The US Retaliation Lands — a “Heavy Wave” of Strikes on Dozens of IRGC Sites — Yet Crude Closes Lower as Saudi Arabia Proposes a Naval Coalition
The core facts:US Central Command said American forces began striking Iran at 8:00 p.m. EDT Wednesday, launching what it described as a major wave of strikes on dozens of Islamic Revolutionary Guard Corps sites in retaliation for Tuesday’s ballistic missile attack on US forces in Jordan. Iran’s Revolutionary Guard responded Thursday that it “will punish the aggressor today” and warned that states assisting the US would “receive a harsh response.” Crude spiked in the overnight session — Brent traded above $92 — and then gave the move back entirely: WTI settled at $81.15, down 1.08%, and Brent at $87.04, down 0.19%, after Saudi Arabia proposed a naval coalition to protect shipping lanes coming under attack in the Red Sea and the Strait of Hormuz. Energy was nonetheless the fifth-best S&P sector at +0.99%. Contract rollover expiries contributed to the intraday distortion.
Why it matters:This is the first session of the five-month conflict in which a genuine escalation produced a lower crude close, and the reason is the single most important development of the day for energy risk. A Saudi-led naval coalition is a supply-protection mechanism rather than a diplomatic one — it does not require Iranian consent, which is precisely why the market took it seriously after Tehran rejected Oman’s joint-management framework 48 hours earlier. If it materialises, it partially decouples the crude price from the escalation ladder, because tanker transit becomes a function of escort capacity rather than of Iranian forbearance. For a US portfolio that changes the shape of the energy hedge: the risk premium moves from a step function tied to headlines toward a slower variable tied to naval logistics. The offsetting consideration is that Iran has now committed publicly to same-day retaliation, and a strike on Gulf infrastructure or on coalition shipping would reprice the entire complex instantly. What the tape is saying is not that the conflict is de-escalating — it is that the market now believes the chokepoint can be policed. That belief is untested.
What to watch:Whether the Saudi naval coalition attracts formal US and Gulf commitments within the next week, and whether Hormuz transit counts recover from the depressed levels recorded in mid-July. Watch WTI’s $80 level — a break below it would confirm the market is pricing the chokepoint as reopening.
BEARISH
4. Q2 GDP Undershoots at 1.5% and the Transports Refuse to Confirm — a Dow Theory Non-Confirmation Opens Beneath a 600-Point Dow Rally
The core facts:The advance estimate of second-quarter GDP came in at 1.5% annualised against a 2.1% consensus — Section E carries the composition and the price-index detail. The market response was a clean split. The Dow Jones Industrial Average rose 1.19% to 52,209.57 while the Dow Jones Transportation Average fell 1.74%, or 372.8 points, to 21,089.0 — a divergence of nearly three percentage points in a single session. The DJIA now sits within 2% of its ten-session high while the DJTA remains 7.6% below its own. Crude softened on the same demand read, WTI closing down 1.08%. Industrials managed +1.17% on the sector tape, but that gain trailed Technology’s 5.55% by more than four points and follows a one-month sector return of -9.36%.
Why it matters:The forward implication of a 1.5% print is not recession — it is the removal of the growth cushion that has allowed this market to tolerate a Fed with three voting members pushing for a hike. At 2%-plus growth, sticky inflation is an inconvenience; at 1.5%, it is the first half of a stagflationary configuration, and it materially raises the cost of a policy error in either direction. The committee that dissented hawkishly on Wednesday now has to weigh those dissents against a growth number that arrived one day later. The Transports signal is the part a portfolio manager should not wave away. Freight and logistics price physical throughput, not narrative, and the DJTA’s refusal to confirm a 600-point Dow rally on the same day GDP undershot is the cleanest available evidence that the real economy is decelerating beneath an index level being carried by six or seven semiconductor names. Dow Theory non-confirmations resolve in one of two directions, and they resolve slowly — but the asymmetry is unattractive here, because the confirming leg would require transports to rally on softening freight demand and lower crude throughput.
What to watch:Whether the DJTA can close back within 5% of its ten-session high in the next fortnight — failure to do so entrenches the non-confirmation. Watch the second estimate of Q2 GDP for revisions to the consumer-spending contribution, the component doing all the work in this print.
UNCERTAIN
5. The Dollar Breaks Below 100 While Yields and Gold Rise Together — a Second Consecutive Session in Which the Safe-Haven Bid Skipped the Dollar
The core facts:The US dollar index fell 0.94% to 99.86, closing below the 100 handle, on a session in which the 10-year Treasury yield rose 5.1 basis points to 4.673% and the 2-year rose 1.4 basis points to 4.250%. Gold gained 1.58% to $4,099.90 an ounce, silver 2.02% and platinum 4.19%. This is the second consecutive session in which the dollar has declined against rising US yields — it fell 0.47% on Wednesday as the 30-year reached a 19-year high. Equities rallied 1.67% at the index level on the same day, and the VIX fell 17.33%.
Why it matters:Yesterday the dollar’s failure to bid could be dismissed as positioning in a one-day risk-off shock. Repeating it on a risk-on day, through a psychologically significant round number, with gold up 1.58% at the same time, is a different proposition. Rising yields normally attract foreign capital; they only fail to when the market judges that the yield increase compensates for inflation rather than reflecting real return. Gold and silver rallying alongside — real-asset hedges, not rate hedges — points in the same direction, and platinum’s 4.19% move suggests the bid is broadening across the metals complex rather than sitting in one instrument. There are three practical consequences for a US portfolio. Unhedged international equity exposure has now picked up two consecutive sessions of currency tailwind. Import costs face upward pressure at exactly the moment a hawkish minority on the FOMC is arguing that inflation is not yet contained. And translation effects turn favourable for multinationals into the next reporting cycle, which flatters reported earnings without improving underlying economics. The honest caveat is that two sessions do not establish a trend, and DXY at 99.86 sits at the lower edge of its recent range rather than beyond it.
What to watch:Whether DXY sustains a close below 100 for a third consecutive session — that would convert a positioning read into a credibility read. Watch gold’s ability to hold above $4,000, a level it has now cleared decisively two days running.
— Quantifying recession risk so you don’t have to guess. Apply for membership at join.recessionalert.comD. MODERATE-IMPACT STORIES -> TOP
BULLISH
6. Copper Adds 2.99% to $6.50/lb and Is Now Up 46% Year-on-Year — the Metals Complex Is Pricing the Same Data-Centre Buildout as the Semis
The core facts:Copper rose 2.99% to $6.5003 a pound, extending a twelve-month gain of roughly 46%. The move came without a single-day catalyst — no supply disruption, no inventory shock — and was attributed to the structural demand outlook from AI data-centre construction and clean-energy transmission buildout. Basic Materials was the second-best S&P sector on the day at +2.21%, behind only Technology. Silver added 2.02% and platinum 4.19% in the same session.
Why it matters:Copper’s function in a portfolio is as an independent read on physical activity, and that is precisely what makes today’s move worth separating from the equity tape. The semiconductor rally is a claim on capital expenditure intentions; copper at $6.50 is a claim on the electrical infrastructure those intentions require — substations, transmission, switchgear, cabling — and that spend is far harder to defer or cancel than a chip order. A 46% twelve-month move without a supply story is the market pricing a multi-year power-infrastructure cycle rather than a cyclical restock. The read-through runs to industrial and electrical-equipment names, to the utilities financing load growth, and to anyone whose input cost structure is copper-intensive — construction, autos, appliances and grid contractors face a margin headwind that does not reverse when the AI narrative cools. Note the tension with the day’s other signals: copper rising 2.99% while the Transports fell 1.74% and Q2 GDP undershot is not a coherent picture of aggregate demand. It is a picture of one part of the economy building furiously while the rest decelerates.
What to watch:Whether copper holds above $6.50 — a level that has acted as resistance rather than support in recent months. Watch LME and Comex inventory draws for confirmation that this is physical demand rather than financial positioning.
UNCERTAIN
7. Defensives Are Dumped Wholesale to Fund the Tech Bid — Eli Lilly -4.55%, Johnson & Johnson -3.66%, Philip Morris -3.25%, Walmart -2.73%
The core facts:Four of the day’s five largest mega-cap decliners were defensive names sold without company-specific news. Eli Lilly fell 4.55% to $1,154.97, Johnson & Johnson 3.66% to $255.82, Philip Morris 3.25% to $192.00 and Walmart 2.73% to $111.10. At the sector level, Consumer Defensive fell 1.89% — reversing hard after leading the week with a +3.19% five-day return — Real Estate fell 1.16% and Healthcare 1.15%, the latter despite a +13.34% three-month run. All of this occurred on a session when the S&P 500 gained 1.67%.
Why it matters:Defensive sectors falling on a strong tape is ordinary; falling this hard, in these names, one day after they were the market’s only shelter is not. Consumer Defensive was the best-performing sector of the week going into today and gave back more than half of that in a session — which identifies the move as a funding trade rather than a change of view on staples fundamentals. Capital was raised where it had recently worked in order to be deployed where the momentum now is. The consequence for portfolio construction is uncomfortable. The defensive complement is the part of the book that is supposed to buffer a drawdown in the concentrated growth exposure, and it is being liquidated by the same flows that are inflating that exposure — which means the hedge is weakest at precisely the moment the position it hedges is largest. Rotations of this kind also tend to overshoot in both directions, so today’s damage in high-quality, cash-generative names is a valuation improvement rather than a fundamental deterioration. What it is not is a signal about consumer health: nothing in the day’s data told you anything new about staples demand.
What to watch:Whether the defensive sectors stabilise within two or three sessions — persistent selling into a flat tape would signal genuine de-rating rather than rotation. Watch Consumer Defensive’s one-month return, currently +2.41%, for a break into negative territory.
BEARISH
8. Jersey Mike’s Raises $1 Billion and Breaks Issue Immediately — the Largest US Consumer IPO of 2026 Opens 8.7% Below Its Price
The core facts:Jersey Mike’s Subs priced 43,478,261 Class A shares at $23 — the midpoint of a $21-to-$25 marketed range — raising approximately $1 billion at a $7.3 billion valuation, with a 30-day greenshoe of 6,521,739 shares. The book was reported roughly ten times oversubscribed. The stock nonetheless opened at $21 on the NYSE under the ticker JMKE, 8.7% below the issue price, and traded down through the session, closing around 6% lower and valuing the company near $6.7 billion. Blackstone retains voting control post-listing. It is the largest US consumer IPO of 2026 and one of the largest restaurant listings since the pandemic.
Why it matters:A ten-times-covered book that breaks issue on the open is a specific and unflattering signal about the quality of demand behind new consumer paper. Oversubscription measures indications of interest; the first hour of trading measures conviction, and the gap between the two here was 8.7%. That the pricing landed at the midpoint of the range, and that pre-deal reporting had floated valuations well above the $7.3 billion achieved, points the same way — the deal was cut to clear rather than priced into strength. For a portfolio manager the relevance is twofold. It marks the ceiling on private-market consumer valuations more credibly than any comparable transaction this year, which matters for anyone holding sponsor-backed consumer assets marked against public multiples. And it tests the reopening of the IPO window in a non-technology sector: capital markets have been absorbing AI-adjacent issuance readily, and this is evidence that the same appetite does not extend to a well-run sandwich franchise. The dual-class structure keeping Blackstone in control will not have helped, and it is a feature of a large share of the pending sponsor-backed pipeline.
What to watch:Whether JMKE recovers the $23 issue price within its first month — failure to do so typically freezes comparable consumer listings for a quarter. Watch whether the greenshoe is exercised, the cleanest read on underwriter support.
UNCERTAIN
9. Two of America’s Largest Industrial Unions Petition the USTR to Reverse the Canada Tariff Regime Three Weeks Before 50% Duties Take Effect
The core facts:United Steelworkers International President Roxanne Brown and IAM International President Brian Bryant sent a joint letter to US Trade Representative Jamieson Greer urging him to reconsider trade enforcement against Canada, which became public in wire coverage today. The letter describes the relationship as “marked more by division than co-operation,” states that “Canada has never been the problem,” and asks that instead of further duties under Section 338 or any other mechanism the US work with Canada to curb illegal trade practices. The unions also call for strategic investment in steel, aluminium, forestry and manufacturing, including a new structural beam line at Algoma Steel for defence and infrastructure work. The backdrop is the Section 338 proclamations of 20 July, which impose 50% duties on Canadian motor vehicles, alcohol and dairy effective 19 August, with no USMCA-originating exemption.
Why it matters:The identity of the petitioners is the story. Steelworkers and machinists are the constituency tariffs are ordinarily justified by, and their public opposition removes the domestic-labour rationale from a specific action three weeks before it binds. That materially raises the probability of carve-outs, delay or a negotiated climbdown — an outcome not currently reflected in the pricing of the most exposed names. The 19 August date is what makes this actionable rather than rhetorical. A 50% duty on Canadian motor vehicles with no USMCA exemption cuts across integrated North American assembly footprints that cannot be re-sourced in three weeks; the alcohol and dairy lines hit consumer-staples supply chains already absorbing input inflation. Auto OEMs and suppliers with Ontario assembly exposure, US beverage distributors and rail and trucking operators on cross-border lanes all carry direct exposure to whether this proclamation takes effect as written. The uncertainty is genuine: a union letter is an input to a decision, not the decision, and the administration has not signalled a change of course.
What to watch:Any USTR response or Federal Register amendment before 19 August — exemption language for USMCA-originating vehicles is the specific item to look for. Watch whether Canadian producers announce pre-tariff shipment pull-forward, which would inflate July and August cross-border volumes and then reverse.
BULLISH
10. Headline PCE Inflation Falls to 3.7% From 4.1% — the Disinflation Leg the Hawkish Dissenters Did Not Have on Wednesday
The core facts:June personal income and outlays showed the headline PCE price index falling on the month, with the annual rate easing to 3.7% from 4.1% in May and the core measure at 3.3%. Section E carries the full data, including the personal income and spending detail. The market layer: equity futures firmed on the release before the cash open, the dollar index closed down 0.94% at 99.86, and the front end of the curve barely moved — the 2-year yield rose just 1.4 basis points to 4.250% against the 10-year’s 5.1 basis points to 4.673%.
Why it matters:The timing is what gives this print its weight. Three FOMC members voted on Wednesday for a hike on the argument that inflation is not converging; the following morning the Fed’s own preferred gauge printed four-tenths lower on the headline year-over-year rate. That does not settle the argument — 3.3% core remains well above a 2% target that Chair Warsh has explicitly refused to soften — but it removes the cleanest version of the hawkish case and makes a September hike harder to justify without fresh deterioration. The bond market’s response is the tell: the front end, which prices the policy path, was almost unchanged, while the long end did the moving. Investors took the inflation news as marginally reassuring for the next two meetings and irrelevant to the decade. For equities the practical effect is a modest reduction in the discount-rate tail risk that has been the principal constraint on multiples since Wednesday, which is part of why a 1.67% rally could coexist with a soft GDP print. The constraint is that inflation at 3.7% headline, with crude having spent the quarter in the $80s and a hawkish minority on the committee, leaves very little margin for a single hot print to reverse the entire read.
What to watch:Whether core PCE breaks below 3.2% on the next print — that would be the first sustained move toward the Fed’s target since the Middle East conflict began. Watch the 2-year yield: a decisive break below 4.20% would confirm the market has downgraded September hike risk.
— Separating signal from noise since 2007. Apply for membership at join.recessionalert.comE. ECONOMY WATCH -> TOP
Q2’s GDP report delivered a stagflationary jolt: growth undershot at 1.5% versus 2.1% expected while the GDP price index spiked to 6.3%, even as the Fed’s preferred Core PCE gauge kept cooling to 3.3% YoY and personal income growth slowed to just 0.2%. Jobless claims held near five-decade lows at 197K, underscoring labor resilience even as growth momentum fades. The divergence leaves Chairman Warsh under fresh credibility pressure — bond markets pushed 30-year yields to a 19-year high this week on skepticism that “tough talk” curbs inflation without action. Atlanta Fed’s initial Q3 GDPNow nowcast jumped to 5.0%, though the reading carries minimal data and should be read cautiously.
U.S. Q2 GDP Growth Slows to 1.5%, Missing Estimates as Price Index Spikes to 6.3% (CNBC / BEA, July 30, 2026)
What they’re saying:The U.S. economy expanded at a 1.5% annualized rate in Q2, well below the 2.1% consensus estimate. The miss was driven by a 0.7% drop in inventories and a 0.3% decline in federal government spending, while the GDP price index — a broader inflation gauge than PCE — surged to 6.3% versus 3.6% expected and 3.6% prior.
The context:Decelerating growth paired with an accelerating price index is a textbook stagflationary signal, complicating the Fed’s already-divided policy path one day after Chairman Warsh’s FOMC held rates amid a record three-way hawkish dissent. Underlying demand held up better than the headline suggests — final sales to private domestic purchasers rose a solid 3.9% — but the price index reading keeps inflation hawks on the committee vocal.
What to watch:The second GDP estimate (August 28) for whether the price index reading holds; Q3 advance GDP in late October.
Fed’s Preferred Inflation Gauge Cools to 3.3% in June, But Personal Income Growth Slows Sharply (BEA / CNN, July 30, 2026)
What they’re saying:Core PCE — the Fed’s preferred inflation gauge — rose just 0.1% in June, pulling the annual rate down to 3.3% from 3.4% in May and matching consensus. Headline PCE cooled to 3.7% YoY from 4.1%. But personal income rose just 0.2% (below the 0.3% forecast and a sharp deceleration from May’s 0.7%), while spending grew 0.3% — consumers are increasingly drawing down savings to sustain outlays.
The context:The cooling core reading gives the Fed room to argue disinflation is intact, but the income slowdown — spending outpacing income for a second straight month — raises questions about how long consumers can keep propping up growth without an income rebound.
What to watch:July income and spending data (due late August); the personal savings rate trend.
Jobless Claims Rise Less Than Expected to 197K as Labor Market Holds “Slow Hire, Slow Fire” Pattern (Reuters / Labor Department, July 30, 2026)
What they’re saying:Initial jobless claims rose 9,000 to a seasonally adjusted 197,000 for the week ended July 25, below the 200,000 consensus and only partially unwinding the prior week’s plunge to the lowest level since late 1969.
The context:Economists characterized the labor market as remaining in a “slow hire, slow fire” mode — employers aren’t aggressively cutting staff even as hiring stays muted. Auto-sector plant-schedule volatility added noise to the print but didn’t change the underlying resilience read.
What to watch:Continuing claims (1,782K, still elevated); the August 1 nonfarm payrolls report.
Atlanta Fed’s Initial Q3 GDPNow Nowcast Jumps to 5.0% Even as Q2 Growth Disappoints (Atlanta Fed, July 30, 2026)
What they’re saying:The Atlanta Fed’s GDPNow model put its first Q3 2026 real GDP growth estimate at 5.0% on July 30, a sharp jump from the 1.5% Q2 advance reading released the same morning.
The context:Initial-quarter GDPNow readings are based on minimal incoming data and are historically volatile, often swinging by multiple percentage points as more releases arrive. A 5.0% initial print should not be read as a reliable growth signal yet, but the divergence from Q2’s miss illustrates how noisy the underlying growth picture remains.
What to watch:GDPNow updates through August and September as retail sales, trade balance, and inventory data feed the model.
Warsh’s Inflation Credibility Tested as Bond Market Demands Action, Not Just Words (CNBC / Bloomberg, July 29-30, 2026)
What they’re saying:A day after the FOMC’s 9-3 vote to hold rates — with three members dissenting in favor of a hike — 30-year Treasury yields jumped as much as 14 basis points to nearly 5.23%, a 19-year high, as investors questioned whether Chairman Warsh’s hawkish rhetoric would translate into action. Former St. Louis Fed President James Bullard said Warsh’s messaging “has been very effective” but warned markets will soon “demand action.”
The context:The credibility gap matters because unanchored long-end yields raise borrowing costs across the economy independent of what the Fed does with the funds rate — a self-reinforcing tightening channel the Fed doesn’t fully control. Warsh has publicly committed that “this Fed will not waver,” but the bond market’s skepticism is itself a policy-relevant signal.
What to watch:Whether 30-year yields keep climbing into the next FOMC meeting; any incremental Fed communication on the hike option.
— Know the probability before the market prices in the risk. Apply for membership at join.recessionalert.comF. EARNINGS WATCH -> TOP
YESTERDAY AFTER THE BELL (Markets Reacted Today)
BULLISH
11. Microsoft (MSFT): +15.51% | Azure Accelerates to 43% and Capex Guidance Becomes the Market’s Bull Case
The Numbers:Released: AMC, 29 July. Azure revenue growth accelerated to 43% and the cloud business surpassed $100 billion in annual revenue. FY2027 capital expenditure was guided to $255-260 billion, well above the roughly $220 billion analysts had modelled. The stock closed at $451.10, up 15.51%, after a 3%-plus after-hours move on the release itself.
The Problem/Win:Accelerating growth at $100 billion scale is the rarest thing in enterprise software, and it reframed the capex number entirely. A $255-260 billion guide would ordinarily be read as margin destruction; against 43% Azure growth it was read as evidence that the spend is demand-led. Bloomberg reported a single-day market value gain of roughly $490 billion — a record one-day increase and the stock’s best session since 2008.
The Ripple:This single report supplied most of the day’s index return and the entire semiconductor rally. Micron closed +18.36%, Lam Research +17.98%, Applied Materials +14.97% and AMD +13.00%; the Technology sector gained 5.55% and the Nasdaq 100 3.36%. The capex line, not the revenue line, is what the memory and equipment complex traded on.
What It Means:The AI capital-expenditure cycle has a credible anchor tenant again, and the market has reverted to rewarding spend rather than punishing it. The concentration risk is unchanged — one company’s guidance now sets the multiple for an entire supply chain.
What to watch:Whether Amazon’s AWS print corroborates the hyperscaler demand read tonight. Watch Azure’s constant-currency growth in the next quarter for evidence that 43% is a trend rather than a comparison effect.
BEARISH
12. Meta Platforms (META): -7.95% | Revenue Up 28% and the Stock Still Falls — Free Cash Flow Is the Only Number That Mattered
The Numbers:Released: AMC, 29 July. Revenue rose 28% to $60.80 billion, comfortably ahead of consensus, but adjusted EPS missed by 13% and free cash flow collapsed to $784 million as artificial-intelligence capital expenditure scaled. The stock fell roughly 5% after hours on the release and extended the decline to close at $539.03, down 7.95%, on Thursday.
The Problem/Win:A near-total collapse in free cash flow at a company that generated it prodigiously is a balance-sheet event, not an operating one. Investors are not disputing that Meta can grow revenue at 28%; they are disputing whether multi-billion-dollar consumer-AI spending has any demonstrated path to monetisation, and the cash flow line is the first place that doubt becomes measurable.
The Ripple:Meta was the single largest contributor to Communication Services’ 2.26% decline, the worst-performing S&P sector on a day the index rose 1.67%. The contrast with Microsoft is the market’s clearest statement of the year on AI spending: identical capex direction, opposite share-price outcomes, separated entirely by whether the spend has an enterprise revenue line attached.
What It Means:Consumer-AI capex now carries a valuation penalty and enterprise-AI capex a premium. Any platform spending at hyperscaler scale without a corresponding cloud or subscription revenue stream should be assumed to face the same multiple compression.
What to watch:Whether management provides a free-cash-flow trough estimate or a monetisation timeline before the next report. Watch whether the stock stabilises above $520, roughly its post-selloff support.
BULLISH
13. Lam Research (LRCX): +17.98% | Best Session Since 1999 on a Raised $140 Billion WFE Outlook
The Numbers:Released: AMC, 29 July. Revenue rose 30% year-on-year and management raised its 2026 wafer-fab-equipment industry outlook to $140 billion with an upside bias. The stock had fallen 6.40% in Wednesday’s regular session ahead of the print, gained 5.91% after hours, and then closed Thursday at $297.72, up 17.98% — its strongest single session since 1999.
The Problem/Win:The WFE outlook is the operative number. Equipment orders sit closest to committed fab capital plans, so a raised industry forecast with upside bias is a harder datapoint than any single customer’s guidance — it aggregates what the whole industry has actually budgeted rather than what one buyer says it intends.
The Ripple:Applied Materials, the closest comparable, rose 14.97% without reporting. Micron gained 18.36% and SanDisk roughly 26% as the memory complex repriced; the whole group had entered the session with the SOXX ETF down around 23% month-to-date.
What It Means:The July semiconductor drawdown was a financing and sentiment scare rather than an order-book break. Equipment names offer the cleanest exposure to that distinction, since their revenue is recognised against capacity already committed.
What to watch:Whether peer equipment makers corroborate the $140 billion WFE figure in their own guidance. Watch Lam’s deferred revenue and backlog disclosure for confirmation the raise is order-backed.
UNCERTAIN
14. Qualcomm (QCOM): -7% | The One Semiconductor Name Left Behind by the Sector’s Best Day of the Year
The Numbers:Released: AMC, 29 July. Adjusted EPS of $2.21 came in just below the $2.23 consensus. Revenue beat but declined 4% year-on-year, with EPS down 20%. Guidance was clouded by memory supply constraints and announced price increases effective 1 September. Shares fell more than 7% on Thursday after a roughly 4% after-hours decline.
The Problem/Win:Qualcomm is on the wrong side of the memory shortage that lifted every other chip name today. Rising memory input costs compress handset-chipset margins, and passing them through via September price increases risks volume in a smartphone market that is not growing. Revenue down 4% with EPS down 20% is operating deleverage, not a demand story.
The Ripple:The divergence is the signal: Qualcomm fell 7% on a day Micron rose 18.36% and the Technology sector gained 5.55%. Memory scarcity is a windfall for suppliers and a tax on consumers of memory — a distinction the market applied with unusual precision today, and one that extends to handset, automotive and edge-device silicon generally.
What It Means:The AI-memory cycle creates losers as well as winners inside the same index. Positioning that treats semiconductors as one exposure will carry unintended short exposure to memory-consuming names.
What to watch:Whether the 1 September price increases hold without volume loss — handset sell-through data in October is the first read. Watch memory contract pricing for evidence the input cost pressure is peaking.
BULLISH
15. Starbucks (SBUX): +3.7% | Fourth Consecutive Quarter of Comparable-Sales Growth and a Second Straight Guidance Raise
The Numbers:Released: AMC, 29 July. Fiscal Q3 revenue of $9.32 billion topped the $9.16 billion consensus and adjusted EPS of $0.85 beat the $0.66 estimate by 29%. Global comparable store sales rose 7.9% against 5.7% expected, with North America up 8.1%. Full-year guidance was raised across the board for a second consecutive quarter, lifting FY2026 EPS guidance roughly 12%. Shares rose more than 5% after hours and closed Thursday around $107, up 3.7%; the stock is up roughly 26% year-to-date.
The Problem/Win:The composition of the comp beat is what validates the turnaround. Growth came from higher transactions — traffic, not price — supported by drink customisation and a stronger food mix. North America operating margins expanded for the first time in more than two years, which is the metric that separates a genuine operational fix from a promotional sugar rush.
The Ripple:A traffic-led 8.1% North America comp is a datapoint against the soft-consumer thesis that Q2 GDP’s 1.5% print reinforced today, and it stands in contrast to Consumer Defensive’s 1.89% sector decline. It also sets an uncomfortable bar for the rest of the restaurant complex, where most comparable-sales growth has been price-driven.
What It Means:The Niccol turnaround has moved from plausible to demonstrated, and the operating leverage is now visible in margins rather than just in sales. The valuation already embeds a good deal of it after a 26% year-to-date move.
What to watch:Whether North America margin expansion continues into fiscal Q4 — a single quarter can reflect mix. Watch China comparable sales, the segment not carrying the current recovery.
BULLISH
16. Fortinet (FTNT): +12% | Billings Up 33% and a Sharply Raised Full-Year Outlook
The Numbers:Released: AMC, 29 July. Adjusted EPS of $0.90 beat the $0.75 consensus and revenue of $2.05 billion topped the $1.89 billion estimate. Revenue rose 26%, product revenue 52% and billings 33%; full-year guidance was raised sharply. The stock rose more than 12% on Thursday.
The Problem/Win:Product revenue up 52% is the number that matters. Hardware refresh in network security is a leading indicator for the subscription attach that follows, and 33% billings growth confirms the bookings are contracted rather than shipped-and-hoped. This is a demand acceleration, not a comparison effect.
The Ripple:Cybersecurity spending is proving to be the least discretionary line in the enterprise IT budget, holding up while broader software multiples compressed through July. Bank of America’s announced acquisition of cybersecurity consultancy MDSec today points to the same demand backdrop from the buyer’s side.
What It Means:Security budgets are behaving defensively in the useful sense — they are not cyclical. That argues for treating the sub-sector as a quality-growth allocation rather than a high-beta software proxy.
What to watch:Whether peer network-security vendors report comparable product-revenue acceleration, which would confirm an industry refresh cycle rather than share gains.
TODAY BEFORE THE BELL (Markets Already Reacted)
BULLISH
17. Mastercard (MA): +2.49% | Cross-Border Volume Up 12% Says the Consumer Is Still Travelling and Still Spending
The Numbers:Released: BMO. Adjusted EPS of $5.04 beat the $4.77 estimate by 5.69% and revenue of $9.28 billion beat $9.08 billion by 2.22%, growth of 21% and 14% respectively on an adjusted basis. Cross-border volume rose 12%, switched transactions 9% to 47.4 billion, and worldwide gross dollar volume 8%. Shares closed up 2.49%.
The Problem/Win:Cross-border card-not-present transactions excluding travel grew in a 16% to 23% range through the quarter and into July — a live, high-frequency read on international e-commerce that extends past the reporting period. Rest-of-world markets grew 9% against 6% in the United States, so the geographic mix is doing real work.
The Ripple:Payment networks are the cleanest available proxy for nominal consumption, and 12% cross-border growth is difficult to reconcile with a 1.5% GDP print or with today’s 1.89% decline in Consumer Defensive. Financials rose 1.39% on the day, a middling result on a session led by technology.
What It Means:The consumer weakness implied by today’s macro data is not visible in transaction volumes. The discrepancy most likely reflects nominal spending supported by inflation and by a higher-income cohort that payment networks over-represent.
What to watch:Whether the July cross-border trend management flagged holds through August, which would extend the datapoint past the quarter. Watch US-only volume growth for signs the domestic consumer is diverging from the rest of the world.
BULLISH
18. Bristol Myers Squibb (BMY): +2.79% | A 28% EPS Beat and a $3 Billion Increase to Full-Year Revenue Guidance
The Numbers:Released: BMO. Adjusted EPS of $2.04 beat the $1.60 estimate by 27.73% and revenue of $12.97 billion beat $11.74 billion by 10.51%, up 6% year-on-year. Full-year revenue guidance was lifted to approximately $49-50 billion from $46-47.5 billion, and adjusted EPS guidance to $6.75-7.00 from $6.05-6.35. Shares closed up 2.79%.
The Problem/Win:The Growth Portfolio — Opdivo Qvantig, Reblozyl, Camzyos, Breyanzi and Opdualag — delivered $7.6 billion, up 15% from $6.6 billion. Legacy products fell to $5.4 billion from $5.7 billion on continued generic erosion. The new portfolio is now comfortably out-growing the decline in the old one, which is the entire investment case.
The Ripple:The gain came on a day Healthcare fell 1.15% as a sector, with Eli Lilly down 4.55% and Johnson & Johnson down 3.66% on rotation. That Bristol Myers rose against that tape is a clean demonstration that fundamental delivery still overrides sector flows when the beat is large enough.
What It Means:The patent-cliff bridge is being crossed on schedule. A guidance raise of this magnitude mid-year usually reflects visibility rather than a single quarter’s upside.
What to watch:Whether Growth Portfolio momentum holds above 15% as the comparison base rises. Watch Eliquis volumes for the pace of generic erosion in the legacy book.
BEARISH
19. Altria (MO): -9.32% | A Two-Cent EPS Miss Triggers a Nine Percent Rout as Marlboro Volumes Fall 7.4%
The Numbers:Released: BMO. Adjusted EPS of $1.48 missed the $1.50 estimate by 1.16%. Net revenues were flat at $6.11 billion; revenues net of excise taxes of $5.36 billion edged past the $5.35 billion estimate. GAAP profit fell to $2.3 billion, or $1.37 per share, from $2.38 billion, or $1.41. Domestic cigarette shipment volumes fell 3.4% and Marlboro shipments 7.4%, to 13.39 billion sticks from 14.46 billion. Full-year adjusted EPS guidance was narrowed to $5.61-5.72. Shares closed down 9.32%.
The Problem/Win:A two-cent miss does not cause a nine percent decline; a 7.4% decline in the flagship brand’s volumes does. The tobacco model runs on pricing power offsetting secular volume decline, and a 7.4% Marlboro drop against 3.4% for total shipments means the premium brand is losing share within a shrinking category — the one dynamic the pricing algebra cannot absorb indefinitely.
The Ripple:Altria was the day’s most severe large-cap decline and compounded Consumer Defensive’s 1.89% sector loss, alongside Philip Morris at -3.25% and Walmart at -2.73%. Nicotine-pouch sales softness also removes some of the smoke-free growth offset the sector has leaned on.
What It Means:The defensive yield case for tobacco depends on volume decline staying gradual and predictable. A 7.4% flagship decline tests that assumption and puts the dividend growth rate, not the dividend itself, into question.
What to watch:Whether Marlboro’s volume decline moderates below 5% next quarter. Watch smoke-free segment revenue for evidence the transition is offsetting combustibles rather than merely accompanying their decline.
UNCERTAIN
20. Southern Company (SO): -1.78% | Data-Centre Load Up 55% and an EPS Beat, but Revenue Misses by $250 Million
The Numbers:Released: BMO. Adjusted EPS of $1.13 beat the $1.01 estimate by 11.81%, against $0.92 a year earlier; GAAP EPS was $1.03 versus $0.80. Revenue of $6.98 billion missed the $7.23 billion estimate by 3.51%. The full-year earnings outlook now points to the top end of the prior range. Shares closed down 1.78%.
The Problem/Win:Data-centre usage rose 55% year-on-year and system-wide data-centre load exceeded 1.2 gigawatts, more than 500 megawatts above a year earlier. That is the load-growth thesis being delivered in physical units rather than promised in slides. The revenue miss reflects the gap between regulated rate recovery and the capital being deployed to serve that load — earnings arrive through the rate base, not through the top line.
The Ripple:Utilities rose just 0.28% as a sector on a session when the 10-year yield added 5.1 basis points — the bond-proxy headwind remains binding. Southern’s data-centre numbers nonetheless corroborate copper’s 2.99% move and the power-infrastructure demand that the AI buildout requires.
What It Means:Regulated utilities are converting AI load growth into earnings, but rising long-term yields are compressing the multiple faster than the rate base is expanding. The fundamental story and the share price are pointing in different directions.
What to watch:Whether data-centre load growth of this magnitude draws the state and local permitting pushback that triggered Caterpillar’s downgrade this week. Watch Georgia regulatory filings for rate-case treatment of the incremental capital.
TODAY AFTER THE BELL (Markets React Tomorrow)
UNCERTAIN
21. Apple (AAPL): AH: n/a | iPhone Revenue Jumps 22% and Margins Hit 50.1%, but Services Misses
The Numbers:Released: AMC. Fiscal Q3 revenue of $109.4 billion rose 16% and edged past the $109.04 billion estimate; diluted EPS of $2.02 rose 29% and beat the $1.89 estimate, including a favourable $0.11 impact from tariff refunds. Net profit was $29.8 billion. Gross margin reached 50.1% against 46.5% a year earlier, roughly 2 percentage points of which came from tariff refunds. iPhone revenue jumped 22%. Services rose 12% to more than $30 billion but missed analyst estimates.
The Problem/Win:The quality of the beat is the open question. Roughly two points of the 3.6-point gross-margin expansion and $0.11 of the EPS came from tariff refunds — non-recurring items that flatter a genuinely strong hardware quarter. Services missing while growing 12% is the more durable concern, because Services carries the multiple: it is the high-margin annuity that justifies valuing Apple as something other than a hardware manufacturer.
The Ripple:A 22% iPhone quarter is a strong read for the handset supply chain, though today’s Qualcomm decline shows the market is discriminating within it. Apple’s capital-light approach to artificial intelligence stands in deliberate contrast to Microsoft’s $255-260 billion FY2027 capex guide and Meta’s free-cash-flow collapse — the same strategic question, three different answers, now all priced.
What It Means:Apple delivered the hardware cycle but not the Services line the multiple depends on, and part of the beat is not repeatable. Consensus already expects growth to decelerate to roughly 12% next quarter and into single digits through most of next year.
What to watch:Tomorrow’s open for the market’s verdict on the Services miss against the iPhone beat. Watch Services growth against the 12% run rate next quarter — a second consecutive miss would force a re-rating.
BULLISH
22. Amazon (AMZN): +9% AH | AWS Grows 37% — Its Fastest in 18 Quarters — and Quarterly Revenue Clears $200 Billion for the First Time
The Numbers:Released: AMC. Net sales of $200.6 billion rose 20% from $167.7 billion and beat the $196.5-197.0 billion consensus, the first time quarterly revenue has cleared $200 billion. AWS revenue was $42.2 billion, up 37% year-on-year against roughly 31% expected — the division’s fastest growth in 18 quarters — giving an annualised run rate of $169 billion. The AI and custom-chip businesses each cleared run rates above $25 billion. Shares rose more than 9% after hours.
The Problem/Win:AWS accelerating to an 18-quarter high is the second independent confirmation in 24 hours that enterprise cloud demand is inflecting rather than plateauing. Two hyperscalers reporting acceleration in the same week converts what looked like a single-company narrative into an industry datapoint, and the $25 billion AI and silicon run rates give it a measurable revenue base.
The Ripple:This validates today’s semiconductor rally after the close rather than before it, which means the equipment and memory complex enters tomorrow with fundamental support behind an 18% move it made on sentiment. It also sharpens the contrast with Meta: the market is paying for AI spend attached to a cloud revenue line and penalising it where there is none.
What It Means:The AI infrastructure trade has two confirming anchor tenants rather than one. The financing concern that drove July’s 23% SOXX drawdown looks increasingly like a positioning event rather than a demand signal.
What to watch:Amazon’s own capital-expenditure guidance on the call, the number that determines whether the semis rally extends. Watch AWS backlog and remaining performance obligations for evidence the 37% is contracted rather than consumption-driven.
UNCERTAIN
23. Stryker (SYK): AH: n/a | A 5.7% EPS Beat and a Completed Cyber Recovery, but Sales Only Meet Expectations
The Numbers:Released: AMC. Adjusted EPS of $3.69 beat the $3.49 estimate by 5.73%. Consolidated net sales of $6.6 billion rose 9.4%, with organic net sales up 9.0% — in line with the roughly $6.56-6.58 billion consensus. Full-year guidance was narrowed to organic sales growth of 8.3%-9.3% and adjusted EPS of $14.95-15.10. Reporting noted shares declining despite the beat; no after-hours percentage was available at the time of writing.
The Problem/Win:Chief Executive Kevin Lobo framed the quarter around recovery from the cyber incident, citing strong growth in sales, EPS and operating cash flow. That recovery is now largely complete, which removes the depressed comparison base that has flattered recent quarters — from here the 9% organic rate has to be earned rather than recovered. Narrowing rather than raising guidance after a 5.7% EPS beat is what the market appears to have focused on.
The Ripple:Medical-technology demand at 9% organic remains one of the more resilient end markets in a healthcare sector that fell 1.15% today on rotation. Elective procedure volumes holding up is also a modest counterpoint to the consumer weakness implied by the 1.5% Q2 GDP print.
What It Means:Operationally this is a clean quarter, but with the cyber recovery complete and guidance narrowed rather than raised, the easy upside is behind it. The name now trades on procedure volumes rather than on catch-up.
What to watch:Tomorrow’s session for the market’s read on the guidance narrowing. Watch organic growth against the 8.3%-9.3% full-year band next quarter, the first period without a cyber-depressed comparison.
WEEK AHEAD PREVIEW:
Q2 2026 earnings season is at its midpoint, with 27% of the S&P 500 reported and blended growth running at +37.9% year-on-year. Friday brings the integrated energy majors — reporting into a quarter that saw crude spend most of its length in the $80s — alongside two industrial gas and electrical names levered directly to the data-centre buildout.
ExxonMobil (XOM) — BMO, Friday, July 31 — Consensus $3.56 EPS on $109.94 billion revenue. Key focus: how much of the quarter’s earnings uplift came from higher liquids realisations versus refining and chemical margins, and whether management addresses Venezuela asset exposure. Analysts expect the strongest results in roughly 15 quarters across the majors.
AbbVie (ABBV) — BMO, Friday, July 31 — Consensus $3.60 EPS on $16.78 billion revenue. Key focus: whether Skyrizi (consensus ~$5.52 billion) beats and whether Rinvoq’s pricing drag is as steep as feared, with both immunology drugs now growing above 20% and carrying the entire growth burden as Humira erodes toward a consensus $730 million. The June Apogee Therapeutics acquisition adds deal-related noise to the EPS bridge.
Chevron (CVX) — BMO, Friday, July 31 — Consensus $5.55 EPS on $62.72 billion revenue. Key focus: whether elevated capital spending — estimated near $4.7 billion against $3.7 billion a year earlier — and softer downstream volumes offset the crude price tailwind, plus updates on the Venezuela, Argentina, Iraq, Libya and Namibia growth portfolio.
Linde (LIN) — BMO, Friday, July 31 — Consensus $4.49 EPS on $9.02 billion revenue, against company guidance of $4.40-4.50. Key focus: whether pricing attainment and the electronics and hydrogen project backlog offset weaker European industrial activity in the cyclical Chemicals & Energy and Manufacturing end markets, and whether full-year EPS guidance of $17.60-17.90 is reaffirmed. Take-or-pay on-site contracts and healthcare and food-and-beverage exposure provide the floor.
Eaton (ETN) — BMO, Friday, July 31 — Consensus $3.07 EPS on $8.16 billion revenue, against guidance of $3.00-3.10 and 9-11% organic growth. Key focus: whether management delivers the guided 150 basis points of sequential margin improvement in Electrical Americas from Q1’s 25.6%, and whether data-centre order momentum holds after Q1 orders rose roughly 240% with segment revenue up 50%. The most direct read available on whether today’s copper and power-infrastructure bid is order-backed.
Enbridge (ENB) — BMO, Friday, July 31 — Consensus $0.41 EPS on $8.17 billion revenue. Key focus: Mainline throughput after record Q1 volumes and apportionment through most of 2025, and whether full-year adjusted EBITDA guidance of $20.2-20.8 billion is reaffirmed. Estimates have drifted lower into the print.
The following week brings the balance of the mega-cap reporting calendar as Q2 2026 season passes the halfway mark.
— US market commentary trusted by family offices and institutions. Apply for membership at join.recessionalert.comG. WHAT’S NEXT -> TOP
UPCOMING RELEASES:
| Date | Event | Why It Matters |
|---|---|---|
| Fri, Jul 31 | Employment Cost Index QoQ (Q2, prior 0.9%) | The broadest measure of labor cost pressure and the wage input the hawkish FOMC dissenters lean on. A print above 0.9% would strengthen the case that inflation is not converging, days after core PCE eased to 3.3%. |
| Fri, Jul 31 | Chicago PMI (Jul, expected 56) | The first July activity read after a Q2 GDP print of just 1.5%. A miss would corroborate the deceleration the Transports flagged today; a beat would argue the growth cushion survived the quarter. |
| Fri, Jul 31 | Michigan Consumer Sentiment Final (Jul, expected 54.0) | Consumers are already funding spending out of savings, with June income up 0.2% against 0.3% outlays. Sentiment near multi-decade lows raises the risk that the consumer contribution carrying GDP fades into Q3. |
| Fri, Jul 31 | Michigan Inflation Expectations Final (Jul, prior 4.6%) | With the 30-year near a 19-year high on doubts about Fed resolve, any further rise in household expectations feeds the credibility problem directly and pressures the long end independent of the funds rate. |
KEY QUESTIONS:
1. Was today’s 3.36% Nasdaq surge a fear-unwind that fades, or the start of genuine breadth repair? A second session led by the Nasdaq alone — with the VIX unable to hold below 17 — would mark the rally as narrow and vulnerable rather than durable.
2. Does a 1.5% Q2 growth rate alongside a 6.3% GDP price index change the calculus for the three FOMC members who dissented in favor of a hike, or does Friday’s Employment Cost Index hand them the wage evidence they were missing?
3. Can a Saudi-led naval coalition genuinely decouple crude from the escalation ladder, given Iran’s public commitment to same-day retaliation — and does DXY holding below 100 against rising yields become a credibility read rather than a positioning one?
— US market commentary trusted by family offices and institutions. Apply for membership at join.recessionalert.comH. CHART OF THE DAY -> TOP
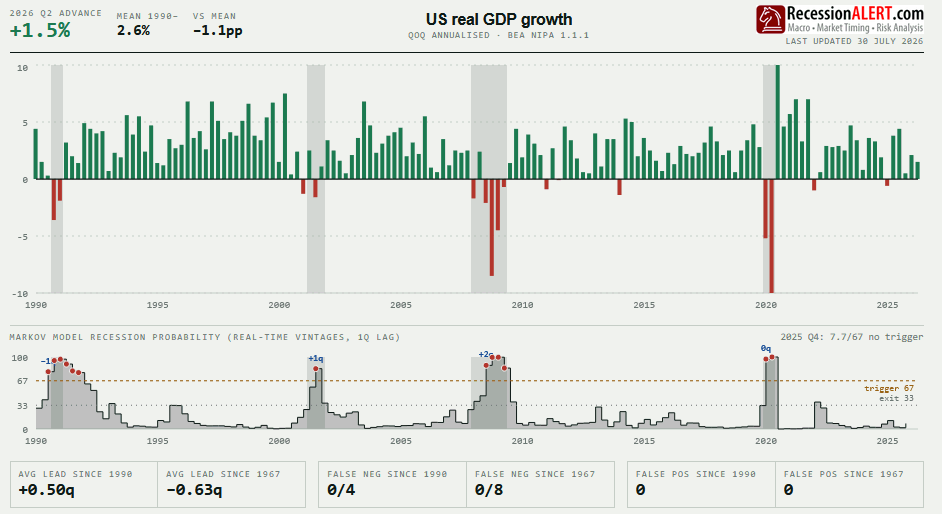
Domestic demand did not slow this quarter — it doubled. Beneath a headline that missed by roughly 0.6pp, real final sales to private domestic purchasers accelerated to +3.9% from +1.7%: consumers +3.2%, business fixed investment +8.4%, equipment +15.2%. Nothing in the demand core decelerated; only the measurement did. Imports rose 11.5% and took roughly a full point, and BEA names what landed — capital goods except automotive, mainly telecom equipment, semiconductors, industrial equipment — substantially the same shipment it books as that 15.2% equipment line, since the estimate is built off the same trade data. The accounts debit the imported machine in full on arrival and credit its output over a decade. Add inventories at -0.7pp and a federal decline that is mostly SPR crude sales with no direct GDP effect, and the shortfall is composition, not condition. The same split runs through the price side: headline PCE ran 5.1% while core fell a full point to 3.4% — the acceleration is energy, with Brent above $100, not demand overheating. The nominal economy grew 7.9%, an implied deflator near 6.3%, and revenue, the wage bill and tax receipts all compound on that line, not the 1.5%. Imports and inventories, 1.7pp between them, hand Q3 a mechanical bounce that will be misread as recovery. This was never a soft quarter — it paid cash up front for capacity it has not yet used.
Market Intelligence Brief (MIB) Ver. 18.46
For professional investors only. Not investment advice.
© 2026 RecessionALERT.com

Comments are closed.