
S&P 500 and Nasdaq closed at all-time records for a sixth straight session — PLTR +8.17%, ORCL +6.67% on JPMorgan’s ‘fourth hyperscaler’ call, AMD +4.55% — while Q1 GDP was revised to 1.6% and corporate profits collapsed -0.4% vs. +5.7% consensus. April PCE held at 3.8% with personal income flat, widening the consumer spending gap. LLY +4.05%: CVS Caremark restored Zepbound and approved oral GLP-1 Foundayo. Anthropic closed $65B at $965B. FOMC split: Williams holds; Musalem warns AI can’t rescue the Fed.
TABLE OF CONTENTS
A. EXECUTIVE SUMMARY
B. MARKET DATA
C. HIGH-IMPACT STORIES (5)
D. MODERATE-IMPACT STORIES (7)
E. ECONOMY WATCH (5)
F. EARNINGS WATCH (5)
G. WHAT’S NEXT
H. CHART OF THE DAY
A. EXECUTIVE SUMMARY -> TOP
The S&P 500 extended its winning streak to six sessions and closed at a record 7,563.78, but the headline masks a deeply bifurcated tape: Nasdaq 100’s +0.84% record versus the Dow’s near-flat +0.05% is the widest growth/industrial spread in recent sessions. That AI-driven divergence landed on the same day the BEA revised Q1 GDP down to 1.6% and corporate profits collapsed ‑0.4% quarter-over-quarter — equity markets are pricing an AI-driven earnings recovery that Q1 fundamentals do not support. Fixed income did not endorse the rally: the 10-year eased just 2.9 basis points to 4.450% despite in-line PCE data, signaling that bonds see no urgency to reprice the rate path lower. Six of eleven sectors advanced, with Technology (+1.45%) and Healthcare (+1.27%) leading while Utilities (‑1.02%) deepened a persistent structural decline — a sector map that rewards AI-weight and penalizes rate-sensitive positioning.
• S&P 500 (7,563.78, +0.58%) and Nasdaq 100 (30,223.89, +0.84%) both closed at all-time records for a sixth straight session — PLTR +8.17%, ORCL +6.67% (JPMorgan “fourth hyperscaler” initiation), AMD +4.55%, and APP +5.65% led the concentrated AI infrastructure surge.
• Q1 GDP revised to 1.6% (consensus: 2.0%); Q1 corporate profits plunged ‑0.4% QoQ vs. +5.7% expected — the worst profit miss in six quarters; the Atlanta Fed cut its Q2 GDPNow tracker to 3.8%.
• April PCE confirmed at 3.8% YoY; core MoM +0.2% (slightly below +0.3% consensus); personal income flat vs. +0.4% expected — real per-capita disposable income fell ‑1.4% YoY; consumers are spending out of savings, not income growth.
• LLY +4.05% to $1,126.80 — CVS Caremark restored commercial coverage for Zepbound and simultaneously approved oral GLP-1 Foundayo for approximately 100 million covered lives; Healthcare sector +1.27%.
• Iran-US 60-day ceasefire MOU extended — WTI near-flat at $88.70; energy sector ‑4.79% for the week; Henry Hub surged +6.69% on a US-specific EIA storage miss unrelated to Hormuz.
• Anthropic raised $65B at a $965B valuation — the largest private AI capital raise on record; FOMC split deepened with NY Fed’s Williams calling policy “well-positioned” while St. Louis Fed’s Musalem warned AI productivity cannot rescue the Fed from 3.8% PCE.
1. Record Valuations on Deteriorating Fundamentals — S&P 500 all-time highs coincide with the worst corporate profit miss in six quarters (‑0.4% vs. +5.7% expected) and GDP growth slowing to 1.6%. Markets are pricing an AI-driven Q2/H2 earnings recovery that no current data supports; a disappointment in Q2 guidance or the July GDP advance estimate would expose the current multiple significantly.
2. Stagflation-Lite Narrows the Fed’s Options — April PCE at 3.8% with personal income flat and real disposable income falling ‑1.4% YoY puts the Fed in a no-win position: inflation too high to cut, consumer too stretched to sustain spending much longer. The June FOMC — with Williams patient, Cook ready to hike, and Musalem explicitly rejecting the AI-productivity soft-landing narrative — will be a genuine policy debate with meaningful hike probability.
3. AI Bifurcation: Government-Anchored Winners vs. Infrastructure Time-Constrained Plays — Palantir (+8.17%) and Oracle (+6.67%) surged on US government AI and cloud contracts; GE Vernova (‑3.48%) was punished for physical infrastructure limits that prevent turbine delivery from matching hyperscaler demand timelines. The market is separating “AI revenue now” (software, government contracts, cloud) from “AI infrastructure eventually” (power grid, turbines, construction lead times) — a distinction with significant sector allocation implications.
 — Leading economic indicators. Accurate market forecasts. Apply for membership at join.recessionalert.com
B. MARKET DATA -> TOP
The session was driven by a concentrated AI technology wave — PLTR, ORCL, AMD, QCOM, and APP each gained 4–8% on a Q1 earnings beat, a JPMorgan upgrade, and broad AI infrastructure enthusiasm, lifting the Nasdaq 100 (+0.84%) sharply above the near-flat Dow (+0.05%) in the session’s clearest bifurcation. Six of eleven sectors advanced — solid but not sweeping — with growth sectors (Technology, Healthcare, Basic Materials) leading while rate-sensitive Utilities (-1.02%) and Consumer Defensive (-0.58%) declined even as 10-year yields eased just 2.9 bps. The session’s sharpest anomaly was Bitcoin’s -2.24% decline against a broad risk-on tape — crypto decoupled from equity sentiment even as VIX fell 3.25%, arguing against a simple risk-proxy read. DJ Transportation’s -0.66% loss while Dow industrials held near flat quietly introduces a Dow Theory caveat to an otherwise constructive session.
CLOSING PRICES – Thursday, May 28, 2026:
MAJOR INDICES
Nasdaq’s +0.84% outpaced the Dow’s near-flat close (+0.05%) by the widest daily margin in recent sessions — this was a concentrated growth story, not a broad industrial rally. DJ Transportation’s -0.66% decline alongside a near-flat Dow reinforces the tech-vs-industrial divide. Dow Theory bull confirmation is entrenched through a 6th consecutive session: DJIA fractionally eclipsed its prior 10-session high today while DJTA remains 0.66% below its own — still within the 2% threshold but with the spread modestly widening, a divergence worth monitoring if it extends.
| Index | Close | Change | %Move | Why It Moved |
|---|---|---|---|---|
| S&P 500 | 7,563.78 | +43.42 | +0.58% | AI-driven tech surge; Nasdaq growth leadership offset by industrial/defensive drag |
| Dow Jones | 50,669.77 | +25.49 | +0.05% | Near-flat; GEV (-3.5%) and CAT (-2.5%) industrial drags offset tech tailwinds; blue-chip composition diluted AI rally |
| DJ Transportation | 21,355.0 | -142.1 | -0.66% | Weakened alongside industrial softness; diverges from headline S&P advance |
| Nasdaq 100 | 30,223.89 | +250.32 | +0.84% | AI software and semis surge: PLTR (+8.2%), ORCL (+6.7%), APP (+5.7%), AMD (+4.6%), QCOM (+4.2%) |
| Russell 2000 | 2,936.61 | +16.67 | +0.57% | Small caps participated in risk-on rally; broad AI/growth sentiment lifted domestic equities |
| NYSE Composite | 23,302.26 | +35.19 | +0.15% | Modest broad-market advance; broader NYSE composition muted the Nasdaq-led tech surge |
VOLATILITY & TREASURIES
VIX fell 3.25% to 15.76 while the 10-year yield eased just 2.9 bps — a constructive pairing, though the bond market’s limited participation is notable; yields barely budged on a day when April PCE met estimates, suggesting the fixed-income market sees no urgency to reprice the rate path lower. The 2Y/10Y spread holds at 42.5 bps (2Y: 4.025%, 10Y: 4.450%) — curve shape unchanged, no steepening or flattening signal. DXY’s mild -0.18% decline provides a modest commodity tailwind but argues against a flight-to-safety dollar bid; the subdued yield and dollar moves reinforce the AI/risk narrative as today’s primary engine.
| Instrument | Level | Change | Why It Moved |
|---|---|---|---|
| VIX | 15.76 | -0.53 (-3.25%) | Risk-on sentiment; Iran ceasefire extension reports and benign PCE data eased anxiety |
| 10-Year Treasury Yield | 4.450% | -2.9 bps | April PCE met expectations (3.8% YoY); mild relief; bond market declines to reprice rate path materially |
| 2-Year Treasury Yield | 4.025% | -0.8 bps | Near-term Fed path unchanged; PCE in-line with consensus; minimal short-end repricing |
| US Dollar Index (DXY) | 99.03 | -0.18 (-0.18%) | Mild pressure as yields edged lower; risk-on flow favored equities over safe-haven dollar |
COMMODITIES
Gold (+1.11%) and copper (+1.28%) advanced in tandem — a demand-side signal rather than pure safe-haven buying, combining residual geopolitical support with a weak dollar. Silver outpaced gold (+1.48%), confirming industrial demand is contributing alongside the defensive bid. Bitcoin’s -2.24% decline against a risk-on equity tape is the session’s most notable commodity divergence — crypto sat out the rally entirely, suggesting crypto-specific headwinds rather than macro risk-off; using BTC as a risk proxy today would have generated the wrong signal.
| Asset | Price | Change | %Move | Why It Moved |
|---|---|---|---|---|
| Gold | $4,531.34/oz | +$49.84 | +1.11% | Weak dollar tailwind + residual geopolitical bid; Iran ceasefire only partial, uncertainty persists |
| Silver | $76.003/oz | +$1.108 | +1.48% | Outpaced gold; industrial demand component lifted by AI infrastructure spending optimism |
| Copper | $6.4210/lb | +$0.0810 | +1.28% | Industrial metals bid; China demand background supportive; AI infrastructure materials demand narrative |
| Platinum | $1,926.95/oz | -$1.05 | -0.05% | Near flat; no significant catalyst; held out of the precious metals rally |
| Bitcoin | $73,599 | -$1,688 | -2.24% | Decoupled from risk-on equity tape; crypto-specific selling pressure; BTC diverged as VIX fell 3.25% |
ENERGY
WTI near-flat (+0.02%) and Brent’s modest gain (+0.43%) show crude absorbing an Iran ceasefire extension (60-day MOU) without a sharp unwind — the supply-risk premium partially deflated but held. Henry Hub’s +6.69% surge is an entirely separate US-specific event: a smaller-than-expected EIA weekly storage build with rising summer cooling demand as catalyst; TTF’s near-flat response confirms no global gas signal. Crude edging higher alongside a rising equity market reads as demand-side support — a bullish macro backdrop rather than a supply shock.
| Asset | Price | Change | %Move | Why It Moved |
|---|---|---|---|---|
| Crude Oil (WTI) | $88.70/bbl | +$0.02 | +0.02% | Near flat; Iran ceasefire extension (60-day MOU) absorbed supply-risk premium without sharp selloff |
| Crude Oil (Brent) | $92.65/bbl | +$0.40 | +0.43% | Residual Middle East risk premium held; ceasefire MOU treated as temporary not structural resolution |
| Natural Gas (Henry Hub) | $3.302/MMBtu | +$0.207 | +6.69% | EIA weekly storage build came in smaller than expected; rising summer cooling demand; tightest storage in months |
| Natural Gas (Dutch TTF) | $15.84/MMBtu | +$0.03 | +0.19% | Near flat in EUR/MWh terms; slight USD gain from EUR/USD appreciation; no European gas catalyst |
S&P 500 SECTORS
Technology’s +1.45% session extends a dominant multi-horizon trend (1W: +4.13%, 1M: +13.49%, 3M: +24.58%) — no momentum stall visible across any timeframe. The sharpest contrarian signal: Basic Materials +0.96% today despite being the worst 3-month performer (-6.50%), suggesting a mean-reversion bounce rather than a structural turn. Healthcare’s +1.27% daily gain also sits against a weak structural backdrop (-3.51% 3M, -1.57% YTD) — a short-term bid, not a recovery. Utilities’ -1.02% deepens its -4.09% 1-month and -5.38% 3-month slide; rate-sensitive pressure is persistent.
| Sector | 1-Day | 1-Week | 1-Month | 3-Month | 6-Month | YTD | 12-Month |
|---|---|---|---|---|---|---|---|
| Technology | +1.45% | +4.13% | +13.49% | +24.58% | +25.11% | +23.08% | +50.72% |
| Healthcare | +1.27% | +2.13% | +4.17% | -3.51% | -1.32% | -1.57% | +15.79% |
| Basic Materials | +0.96% | +3.75% | +2.38% | -6.50% | +27.48% | +17.22% | +47.21% |
| Consumer Cyclical | +0.38% | +3.02% | +3.93% | +4.44% | +4.88% | +1.26% | +10.97% |
| Communication Services | +0.27% | +1.65% | +5.13% | +11.12% | +9.89% | +8.65% | +37.18% |
| Industrials | +0.01% | +2.92% | +2.97% | +0.35% | +20.40% | +15.76% | +27.76% |
| Energy | -0.17% | -4.79% | -2.81% | +5.13% | +27.88% | +27.21% | +38.65% |
| Real Estate | -0.33% | +0.09% | +0.81% | +0.78% | +7.07% | +8.63% | +8.22% |
| Financial | -0.44% | -0.40% | +0.09% | -1.62% | +3.37% | -2.78% | +9.12% |
| Consumer Defensive | -0.58% | -3.07% | -0.08% | -5.23% | +9.63% | +7.76% | +4.05% |
| Utilities | -1.02% | +0.21% | -4.09% | -5.38% | +2.25% | +5.56% | +13.25% |
TOP MEGA-CAP MOVERS:
GAINERS
| Company | Ticker | Close | Change | Why It Moved |
|---|---|---|---|---|
| Palantir Technologies | PLTR | $143.34 | +8.17% | Q1 2026 earnings beat (EPS + revenue); 206 government AI contracts closed in Q1; DoD Maven AI “program of record” designation confirmed durable revenue stream |
| Oracle Corp | ORCL | $203.70 | +6.67% | JPMorgan initiates “Overweight” at $210 PT, calling Oracle a scaled AI infrastructure “fourth hyperscaler”; strong cloud RPO underpins thesis |
| AppLovin Corp | APP | $599.89 | +5.65% | Broad AI/tech sector momentum; AI-driven advertising platform benefiting from AI infrastructure spending narrative |
| Advanced Micro Devices | AMD | $518.09 | +4.55% | AI accelerator chip demand; broad semiconductor rally on AI infrastructure spending theme |
| Qualcomm Inc | QCOM | $243.29 | +4.24% | Mobile and edge AI chip demand; broad semiconductor sector rally on AI infrastructure enthusiasm |
DECLINERS
| Company | Ticker | Close | Change | Why It Moved |
|---|---|---|---|---|
| GE Vernova Inc | GEV | $996.00 | -3.48% | Bearish analyst report questioned AI energy demand valuation, citing “hyper-growth” expectations disconnected from physical infrastructure limits; insider selling added pressure |
| Caterpillar Inc | CAT | $887.67 | -2.45% | Tariff cost headwind ($2.2–2.4B 2026 exposure, ~500 bps margin compression in Resource Industries); profit-taking after 9.9% Iran-war rebound from prior month lows |
— Institutional-grade intelligence for serious investors. Apply for membership at join.recessionalert.comC. HIGH-IMPACT STORIES -> TOP
BULLISH
1. S&P 500 and Nasdaq Close at All-Time Records — AI Technology Wave Propels Sixth Consecutive Winning Session; Nasdaq 100 +0.84%
The core facts:The S&P 500 closed at a record 7,563.78 (+0.58%), extending its winning streak to six consecutive sessions. The Nasdaq Composite hit 26,917.47 (+0.91%) and the Nasdaq 100 reached 30,223.89 (+0.84%) — both record closes. The session was driven by a concentrated AI technology wave: Palantir (PLTR) +8.17% on Q1 2026 earnings carry-through, Oracle (ORCL) +6.67% on a JPMorgan “fourth hyperscaler” initiation, AppLovin (APP) +5.65%, AMD +4.55%, and Qualcomm +4.24% on broad AI infrastructure enthusiasm. Technology sector +1.45%; Healthcare +1.27%; six of eleven sectors advanced. The Dow Jones closed near-flat at 50,669.77 (+0.05%), with GE Vernova (-3.48%) and Caterpillar (-2.45%) acting as industrial drags. VIX fell 3.25% to 15.76; the 10-year yield eased just 2.9 basis points to 4.450%.
Why it matters:Three portfolio implications. (1) The Nasdaq’s +0.84% versus the Dow’s +0.05% represents the widest daily bifurcation in recent sessions — this is a concentrated growth and AI story, not a broad industrial recovery. Portfolio managers overweight industrials and defensives are materially underperforming AI-weighted growth positioning. (2) Record equity highs arrived on a day when Q1 GDP was revised down to 1.6% and PCE confirmed 3.8% — equity markets front-ran the “benign inflation” narrative from core PCE slightly undercutting expectations rather than reacting to the GDP miss. The bond market’s -2.9 bps yield move suggests fixed income is more cautious, creating a potential divergence risk if the rate-hike calculus shifts at the June FOMC. (3) Six consecutive wins without a corrective session creates technical overhead. VIX at 15.76 leaves room for a volatility spike if the June FOMC meeting or May non-farm payrolls (June 6) deliver a hawkish surprise. The constructive tape does not equal eliminated downside risk.
What to watch:VIX behavior around the 15-level ahead of the June FOMC — a break above 18 would signal deterioration in the risk-on environment; May non-farm payrolls on June 6 as the next major index-moving catalyst; whether the Nasdaq-Dow bifurcation sustains or converges as the rate and inflation data continues to evolve.
BEARISH
2. April PCE 3.8% YoY Lands In-Line; Core MoM Slightly Below at 0.2% — But Income Stagnation Signals Stagflation-Lite Conditions Persist
The core facts:The BEA released April 2026 Personal Income and Outlays data Thursday morning. Headline PCE inflation confirmed at 3.8% year-over-year (+0.4% MoM), in line with consensus — meeting the threshold Fed Governor Cook explicitly cited in her “prepared to raise rates” statement on May 27. Core PCE MoM came in at 0.2%, slightly below the 0.3% consensus — a mild positive surprise on the inflation deceleration front. However, the income side of the report was deeply negative: personal income growth was flat (0% MoM versus +0.4% consensus), with real per-capita disposable personal income now running -1.4% year-over-year, meaning households are losing purchasing power in inflation-adjusted terms. Personal spending held at +0.5% MoM, continuing to outpace income growth.
Why it matters:The 0.2% core MoM — slightly below consensus — is the data point equity markets used to justify today’s rally. Two forward implications are critical. (1) Cook’s rate-hike language was conditional on disinflation failing to materialize. A 0.2% core MoM is not evidence of failure, but it is not evidence of success either — 3.8% headline PCE with flat income is not the trajectory the Fed needs to see trending toward 2%. The June FOMC will need to weigh one below-consensus core MoM print against a persistent 3.8% headline and 4.450% 10-year yield environment. (2) The income-spending gap is now the primary structural consumer risk. Consumers spending +0.5% MoM while income is flat and real DPI is -1.4% YoY implies savings drawdown is funding current consumption. This spending appears resilient on the surface but is not income-supported — any further income deterioration or credit tightening will expose this gap sharply in consumer discretionary sector earnings.
What to watch:May PCE data (released late June) for whether the 0.2% core MoM softening is the beginning of a deceleration trend or a one-month artifact; June FOMC meeting statement for any modification to Fed Cook’s hawkish framing in light of the slight core undershoot; June retail sales for evidence of whether consumer spending growth is decelerating as the income-savings gap narrows.
BEARISH
3. Q1 2026 GDP Revised Down to 1.6% vs. 2.0% Consensus — Corporate Profits Collapse -0.4% QoQ Against +5.7% Expected; Worst Miss in Six Quarters
The core facts:The BEA released its second estimate for Q1 2026 real GDP Thursday, revising growth down to 1.6% annualized — below the 2.0% consensus and the 2.0% first-estimate expectation. The headline miss was compounded by a critically damaging corporate profits figure: preliminary Q1 corporate profits fell -0.4% quarter-over-quarter against a +5.7% consensus expectation — a 10-plus percentage-point negative miss and the worst such outcome in six quarters. The Atlanta Fed’s GDPNow model immediately revised its Q2 2026 tracking estimate down from 4.3% to 3.8% in response to the combined GDP and personal income data released today.
Why it matters:Three equity market risks crystallize from this data. (1) Q1 corporate profits fell -0.4% QoQ at the exact moment the S&P 500 is printing all-time highs on elevated forward earnings multiples. Markets are pricing Q2 corporate earnings recovery without any data confirmation that the -0.4% Q1 profit decline is a one-quarter artifact rather than a leading indicator of sustained margin compression. If Q2 earnings disappoint, the valuation multiple supporting today’s record high becomes exposed. (2) The GDPNow cut to 3.8% for Q2 keeps the economy away from the “strong and inflationary” quadrant — but the combination of 1.6% GDP, -0.4% corporate profits, and 3.8% PCE explicitly traces the “weak growth + persistent inflation” path. The FOMC cannot cut rates on this data, and the probability of a cut in 2026 is functionally zero. (3) The pattern of record equity highs accompanied by corporate profit declines and GDP misses is historically associated with late-cycle multiple expansion where market sentiment is running ahead of fundamentals — a configuration with well-documented mean-reversion risk.
What to watch:Q2 2026 GDP advance estimate (late July) for whether Q1’s 1.6% is a floor or a trend; Q2 corporate earnings guidance season in July for explicit acknowledgment of margin compression; Atlanta Fed GDPNow for real-time Q2 tracking — a further decline below 3.0% would significantly accelerate recessionary concern.
UNCERTAIN
4. Iran-US 60-Day Ceasefire MOU Extended — Hormuz Risk Premium Partially Deflated but Structural Energy Supply Threat Intact; Brent Holds Below $94
The core facts:US and Iranian negotiators reached a tentative agreement Thursday extending the existing ceasefire by 60 days and providing a framework for the gradual restoration of Persian Gulf energy exports under a memorandum of understanding. Traders unwound some of the geopolitical risk premium built up earlier in the session following reports of early-morning military exchanges in the region. WTI crude closed near-flat at $88.70/bbl (+0.02%), with Brent settling modestly higher at $92.65/bbl (+0.43%) — well below the $99-$103/bbl range seen at peak Hormuz disruption this month. Energy sector finished -0.17% on the session and -4.79% for the week.
Why it matters:The muted oil market reaction to today’s MOU is itself the signal. (1) WTI near-flat and Brent below $94 shows markets treated the 60-day extension as tactical, not structural — not a reopening of the Strait of Hormuz to full commercial traffic. Dallas Fed President Logan’s quantification from May 27 remains the operative constraint: US production can add only 250K bpd against a 13M bpd Hormuz shortfall. A 60-day extension buys diplomatic time but does not solve the physical supply gap. (2) The ceasefire extension prevents the worst-case near-term scenario — full conflict re-escalation — from materializing immediately. This is the positive tail that equity markets priced in via VIX declining to 15.76 and gold rising to $4,531/oz on residual geopolitical bid. But with prior negotiating frameworks having been labeled “complete fabrications” by the White House and Iran requiring “tangible verification,” the credibility of this extension will be tested within weeks. (3) Energy sector’s -4.79% weekly decline illustrates that the market is pricing de-escalation ahead of confirmation — if the MOU collapses or violations occur within the 60-day window, the reversal in energy names would be swift.
What to watch:Oman’s public posture as the designated monitoring coordinator — its statements are the most reliable leading indicator of whether the MOU is being observed in practice; Brent crude behavior around $90–$95/bbl for whether the de-escalation thesis holds; White House formal communications for any migration from skepticism toward diplomatic commitment over the next two weeks.
BULLISH
5. Eli Lilly (LLY) +4.05% to $1,126.80 — CVS Caremark Restores Commercial Insurance Coverage for Zepbound and Newly Approved Oral Drug Foundayo; Market Cap Surpasses $1.06 Trillion
The core facts:CVS Caremark, one of the largest pharmacy benefit managers in the United States, reversed its prior formulary exclusion and restored commercial insurance coverage for Eli Lilly’s GLP-1 obesity injection Zepbound. Simultaneously, CVS approved coverage for Foundayo, Lilly’s newly approved oral GLP-1 weight-loss drug — the first oral obesity medication of its class — making both drugs immediately accessible to millions of Americans enrolled in CVS-managed commercial health plans. LLY shares surged +4.05% to $1,126.80, pushing the company’s market capitalization above $1.06 trillion. Healthcare sector rose +1.27%, the second-best sector performance of the session.
Why it matters:CVS Caremark manages pharmacy benefits for approximately 100 million Americans — a formulary exclusion at that scale is a material revenue ceiling, and its removal is a direct near-term revenue catalyst. Three portfolio implications. (1) The reinstatement of Zepbound coverage unlocks the largest single PBM’s patient population for Lilly’s primary revenue driver, directly improving the near-term prescription volume trajectory ahead of Q2 earnings in July. The question investors now face is whether this reinstatement was negotiated through a price concession (margin negative) or a formulary logic reversal (margin neutral). (2) Foundayo’s simultaneous coverage approval is strategically significant: oral GLP-1 medications eliminate injection barriers and compliance friction, expanding the addressable obesity drug market to patients unwilling to use injectables. Lilly now captures both the injectable and oral segments of the market from a single PBM partner with 100M covered lives. (3) The +4.05% move on a $1T+ market cap company represents approximately $42 billion in market value created in a single session — demonstrating that GLP-1 commercial access decisions remain among the highest market-impact single events in large-cap healthcare. Peer PBMs — Express Scripts/Cigna, OptumRx/UnitedHealth — face investor pressure to clarify their Zepbound and Foundayo formulary positions.
What to watch:Formulary coverage decisions from Express Scripts (Cigna) and OptumRx (UnitedHealth) for whether CVS’s reversal triggers a broader PBM access improvement for Zepbound and Foundayo; Q2 2026 LLY earnings (July) for Zepbound prescription volume and net realized pricing to determine whether coverage came at margin cost; Novo Nordisk’s Ozempic/Wegovy formulary status at CVS for any competitive formulary rebalancing.
— Quantifying recession risk so you don’t have to guess. Apply for membership at join.recessionalert.comD. MODERATE-IMPACT STORIES -> TOP
BEARISH
6. April New Home Sales Miss at 622K vs. 670K Consensus — 9-Month Mortgage Rate High Stalls Demand; Homebuilder Stocks Face Forward Guidance Risk
The core facts:April 2026 new home sales printed 622K annualized units versus the 670K consensus estimate — a -6.2% month-over-month decline and -11.3% year-over-year drop, the weakest print since late 2024. The direct driver remains the 30-year fixed mortgage rate at 6.65%, a nine-month high following five consecutive weeks of rate increases, which eliminates affordability for a growing share of first-time buyers and move-up purchasers.
Why it matters:Three portfolio-level implications. (1) Homebuilder stocks (DHI, LEN, PHM) face mounting forward guidance risk: the -11.3% YoY decline erodes the “housing demand is resilient” thesis underpinning their current valuations. Q2 homebuilder earnings in July are a high-risk event; order cancellation rates and incentive packages will be the critical disclosures. (2) The combination of -6.2% MoM new home sales with last week’s -8.5% MBA purchase application decline creates a two-indicator confirmation that the transaction market is being closed down by rate levels — not merely slowed. This is structurally different from the 2022-2023 “high rates but tight supply” dynamic; it is now a demand destruction signal. (3) Housing-related consumer spending chains (Home Depot, Williams-Sonoma, floor covering, appliances) are exposed to this transaction slowdown — expect those names to cite housing market softness as a Q2 headwind in July guidance.
What to watch:MBA weekly purchase applications (June 4) for whether the demand contraction deepens; homebuilder Q2 earnings in July for explicit order book cancellation rates; any Fed communication on housing as a policy transmission mechanism ahead of the June FOMC.
UNCERTAIN
7. April Durable Goods Headline +7.9% Masks Core Capex Miss of -1.1% — Boeing Aircraft Distortion Conceals Second Consecutive Business Investment Decline
The core facts:April 2026 Durable Goods orders printed +7.9% versus the +3.5% consensus — a dramatic headline beat driven entirely by a +165.9% surge in nondefense aircraft orders, a Boeing-specific distortion. Stripping out defense and aircraft, core capital goods (nondefense, ex-aircraft) fell -1.1% versus the +0.4% consensus — a 150-basis-point miss representing the second consecutive monthly decline in business investment spending.
Why it matters:The Boeing distortion is straightforward to decompose but creates narrative confusion that requires active management in portfolio analysis. (1) Core capex -1.1% — the economically meaningful signal — is a leading indicator of corporate earnings growth. Two consecutive core capex misses while equities hit all-time records represents a fundamental-versus-valuation divergence that requires resolution. The historical lag between capex contraction and earnings delivery is approximately two quarters, suggesting Q3-Q4 2026 earnings could face headwinds even if Q2 holds. (2) Industrial and machinery manufacturers (CAT, DE, GE, Emerson) are directly exposed to core capex weakness — if businesses are pulling back on equipment orders, the order backlogs underpinning industrial earnings guidance since 2025 are at risk of deterioration. (3) For the AI capital expenditure narrative, the core capex miss is a reminder that AI infrastructure spending may be crowding out traditional industrial and manufacturing investment rather than lifting total capex broadly — tech capex accelerates while industrial capex contracts.
What to watch:May durable goods orders for confirmation or reversal of the second-consecutive core capex decline; Q2 industrial earnings guidance for whether Caterpillar, Deere, and Emerson cite weakening order books explicitly; US ISM Manufacturing PMI on June 2 for national confirmation of the capex trend.
BULLISH
8. JPMorgan Initiates Oracle (ORCL) “Overweight” at $210 — AI Infrastructure “Fourth Hyperscaler” Thesis Backed by $30 Billion US Government Cloud Contract; ORCL +6.67%
The core facts:JPMorgan today initiated coverage of Oracle Corporation (ORCL) with an “Overweight” rating and a $210 price target. The initiation thesis positions Oracle as a scaled AI infrastructure “fourth hyperscaler” alongside AWS, Azure, and Google Cloud, citing the company’s recently secured $30 billion cloud infrastructure framework agreement with the US government as evidence of enterprise-to-government cloud scale. ORCL surged +6.67% to $203.70 on the initiation — the session’s second-largest mega-cap gain. Oracle’s current market capitalization is approximately $585 billion.
Why it matters:Three sector implications. (1) The “fourth hyperscaler” designation is significant as a valuation framework — hyperscaler multiples trade structurally above traditional enterprise software multiples. If Oracle can sustain hyperscaler-tier cloud revenue growth, its valuation ceiling is substantially higher than its software-comparable peers. JPMorgan’s initiation provides institutional momentum for this re-rating thesis; (2) The $30 billion US government cloud contract is the most concrete evidence that Oracle has evolved beyond its Oracle Database installed base into competitive cloud infrastructure. This removes the core investment risk — “Oracle is a legacy database company maintaining incumbency” — from the thesis and replaces it with a growth narrative anchored in government AI and cloud procurement; (3) The same-session surge in Oracle (+6.67%) and Palantir (+8.17% on government AI contract carry-through) creates a clear market signal: US government AI and cloud spending is being revalued upward in real time. Direct read-through exists for other government-adjacent technology names including Booz Allen Hamilton, SAIC, and Leidos.
What to watch:Oracle FY27 Q1 earnings (expected August-September) for cloud infrastructure revenue growth confirmation of the hyperscaler thesis; whether the $30B government cloud framework converts into booked revenue at pace; ORCL share price behavior around the $210 JPMorgan price target ceiling.
UNCERTAIN
9. Natural Gas +6.69% to $3.302/MMBtu — EIA Weekly Storage Build Undershoots; Summer Cooling Demand Tightens Domestic Supply; AI Data Center Power Demand Adds Structural Layer
The core facts:Henry Hub natural gas spot price surged +6.69% Thursday to $3.302/MMBtu — the largest single-session percentage gain in months — after the EIA released its weekly storage report showing a smaller-than-expected inventory build against rising summer cooling demand. Dutch TTF (European benchmark) was flat (+0.19%), confirming this as a US-specific supply-demand tightening rather than a global LNG market signal. The IEA’s May 28 World Energy Investment report, also released today, noted that global natural gas infrastructure spending will surge to a 25-year high of $330 billion in 2026, driven substantially by AI data center power demand requirements.
Why it matters:Three portfolio considerations. (1) The +6.69% single-session move to $3.30+ is the most direct nat gas price catalyst for E&P names since winter. Henry Hub sustaining above $3.00/MMBtu significantly improves free cash flow projections for EQT, Antero Resources (AR), and Coterra Energy (CTRA) relative to their hedged book positions locked at $2.50-2.80 — E&P names see meaningful earnings upside if summer storage tightness persists. (2) For energy-intensive consumers — utilities running gas-fired generation, industrial manufacturers, and chemical producers using nat gas as feedstock — the +6.69% move is a direct cost headwind. Utilities with significant gas-fired generation exposure face compressed power margins if the spot price rise sustains; (3) The IEA’s identification of AI data center power demand as a structural driver of gas infrastructure spending is significant: this is the first authoritative multi-lateral agency publication to quantify AI’s contribution to natural gas infrastructure investment at a global scale. The 25-year-high $330B spending figure validates the AI power demand narrative with IEA authority.
What to watch:EIA storage report next Thursday for whether the undershooting trend persists; Henry Hub for sustained break above $3.50/MMBtu as the threshold signaling structural rather than seasonal tightness; NOAA summer temperature outlooks for cooling degree day trajectory through July-August.
UNCERTAIN
10. Anthropic Raises $65 Billion at $965 Billion Valuation — Largest Private AI Capital Raise Approaches $1 Trillion Mark; Resets AI Sector Benchmarks
The core facts:Anthropic, the AI safety-focused large language model company, closed what Reuters described as “one of the largest private capital sessions on record,” raising $65 billion in its latest venture financing round. The fresh capital pushes Anthropic’s private market valuation to $965 billion — placing it within striking distance of the public mega-cap technology tier, exceeding the market capitalizations of most S&P 500 companies, and surpassing the implied valuations of OpenAI’s prior funding rounds. The raise is approximately 4.5 times the size of Anthropic’s previous funding round in valuation terms.
Why it matters:The $965B private valuation resets the benchmark for AI foundational model investments with three immediate consequences for public equity positioning. (1) Competing AI labs — OpenAI, xAI, Mistral — will reprice their next funding asks relative to this Anthropic benchmark, and strategic investors who have taken positions in AI labs (Amazon has a major Anthropic stake, Google has invested significantly) will see their marks reset upward. This creates a financial reality where the largest AI model companies are functionally trillion-dollar entities in private markets, validating the premium multiples currently assigned to AI-adjacent public equities; (2) For public equity investors, the Anthropic raise creates a valuation reference problem: if private AI is valued at $965B, what derating should be applied to public AI infrastructure plays (NVDA, MSFT, GOOGL) that derive significant value from model access and infrastructure procurement? The Anthropic mark argues against multiple compression in the public AI supply chain; (3) Near-term practical impact: Anthropic now has capital to dramatically accelerate compute procurement — almost certainly benefiting NVDA and AMD GPU server revenues — increasing competitive pressure on OpenAI’s model development pipeline and on enterprise AI integration vendors competing for the same enterprise deals.
What to watch:OpenAI’s next funding announcement for whether it prices above or below Anthropic’s $965B benchmark; hyperscaler Q2 earnings (July) for any Anthropic-related compute procurement surge reflected in NVDA’s guidance; whether the SEC signals any intent to require disclosure or registration for private companies approaching trillion-dollar valuations.
BEARISH
11. GE Vernova (GEV) -3.48% to $996 — New Bearish Analyst Report Challenges AI Power Demand Valuation Thesis; Insider Selling Persists
The core facts:GE Vernova (GEV) fell -3.48% to $996.00 Thursday following publication of a bearish analyst report that directly challenged the company’s valuation basis. The report argued that GEV’s pricing — which has driven a +124% twelve-month gain — reflects “hyper-growth” expectations for AI-driven power infrastructure demand that are fundamentally disconnected from the physical limitations of gas turbine manufacturing capacity, supply chain lead times, and grid interconnection approval timelines. Insider selling has persisted in recent weeks, adding supply-side pressure. The decline extends Wednesday’s -3.60% loss (which was attributed to profit-taking with no specific catalyst), making today the first session with an identifiable new bearish trigger for GEV.
Why it matters:Three portfolio implications. (1) The analyst report does not challenge the long-run AI power demand thesis — it challenges the speed at which that demand can translate into GEV revenue. GE Vernova’s turbine manufacturing backlog is supply-constrained, meaning new hyperscaler orders cannot be delivered quickly enough to justify the current multiple in near-term revenue growth. If investors are pricing FY2027-2028 hyperscaler power contracts that depend on manufacturing capacity that does not yet exist, the stock is priced for outcomes requiring years to materialize — duration risk at a premium multiple; (2) The combined two-day decline of approximately -6.9% (Wednesday + Thursday) marks a transition from profit-taking to fundamental re-evaluation, with the stock approaching the $1,000 psychological and technical support level. Investors who hold GEV at elevated prices from the AI power theme premium face increasing pressure to recalibrate position sizing; (3) For sector allocators in AI infrastructure, the GEV pullback is a warning about sequencing risk: data centers need power, but power infrastructure has irreducible physical construction timelines. Stocks priced for immediate AI power revenue without accounting for manufacturing and interconnection constraints carry meaningful duration mismatch risk.
What to watch:GEV’s next earnings call for order backlog, manufacturing capacity additions, and delivery timeline guidance versus investor expectations; whether additional analysts follow with valuation discipline downgrades; GEV share price behavior around $950–$1,000 as the near-term consolidation range.
UNCERTAIN
12. FOMC Fissure: NY Fed’s Williams Says Policy “Well-Positioned” While St. Louis Fed’s Musalem Warns AI Productivity Cannot Rescue the Fed from Inflation
The core facts:Two Federal Reserve officials delivered conflicting policy signals Thursday. New York Fed President John Williams stated that current monetary policy is “exactly where officials want it to be” — noting that despite renewed inflationary pressures from the Iran war and residual tariffs, price increases are “expected to peak in the coming months,” allowing the Fed space to remain data-dependent. Speaking at a conference in Iceland, St. Louis Fed President Alberto Musalem took a sharply divergent stance, warning that policymakers “cannot depend on a future artificial intelligence productivity boom to settle current elevated inflation.” Musalem stated the ongoing war has renewed price dynamics and that interest rates “may need to remain restrictive or head higher” if inflation remains stubborn.
Why it matters:The Williams-Musalem split adds a third distinct FOMC voice to the picture established this week by Cook’s explicit “prepared to raise rates” language. Three implications for portfolio positioning. (1) Williams’s “well-positioned” framing places the most institutionally powerful Fed president — the New York Fed operates the FOMC trading desk — on the patient end of the current spectrum. His expectation that prices will “peak in the coming months” is the most optimistic FOMC assessment available. However, this conditionality is entirely tied to inflation actually peaking — which today’s 3.8% PCE data has not yet confirmed as a trend; (2) Musalem’s AI-productivity warning is novel and portfolio-relevant: it closes the “AI will fix inflation through productivity gains” escape valve that some market participants have used to justify maintaining premium equity multiples alongside persistent 3.8% PCE. If the FOMC formally adopts the view that AI productivity benefits are too uncertain and too distant to discount into current policy, there is no soft landing narrative available that simultaneously holds current inflation levels and current equity multiples; (3) The three-voice divergence — Williams patient, Musalem hawkish, Cook explicitly ready to hike — means the June 11-12 FOMC meeting will be a genuine debate rather than a consensus hold. The meeting statement language will either validate the equity market’s patience assumption or challenge it.
What to watch:June 11-12 FOMC meeting statement for whether rate-hike language from individual speeches migrates into formal committee guidance; any further Williams commentary on inflation trajectory timing; May CPI data (mid-June) as the next direct test of Williams’s “peaking inflation” thesis.
— Separating signal from noise since 2007. Apply for membership at join.recessionalert.comE. ECONOMY WATCH -> TOP
Q1 GDP was revised to 1.6% — a full 40bp miss — as preliminary corporate profits collapsed -0.4% QoQ against a +5.7% consensus, the sharpest earnings-power signal in six quarters. April personal income stagnated at zero growth while spending held at 0.5%, widening the income-consumption gap that historically precedes consumer deceleration by 6–9 months; real per capita DPI is now -1.4% YoY. New home sales fell 11% year-over-year as mortgage rates hold near 9-month highs, while durable goods’ headline +7.9% surge masked a -1.1% core capex miss — the Boeing-aircraft distortion the Fed’s Beige Book already flagged. GDPNow’s Q2 tracker fell to 3.8% after today’s data, and Williams reiterated “well-positioned” — but the income-profit-housing trio argues the soft landing is under fresh stress.
Q1 2026 GDP Revised Down to 1.6%; Corporate Profits Plunge -0.4% vs. +5.7% Consensus (BEA, May 28, 2026)
What they’re saying:The Bureau of Economic Analysis revised Q1 2026 real GDP growth down to 1.6% annualized — 40 basis points below the 2.0% advance estimate and a full miss against the 2.0% market consensus, versus just 0.5% growth in Q4 2025. Separately, preliminary corporate profits fell -0.4% QoQ, cratering against a +5.7% consensus and sharply decelerating from Q4 2025’s $246.9B gain — the worst profit-growth miss in six quarters.
The context:The Q1 revision reflects genuine downward re-estimates of consumer spending and investment, not statistical noise. The corporate profit collapse is the more significant signal: it suggests S&P 500 earnings power may have peaked even as tariff and energy cost pressures persist, and it calls into question the durability of the 84% EPS beat rate seen in Q1 reporting season. In response to today’s BEA data, the Atlanta Fed cut its Q2 GDPNow tracker from 4.3% to 3.8% — a Q2 rebound remains the base case, but the magnitude is shrinking.
What to watch:Q2 GDPNow trajectory (currently 3.8%); Q2 corporate earnings guidance in July–August season; Friday Chicago PMI for the May manufacturing pulse.
April PCE In-Line But Personal Income Stalls at Zero; Real Disposable Income Falls -1.4% Year-Over-Year (BEA, May 28, 2026)
What they’re saying:April headline PCE rose 0.4% MoM (vs. 0.5% expected), with the year-over-year rate holding at 3.8%. Core PCE rose 0.2% MoM (vs. 0.3% expected) and 3.3% YoY. Personal income was essentially flat — less than 0.1% growth vs. a 0.4% consensus — while personal spending held at 0.5% MoM. Real per capita disposable personal income fell -1.4% year-over-year.
The context:The monthly PCE miss is a marginal near-term positive for the Fed — but inflation at 3.3–3.8% remains nearly double the 2% target. The more consequential signal is the income-spending gap: consumers are maintaining spending by drawing down savings, a pattern Fed research flags as a leading indicator of consumption deceleration within 6–9 months. With real per capita disposable income contracting year-over-year, the consumer spending pillar that anchored Q1 and is powering Q2 GDPNow faces a structural headwind.
What to watch:June PCE release (July); personal saving rate for May; credit card delinquency data from major bank Q2 earnings (July).
April New Home Sales Plunge to 622K — 7% Below Consensus, 11% Below Year-Ago Level (Census Bureau, May 28, 2026)
What they’re saying:New single-family home sales declined to a seasonally adjusted annual rate of 622,000 in April, missing the 670,000 consensus by 7.2% and falling 6.2% from March’s 663,000 pace. Year-over-year, sales are 11.3% below April 2025’s 701,000 rate — the deepest annual decline since late 2024.
The context:Mortgage rates holding near 9-month highs above 6.5% are the direct driver — affordability stress translates to demand destruction in new homes faster than existing, where inventory remains constrained. April’s print is the weakest since late 2024 and contradicts the homebuilder narrative that demand had stabilized. The data adds downside pressure to residential investment in Q2 GDP tracking and suggests the housing recovery thesis from H2 2025 is stalling under rate pressure.
What to watch:May existing home sales (June); 30-year mortgage rate trajectory; homebuilder earnings guidance in Q2 season (July–August).
April Durable Goods Orders Jump +7.9%, But Headline Flatters — Core Capex Falls -1.1% (Census Bureau, May 28, 2026)
What they’re saying:New orders for manufactured durable goods surged 7.9% in April to $346B, nearly doubling the 3.5% consensus — but the beat is almost entirely attributable to nondefense aircraft and parts, which soared +165.9%. Excluding transportation, orders rose 1.1% (vs. 0.5% expected). Core capital goods orders ex-defense and ex-aircraft — the primary proxy for business investment intentions — fell -1.1% MoM vs. a +0.4% consensus.
The context:The headline number is a Boeing-driven distortion. Core capex missed for the second consecutive month — consistent with the Beige Book’s “wait-and-see” tone among executives navigating tariff uncertainty and the Iran conflict. If the pattern persists, it challenges the narrative that AI-driven capex is broad-based; instead, investment growth may be concentrated in a narrow corridor of hyperscaler and defense spending, leaving the industrial base in contraction.
What to watch:May durable goods release (June); ISM manufacturing new orders sub-index; Q2 capex guidance from industrials and tech earnings (July–August).
Fed’s Williams: Policy “Well-Positioned” as Iran War and Tariff Pressures Push Inflation Higher (NY Fed, May 28, 2026)
What they’re saying:New York Fed President John Williams stated that monetary policy is “well-positioned right now” to respond to the economic effects of the US conflict in Iran. Williams expects the pace of price increases to peak over coming months, giving the Fed space to assess how geopolitical and tariff pressures develop before adjusting the policy rate.
The context:Williams’ “well-positioned” framing is a deliberate holding pattern — neither signaling a cut nor endorsing a hike. With Cook flagging rate-hike readiness the prior day and Williams reiterating patience today, the FOMC’s messaging reflects genuine internal tension: today’s GDP miss and income stagnation support a wait-and-see posture, while PCE holding at 3.8% and Polymarket pricing a 32% hike probability keep tightening live. The Fed is navigating stagflation-lite conditions where the standard easing-or-tightening binary does not cleanly apply.
What to watch:June FOMC meeting (June 17–18); June CPI release (July 14); any dissent signals from Fed Governors Bowman or Paulson (both speaking Friday).
— Know the probability before the market prices in the risk. Apply for membership at join.recessionalert.comF. EARNINGS WATCH -> TOP
YESTERDAY AFTER THE BELL (Markets Reacted Today)
BULLISH
13. Marvell Technology (MRVL): +5.07% AH | Record Q1 FY2027 Revenue; FY27 AI Custom Silicon Guide Raised to $11.5B
The Numbers:Q1 FY2027 revenue $2.418B (record, +28% YoY; consensus $2.41B, beat); Non-GAAP EPS $0.80 vs. $0.75 consensus (+6.7% beat); Non-GAAP gross margin 58.9%. Q2 FY27 guide: revenue $2.700B ±5%, Non-GAAP EPS $0.93 ±$0.05. Full FY27 guide: revenue ~$11.5B (~40% growth YoY). Released: AMC May 27, 2026.
The Problem/Win:Marvell beat on revenue and EPS and then raised the full-year revenue guide to $11.5B — a 40% growth trajectory anchored in AI custom silicon programs (XPU/ASIC designs for hyperscaler partners). The after-hours reaction of +5.07% confirms the beat was read as genuine acceleration in AI custom chip demand, not cost-reduction-driven. The record Q1 revenue removes execution doubt around Marvell’s pivot from commodity networking chips to bespoke AI inference accelerators.
The Ripple:Positive sector read-through for the AI custom silicon supply chain. Competing custom ASIC providers and EDA software companies (Synopsys, Cadence) see validation of the AI custom chip design cycle. Broadcom, Marvell’s primary competitor in custom silicon, faces renewed investor pressure to match Marvell’s FY27 guidance ambition at its next earnings update.
What It Means:Marvell’s $11.5B FY27 guide at 40% growth represents the institutionalization of AI custom silicon as a multi-year revenue engine. The AI custom chip cycle is no longer speculative — it is guidanced and anchored in contracted hyperscaler relationships. Portfolio managers positioned in AI semiconductor diversification beyond Nvidia should hold this result as a structural confirmation.
What to watch:Marvell’s next earnings for expansion of hyperscaler XPU programs beyond current Google and Amazon partnerships; Broadcom custom ASIC updates for competing pipeline disclosures at its next earnings call.
UNCERTAIN
14. Salesforce (CRM): AH: flat | Record Q1 FY2027; 31% EPS Beat Offset by Guidance Below Street’s Elevated Expectations
The Numbers:Q1 FY2027 revenue $11.13B vs. $11.05B consensus (+0.7% beat); Non-GAAP EPS $3.88 vs. $2.96 consensus (+31.1% beat, record); GAAP EPS $2.42 (+52% YoY); Non-GAAP operating margin 34.8% (record, +250 bps YoY); cRPO $33.6B (+14% YoY). FY27 revenue guide raised to $45.9B–$46.2B; Q2 guide $11.27B–$11.35B. $25B accelerated share repurchase program launched. Released: AMC May 27, 2026.
The Problem/Win:The 31% EPS beat is among the largest in Salesforce’s history and reflects record operating margins on Agentforce AI platform monetization and continued cost discipline. The $25B accelerated buyback sends a strong capital return signal. However, the AH reaction was flat because the full-year revenue guidance raise, while positive, was viewed as insufficiently aggressive relative to the magnitude of the Q1 beat — the market expected a larger FY27 guide increase, suggesting either Q1 included timing benefits or management chose conservative guidance framing.
The Ripple:The enterprise software sector (IGV +2.8% today) drew partial uplift from Salesforce’s result combined with Snowflake’s May 27 beat — the sector is in relief-rally mode after months of AI disruption anxiety. The CRM flat AH, despite the massive EPS beat, underscores that the market is specifically discounting revenue acceleration rather than margin expansion as the Agentforce monetization proof point needed for re-rating.
What It Means:Salesforce is executing at the highest margin levels in its history while the stock trades approximately 32% below its 2026 YTD high. The combination of record margins, 31% EPS beat, and $25B buyback creates a technical floor, but re-rating requires Agentforce adoption evidence that demonstrates revenue acceleration, not just cost efficiency. The Q2 result will be the arbiter.
What to watch:Q2 FY27 Agentforce seat count and dollar attach rate for genuine AI platform revenue acceleration evidence; whether the $11.27–11.35B Q2 guide represents conservative framing or a true ceiling on near-term growth.
BULLISH
15. Synopsys (SNPS): AH: n/a | Q2 FY2026 Revenue +42% YoY to $2.276B Including ANSYS Integration; EDA Organic +8%; FY26 EPS Guide Raised to $14.76
The Numbers:Q2 FY2026 revenue $2.276B (vs. $1.604B in Q2 FY2025, +42% YoY); ANSYS segment $652M (including $12.5M revenue increase from gross channel accounting approach); Design Automation (EDA) segment $1.822B (+8% YoY organic). Beat company guidance. FY2026 non-GAAP EPS guidance raised to $14.76 midpoint on expanded operating margin and accelerating ANSYS integration synergies. Released: AMC May 27, 2026.
The Problem/Win:The ANSYS acquisition integration is running ahead of operating margin expectations — the revised channel accounting approach and accelerating synergies support an EPS guidance raise less than one full year post-close. Organic EDA growth of +8% confirms baseline AI chip design demand is intact and compounding independent of the acquisition. The beat-and-raise marks a clean quarter removing the primary integration execution risk that had overhung the stock since the ANSYS deal closed.
The Ripple:Positive EDA sector read for competitor Cadence Design Systems (CDNS), which faces pressure to confirm similar AI chip design demand when it reports. Semiconductor customers designing AI chips require EDA software at the front end of the design cycle — SNPS’s strong Q2 confirms the AI chip supply chain is running at full capacity from design through fabrication.
What It Means:Synopsys is now a combined EDA and simulation platform with over $2.2B in quarterly revenue. The AI chip design cycle is sustaining 8%+ organic EDA growth while the ANSYS merger adds a second structural growth pillar in industrial simulation. Integration execution risk — the overhang at deal close — is derisking ahead of schedule.
What to watch:Next Synopsys earnings for ANSYS organic growth versus acquisition accounting benefits; CDNS Q2 results for EDA sector demand cross-check; whether aerospace and defense simulation (ANSYS’s primary non-chip segment) faces any government budget headwinds.
TODAY BEFORE THE BELL (Markets Already Reacted)
No major earnings before the bell from US-domiciled companies with >$100B market cap. Three Canadian banks reported BMO (Royal Bank of Canada, Toronto-Dominion, CIBC) but are ADR-excluded per selection criteria.
TODAY AFTER THE BELL (Markets React Tomorrow)
UNCERTAIN
16. Costco Wholesale (COST): AH: flat | Q3 FY2026 Revenue Beats at $70.53B; EPS Slight Miss; Comps +9.8% With 89.7% Renewal Rate
The Numbers:Q3 FY2026 revenue $70.53B vs. $69.81B consensus (beat); EPS $4.93 vs. ~$4.97 consensus (slight miss); comparable sales +9.8%; digitally-enabled comps +21.5%; membership renewal rate 89.7%; total cardholders 148.5 million. AH reaction: essentially flat on mixed results. Released: AMC May 28, 2026.
The Problem/Win:Revenue beat is solid and the 9.8% comparable sales growth in a “wait-and-see” consumer environment — as characterized by the Fed’s May 27 Beige Book — confirms the Costco membership model is resilient to tariff anxiety and consumer caution. The 89.7% renewal rate is structurally strong. However, the slight EPS miss at 52x forward earnings leaves no margin for disappointment at Costco’s premium valuation, which explains the flat AH reaction despite the revenue beat.
The Ripple:Costco’s 9.8% comp growth is a positive read-through for discount and bulk retail — it signals value-seeking consumer behavior and wallet-share gains at scale. BJ’s Wholesale and dollar stores see validation. Premium full-price and specialty retailers face a persistent headwind from the same consumer rotation toward value.
What It Means:The flat AH is appropriate for an in-line quarter at a stretched valuation. The core investor question for COST now is whether tariff-driven price increases erode Costco’s pricing advantage versus competitors over the next two quarters. Costco’s value proposition is anchored in price differential — if tariffs compress that differential, traffic and comp sales growth could slow materially.
What to watch:Q4 FY2026 earnings (expected September) for comp sales trajectory and any tariff pass-through impact on the membership value model; management commentary on tariff exposure during today’s earnings call.
BULLISH
17. Dell Technologies (DELL): AH: n/a | Q1 FY2027 Record Revenue $43.8B (+88% YoY); AI Server Revenue +757% YoY to $16.1B; Non-GAAP EPS Beats +64%
The Numbers:Q1 FY2027 revenue $43.8B (record, +88% YoY); Non-GAAP EPS $4.86 vs. $2.96 consensus (+64% beat, record, up 214% YoY); GAAP diluted EPS $5.24 (up 282% YoY); AI orders $24.4B booked in Q1; AI server revenue $16.13B (+757% YoY); ISG (Infrastructure Solutions Group) total $29.01B (+181% YoY). FY27 guide: revenue $138B–$142B (midpoint $140B, +23% YoY); AI revenue ~$50B (~100% YoY). Released: AMC May 28, 2026 (conference call 4:30 PM EST). AH reaction pending market open Friday.
The Problem/Win:This is one of the most extraordinary single-quarter results in Dell’s history. AI server revenue growing +757% YoY from a standing start confirms Dell’s enterprise AI hardware strategy as the primary direct beneficiary of the hyperscaler-to-enterprise AI server buildout wave. The $24.4B in AI orders booked in Q1 alone represents a near-term delivery pipeline providing exceptional revenue visibility. A 64% EPS beat at this scale is not a revision artifact — it reflects genuine, explosive AI hardware demand that consensus models failed to anticipate.
The Ripple:Dell’s result is the most bullish confirmation to date for the entire AI server supply chain. SuperMicro (SMCI), Vertiv (VRT), Arista Networks (ANET), and power and cooling infrastructure names face a strong positive demand signal. Nvidia’s H100/H200/Blackwell ecosystem benefits as the primary GPU supplier to Dell AI servers. Critically, this result validates that enterprise demand — not just hyperscaler — for AI infrastructure is accelerating, confirming the AI capex cycle is broadening beyond the major cloud providers.
What It Means:Dell has transformed from a mature PC and storage company into a high-growth AI infrastructure platform in a single fiscal year. The $140B FY27 revenue guide would place Dell among the largest revenue generators in the S&P 500. The magnitude of this beat argues that AI infrastructure demand is still materially above what the analyst community has modeled — a signal with positive read-through for the entire AI hardware supply chain.
What to watch:DELL’s opening price Friday morning for the magnitude of the post-earnings market reaction; Q2 FY27 AI orders intake for whether the $24.4B Q1 pipeline sustains or accelerates further; SMCI and Vertiv for sympathy moves as AI server supply chain read-throughs.
WEEK AHEAD PREVIEW:
Q1 2026 earnings season is functionally complete with approximately 92% of S&P 500 companies having reported. With earnings_upcoming.gif showing no US-domiciled companies with >$100B market cap scheduled for Friday May 29, this earnings cycle’s major story-generating capacity is effectively exhausted for the current week.
The macro calendar takes over as the primary market driver: Friday May 29 brings Chicago PMI (consensus 49.7) and the Goods Trade Balance advance estimate for April (consensus -$87B). Fed Governor Bowman and newly installed Fed Governor Paulson are both scheduled to speak on Friday — after this week’s Cook-Williams-Musalem FOMC messaging divergence, their comments will be closely read for any emerging consensus position heading into the June 11-12 FOMC meeting. Dell Technologies (DELL) and Costco Wholesale (COST) AH reactions at Friday’s open will be the session’s primary equity catalyst in lieu of fresh corporate earnings.
Looking further ahead, the next major earnings catalyst arrives with hyperscaler Q2 reports in late July — at which point Dell’s AI server demand thesis and the Marvell FY27 $11.5B guide will be tested against actual Q2 hyperscaler capex commitments.
— US market commentary trusted by family offices and institutions. Apply for membership at join.recessionalert.comG. WHAT’S NEXT -> TOP
UPCOMING RELEASES:
| Date | Event | Why It Matters |
|---|---|---|
| Fri, May 29 | Chicago PMI (expected: 49.7) | Key leading indicator of national manufacturing momentum; reading below 50 would confirm the core capex contraction trend from today’s Durable Goods miss and build the case for ISM Manufacturing weakness next week. |
| Fri, May 29 | Goods Trade Balance Adv (expected: ‑$87B) | First read on April trade flows; a wider deficit would subtract from Q2 GDP tracking and add pressure to the Atlanta Fed’s 3.8% GDPNow estimate, which already reflects a step-down from 4.3%. |
| Fri, May 29 | Fed Bowman & Paulson Speeches | With Cook (hike-ready), Williams (patient), and Musalem (hawkish) already on record this week, Bowman and Paulson’s tone will complete the current pre-FOMC Fed communication picture — any hawkish lean adds to June meeting hike probability. |
| Tue, Jun 2 | ISM Manufacturing PMI (May) | National manufacturing barometer and direct confirmation check on today’s core capex ‑1.1% miss; a sub-50 reading and weak new orders sub-index would confirm business investment is contracting, increasing the likelihood of Q3-Q4 earnings headwinds for industrials. |
| Fri, Jun 5 | May Non-Farm Payrolls | The single highest-impact upcoming data point: a strong print (+200K+) locks the Fed on hold and supports the risk-on equity narrative; a weak print (<150K) deepens the stagflation-lite dilemma — soft growth with inflation still at 3.8% is the worst-case FOMC input ahead of the June meeting. |
KEY QUESTIONS:
1. Will the June FOMC move toward formal rate-hike language? With Williams patient, Cook explicitly ready to hike, and Musalem rejecting the AI-productivity inflation escape valve — and PCE anchored at 3.8% — does the committee stay on hold or begin a new tightening cycle?
2. Can the AI-driven equity rally sustain record valuations when Q1 corporate profits just posted their worst quarterly miss in six years? The next test is Q2 earnings guidance season (beginning July) — if guidance disappoints, the multiple supporting today’s S&P 500 all-time high has no floor.
3. Does the Iran-US ceasefire MOU hold? Prior frameworks were labeled “fabrications” by Tehran, and Oman’s compliance monitoring is the key signal to watch — a breakdown would rapidly reverse the energy sector’s pricing of de-escalation and push WTI back toward the $95–$99 range.
— US market commentary trusted by family offices and institutions. Apply for membership at join.recessionalert.comH. CHART OF THE DAY -> TOP
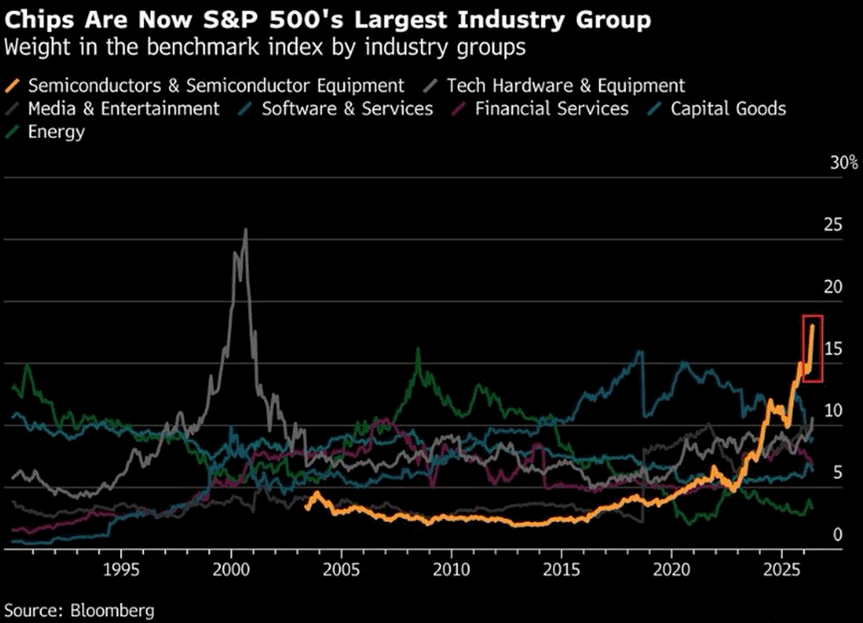
Every prior time one industry pushed to extreme weight in the S&P 500, the index topped with it. Media & Entertainment hit ~24% in March 2000 — the bell at the dot-com peak. Financial Services reached ~22% in October 2007 — weeks from the cycle high. Energy crested ~16% in mid-2008, before the GFC second leg. Three for three. Chips at ~17% in May 2026 is the fourth setup, and the trajectory — five percent to seventeen in three years — traces Media’s 1998-2000 vertical arc. The slope is the diagnostic, and the composition is sharper still: prior peaks spread across dozens of constituents, today’s ~17% is single-name-heavy, NVDA alone near 7% of the S&P. Vertical expansions are built by concentrated mark-to-market in a handful of leaders absorbing the marginal passive bid; the curve goes parabolic, the unwind mechanical. Every passive dollar — roughly $10T of household savings embedded in pensions, 401(k)s, target-date funds — now carries that chip beta whether the holder consented or not. The pattern is not a forecast. It is a precedent waiting on its catalyst.
Market Intelligence Brief (MIB) Ver. 18.37
For professional investors only. Not investment advice.
© 2026 RecessionALERT.com

Comments are closed.