
Iran state media’s Hormuz peace framework crashed WTI 4.69% to $89.49 and lifted the Dow to record 50,670; the White House called it a “complete fabrication.” Fed Governor Cook issued 2026’s clearest hike signal — “I am prepared to raise rates” — with April PCE at 3.8% due Thursday. Snowflake surged 34% on record sequential growth and a $6B AWS deal; QCOM shed 6% after a near-30% weekly run. Thursday’s GDP, PCE, and durables are the year’s peak positioning risk.
TABLE OF CONTENTS
A. EXECUTIVE SUMMARY
B. MARKET DATA
C. HIGH-IMPACT STORIES (5)
D. MODERATE-IMPACT STORIES (8)
E. ECONOMY WATCH (5)
F. EARNINGS WATCH (3)
G. WHAT’S NEXT
H. CHART OF THE DAY
A. EXECUTIVE SUMMARY -> TOP
The day ran two simultaneous stories: Iran state media’s Hormuz peace framework — denied by the White House as a “complete fabrication” — was enough to crash WTI 4.69% to $89.49 and drive the Dow to a new record at 50,670, even as Federal Reserve Governor Cook delivered 2026’s most explicit rate-hike signal on the same afternoon. The oil move is a cost tailwind, not demand collapse — every $10/barrel sustained Brent decline removes 25–30 bps from headline CPI projections, directly intersecting Cook’s inflation calculus and Thursday’s consequential PCE print. Bond markets correctly read the relief as single-event geopolitical, not structural: the 10-year yield eased only 1.1 bps to 4.481% and VIX fell 4.23% — no repricing of the Fed’s rate path. Consumer Cyclical (+1.48%) and Transports (+1.36%) led on fuel savings; Energy (−1.84%) and Tech (−0.41%) lagged — confirming rotation, not broad-based buying.
• Iran Hormuz framework (UNCERTAIN): WTI −4.69% to $89.49; Dow +0.36% to record 50,670; White House called the document a “complete fabrication” — the relief trade is live but the underlying catalyst is unverified and fully reversible.
• Fed Governor Cook: “I am prepared to raise rates” — the most direct hike signal from any FOMC member in 2026; April PCE tracking 3.8% headline / 3.3% core (highest since 2023); official data due Thursday morning.
• Mega-Data Thursday (May 28): Q1 GDP 2nd estimate (consensus 2.0% vs. 0.5% advance), April PCE, Durable Goods, and Personal Income all release simultaneously — highest single-day positioning risk of the 2026 calendar.
• SNOW +34%: Snowflake Q1 FY2027 product revenue +34% YoY — “strongest sequential dollar growth in company history” — plus $6B five-year AWS infrastructure deal; confirms enterprise AI software acceleration after a deceleration quarter.
• Semiconductor bifurcation: QCOM −6.18% (profit-taking after near-30% weekly surge on ByteDance deal); MU +3.63% crossing $1T market cap (Barclays +74% PT raise to $1,175) — AI memory thesis validated; mobile AI execution risk is not.
• Stagflation signals accumulate: Beige Book records first “slight decline” since early 2024 across all 12 districts; mortgage rates hit 9-month high at 6.65% (5th consecutive rise); MBA apps −8.5%; Dallas Fed Logan calls 13M bpd Hormuz supply gap “structural, not transitory.”
1. The Iran–Fed Paradox — The Hormuz peace signal delivered the first meaningful inflation relief of 2026 — WTI’s 4.69% decline, if sustained, removes 25–30 bps from CPI forecasts and is a direct cost tailwind for consumer and transport margins. But Governor Cook chose the same session to explicitly place a rate hike in the FOMC’s reaction function. The two forces run simultaneously in opposite directions, and Thursday’s PCE print is the arbiter: a 3.8% headline confirmation forces hawkish June FOMC signaling regardless of where oil is that week; a downside surprise below 3.5% opens the door to patience even with Cook’s language on the record.
2. Stagflation Signal Accumulating — Three data points today point in the same direction: the Beige Book’s first “slight decline” characterization since early 2024; Logan’s structural framing of the 13M bpd Hormuz supply gap as non-transitory; and mortgage rates at a 9-month high with MBA applications collapsing for a fifth consecutive week. All three signal decelerating activity alongside persistent price pressure. The consensus scenario for Thursday — GDP 2.0% with PCE 3.8% — would cement this narrative with the highest-quality data available. Corporate earnings guidance in July will be the first stress test of whether the Beige Book’s margin compression warning materializes at the company level.
3. Enterprise AI Acceleration Is Confirmed — at a Specific Layer — Snowflake’s record sequential growth and MU’s second major bank upgrade in two sessions establish that the AI investment cycle is accelerating in the data infrastructure and memory layers, not just at the model/chip level. The market is increasingly discriminating: companies with contracted structural AI revenue — HBM memory, data pipelines, cloud infrastructure — are outperforming companies with deal-specific or mobile-AI execution risk. Nvidia’s $150B/year Taiwan commitment simultaneously validates TSMC’s irreplaceable supply-chain position and concentrates AI infrastructure geopolitical risk in a single flashpoint.
 — Leading economic indicators. Accurate market forecasts. Apply for membership at join.recessionalert.com
B. MARKET DATA -> TOP
Iran’s signal to restore Strait of Hormuz commercial traffic within one month crashed WTI crude 4.69% to $89.49 and simultaneously drove the Dow to a new record as lower energy costs accrued to consumer and industrial names. The session was two stories: Consumer Cyclical led at +1.48% and transports surged on fuel savings, while the Nasdaq dipped as the semiconductor complex cooled — QCOM fell 6.18% after a near-30% weekly run, while Micron jumped 3.63% on analyst upgrades to $1,625. Gold and the entire precious metals complex retreated on reduced safe-haven demand. The oil decline is supply-channel relief, not demand collapse — a cost tailwind for margins that supports the bull case if the Iran détente holds.
CLOSING PRICES – Wednesday, May 27, 2026:
MAJOR INDICES
DJ Transportation’s +1.36% vs the Dow’s +0.36% tells the day’s story most cleanly: oil’s 5% crash directly benefits freight, airline, and logistics names, pulling transports ahead of blue-chip industrials. The Nasdaq’s -0.09% vs S&P’s near-flat session confirms the move was consumer- and industrial-led, not tech-driven. Dow Theory bull confirmation extends into a 7th consecutive session — with both DJIA and DJTA printing above their 10-session highs today, the pattern is entrenched. NYSE slipping -0.12% while S&P held flat signals energy sector losses weighed on broader breadth.
| Index | Close | Change | %Move | Why It Moved |
|---|---|---|---|---|
| S&P 500 | 7,520.46 | +1.34 | +0.02% | New record; Iran-driven oil crash lifted consumer/cyclicals while semiconductor profit-taking offset — net flat at record close |
| Dow Jones | 50,644.41 | +182.73 | +0.36% | New record; blue-chip consumer and industrial composition benefited most from $4/bbl oil decline on Strait of Hormuz peace signal |
| DJ Transportation | 21,497.2 | +287.9 | +1.36% | Airlines, truckers, and logistics names surged directly on fuel cost savings from WTI -4.69%; transports outpaced all major indices |
| Nasdaq 100 | 29,973.57 | -27.75 | -0.09% | Semiconductor profit-taking (QCOM -6.18%, KLAC -2.69%) weighed; META and AMZN gains partially offset; narrowly negative |
| Russell 2000 | 2,920.84 | +0.30 | +0.01% | Small caps essentially flat; oil-sensitive names and limited semiconductor exposure netted near-zero |
| NYSE Composite | 23,267.07 | -28.43 | -0.12% | Slight dip as Energy sector drag (-1.84%) weighed on broader market breadth despite Dow/S&P holding at records |
VOLATILITY & TREASURIES
VIX fell 4% while yields eased 1–2 bps — textbook risk-on confirmation of the Iran relief trade. The 2Y shed slightly more than the 10Y (-1.5 vs -1.1 bps), a gentle steepening signaling no Fed policy repricing. Muted yield moves suggest this is a single-event geopolitical relief, not a structural inflation shift from lower oil — bond markets are not treating today’s Strait of Hormuz news as a regime change. DXY unchanged.
| Instrument | Level | Change | Why It Moved |
|---|---|---|---|
| VIX | 16.29 | -0.72 (-4.23%) | Iran Strait of Hormuz peace signal reduced geopolitical risk premium; options market pricing lower near-term volatility |
| 10-Year Treasury Yield | 4.481% | -1.1 bps | Modest bond bid on geopolitical relief; lower oil also slightly eases long-run inflation expectations |
| 2-Year Treasury Yield | 4.035% | -1.5 bps | Slight front-end bid; market not repricing Fed path meaningfully — no rate cut probability shift |
| US Dollar Index (DXY) | 99.21 | +0.03 (+0.03%) | Essentially unchanged; Iran relief trade broadly neutral for dollar — no safe-haven unwind or risk-on FX flow |
COMMODITIES
Every asset in this table declined — a unified signal that Iran’s Strait of Hormuz news flipped sentiment away from safe-haven and defensive positioning. Gold’s -1.07% reflects reduced geopolitical risk premium; copper’s modest -0.94% cautions that markets aren’t fully pricing a global growth recovery yet. Bitcoin’s -1.09% aligned with the mixed equity session rather than any crypto-specific catalyst.
| Asset | Price | Change | %Move | Why It Moved |
|---|---|---|---|---|
| Gold | $4,486.57/oz | -$48.43 | -1.07% | Iran peace signal reduced geopolitical safe-haven demand; risk-on rotation pulled capital from gold |
| Silver | $74.935/oz | -$1.671 | -2.18% | Followed gold lower; underperformed gold as industrial demand component also weighed amid global uncertainty |
| Copper | $6.3368/lb | -$0.0602 | -0.94% | Marginal decline; industrial demand outlook mixed — global growth uncertainty capping appetite for base metals |
| Platinum | $1,931.20/oz | -$20.40 | -1.05% | Precious metals complex broadly lower; safe-haven unwind pulled platinum in line with gold |
| Bitcoin | $75,319 | -$829 | -1.09% | Tracked mixed equity session; no crypto-specific catalyst — modest pullback aligned with risk-neutral tone |
ENERGY
WTI (-4.69%) and Brent (-3.85%) fell together — minimal spread widening confirms this was a global supply-channel catalyst (Strait of Hormuz), not a regional one. Natural gas rose +2.59%, trading its own domestic LNG/demand story entirely independent of the crude move. Critically: oil falling while equities rose is a cost tailwind, not a demand collapse — constructive for consumer margins, not stagflationary.
| Asset | Price | Change | %Move | Why It Moved |
|---|---|---|---|---|
| Crude Oil (WTI) | $89.49/bbl | -$4.40 | -4.69% | Iran state media confirmed intent to restore Strait of Hormuz commercial traffic within one month; ~20% of global oil supply routes through the strait |
| Crude Oil (Brent) | $92.95/bbl | -$3.72 | -3.85% | Same Iran/Strait of Hormuz catalyst; WTI/Brent spread near-unchanged confirms disruption resolution is global in nature |
| Natural Gas (Henry Hub) | $3.088/MMBtu | +$0.078 | +2.59% | Domestic LNG export demand and summer storage draws driving natural gas higher; decoupled from crude oil’s Iran-driven move |
| Natural Gas (Dutch TTF) | $15.82/MMBtu | -$0.35 | -2.19% | European gas prices fell modestly on Strait of Hormuz LNG supply restoration optimism; diverged from Henry Hub on regional dynamics |
S&P 500 SECTORS
Energy is today’s worst sector (-1.84%) yet the YTD leader (+27.43%) — a sharp single-session reversal from a structural trend. Consumer Defensive bounced +0.91% today after leading the 1-week laggards (-3.33%), while Consumer Cyclical topped the tape at +1.48% — both riding lower oil’s margin and purchasing-power tailwind. Technology’s -0.41% session dip barely registers against +10.04% 1-month gains; today’s move is rotation within a bull run, not a trend break.
| Sector | 1-Day | 1-Week | 1-Month | 3-Month | 6-Month | YTD | 12-Month |
|---|---|---|---|---|---|---|---|
| Consumer Cyclical | +1.48% | +5.05% | +2.82% | +3.73% | +6.49% | +0.87% | +13.22% |
| Consumer Defensive | +0.91% | -3.33% | +1.34% | -4.94% | +8.98% | +8.39% | +5.59% |
| Communication Services | +0.81% | +1.53% | +4.39% | +10.30% | +13.63% | +8.37% | +39.66% |
| Healthcare | +0.24% | +1.46% | +2.81% | -4.93% | -1.91% | -2.78% | +16.17% |
| Industrials | +0.14% | +4.59% | +1.99% | +0.96% | +21.22% | +15.75% | +30.23% |
| Real Estate | -0.18% | +1.70% | +1.98% | +1.77% | +7.72% | +9.01% | +10.44% |
| Technology | -0.41% | +4.83% | +10.04% | +20.81% | +26.38% | +21.27% | +52.30% |
| Basic Materials | -0.54% | +4.92% | -0.83% | -6.99% | +28.62% | +16.12% | +47.10% |
| Utilities | -0.66% | +2.11% | -3.24% | -4.72% | +4.42% | +6.65% | +15.41% |
| Financial | -0.69% | +1.68% | +0.64% | -0.47% | +4.24% | -2.50% | +11.18% |
| Energy | -1.84% | -6.49% | -1.29% | +5.49% | +27.88% | +27.43% | +40.12% |
TOP MEGA-CAP MOVERS:
GAINERS
| Company | Ticker | Close | Change | Why It Moved |
|---|---|---|---|---|
| Meta Platforms | META | $635.26 | +3.74% | Wells Fargo revised price target upward; raised 2026 AI capex to $125–145B signaling accelerating ad/AI platform investment; Communication Services sector led |
| Micron Technology | MU | $928.41 | +3.63% | UBS raised price target to $1,625 and Barclays lifted PT 74% to $1,175; AI HBM memory demand surge; MU crossed $1 trillion market cap milestone |
| Procter & Gamble | PG | $147.49 | +3.17% | Iran oil price crash reduces raw material and logistics input costs; consumer defensive sector rotation as margins expected to expand on lower energy costs |
| Amazon | AMZN | $271.88 | +2.48% | Consumer rotation trade; lower fuel costs benefit fulfillment/logistics margins; AWS AI cloud narrative sustained |
| Home Depot | HD | $317.85 | +2.35% | Consumer Cyclical sector leader; oil price decline boosts consumer disposable income; housing-adjacent spending benefits from cost tailwind |
DECLINERS
| Company | Ticker | Close | Change | Why It Moved |
|---|---|---|---|---|
| Qualcomm | QCOM | $233.44 | -6.18% | Profit-taking after near-30% weekly surge on AI/ByteDance chip deal; semiconductor sector rotation as investors rotated from high-flying AI chips into consumer names |
| GE Vernova | GEV | $1,031.89 | -3.60% | Profit-taking after +5.31% gain on May 26 and +124% over 12 months; analysts flagging AI data center growth increasingly priced in at current valuation |
| Palo Alto Networks | PANW | $248.47 | -3.22% | Cybersecurity names sold alongside broader tech/software sector rotation; profit-taking in high-multiple growth names |
| Palantir Technologies | PLTR | $132.51 | -2.99% | AI software name pulled back with tech sector rotation; high-multiple growth stocks giving ground to consumer/cyclical names |
| KLA Corporation | KLAC | $1,957.19 | -2.69% | Semiconductor equipment pulled back with QCOM and broader chip sector rotation; equipment names typically follow leading chip stocks in sector moves |
— Institutional-grade intelligence for serious investors. Apply for membership at join.recessionalert.comC. HIGH-IMPACT STORIES -> TOP
UNCERTAIN
1. Iran State TV Reports Draft Hormuz Peace Framework — White House Calls Document “Complete Fabrication”; WTI Crashes 4.69% to $89.49
The core facts:Iranian state television reported Wednesday that Tehran had obtained a draft unofficial framework for a memorandum of understanding with the United States to end the conflict. Under the proposed deal: Iran would restore commercial shipping through the Strait of Hormuz to pre-war levels within 30 days; the US would withdraw military forces from Iran’s vicinity and lift its naval blockade; and Iran would manage Hormuz traffic in cooperation with Oman. The framework specifically excludes military vessels and contemplates a binding UN Security Council resolution if finalized within 60 days. Iran’s government added it would take no steps “without tangible verification.” The White House immediately and forcefully rejected the report — describing the circulated document as “not true” and a “complete fabrication.” Oil markets traded the Iranian headline on release before partially recovering: WTI crude fell 4.69% to $89.49 (down from $93.89 on May 26); Brent crude declined 3.85% to $92.95 (down from $99.50). The news_hints note July crude contracts settled at $90.96, off $2.93 on the session. WTI has now fallen approximately $14/barrel from the recent peak near $103 as de-escalation hopes have built through the week.
Why it matters:Even with the White House denial, markets are materially pricing in a higher probability of Hormuz reopening than they were two weeks ago. Three portfolio implications: (1) The 4.69% single-session WTI decline is the largest since the conflict began — it represents a genuine re-pricing of the Hormuz risk premium, not a technical correction. Every $10/barrel sustained Brent decline removes approximately 25–30 bps from headline CPI projection, a critical input for the Fed’s rate-hike calculus under the Warsh framework; (2) The White House denial keeps the UNCERTAIN sentiment intact — the framework may be a negotiating signal from Tehran rather than a finalized deal, and the US refusal to validate it means investors cannot price this as a resolved risk. Tail scenarios in both directions remain live: a genuine de-escalation that reopens Hormuz vs. a reescalation following Washington’s explicit rejection; (3) The oil-price drop triggers immediate sector rotation: energy producers sold off while airlines, transport, and consumer-facing sectors rallied sharply on the prospective fuel-cost and purchasing-power tailwind. The Dow Jones Industrial Average hit a record high of 50,670 on the session as rate/inflation expectations reset lower.
What to watch:White House and State Department formal response for any shift from “complete fabrication” toward diplomatic engagement; Iran’s next formal statement for whether Tehran escalates or moderates its position after the US denial; Oman’s role as the designated traffic manager — Muscat’s public posture is the best leading indicator of whether backdoor negotiations are genuine; Brent crude for sustained hold below $95 as the threshold signaling markets believe reopening is likely.
BEARISH
2. Fed Governor Cook: “I Am Prepared to Raise Rates” — Sharpest FOMC Hawkish Signal in 2026; April PCE at 3.8% Due Thursday
The core facts:Federal Reserve Governor Lisa Cook delivered remarks at Stanford on Wednesday (May 27) in which she stated explicitly: “I am prepared to raise rates” if the current disinflation process fails to materialize. Cook noted that inflation is heading in the wrong direction — April PCE is tracking at 3.8% headline and 3.3% core, the highest core reading since 2023, with official data to be released Thursday May 28. While favoring holding rates steady for now and expecting some price cooling in coming months, her prepared-to-hike language explicitly places the rate-hike option on the table in a way no FOMC member has done with equal directness in the 2026 policy cycle. Her remarks also touched on AI’s role in financial system efficiency and long-run productivity, but the rate-hike statement dominated market reaction. Bloomberg characterized the remarks as bringing Cook “in line with a number of Fed officials who’ve signaled that accelerating inflation is now a bigger policy concern than the labor market.”
Why it matters:Cook’s statement is the most explicit rate-hike signal from the FOMC since the Warsh-led hawkish pivot began. Three implications: (1) The prepared-to-hike language is qualitatively different from prior “rates may need to stay higher for longer” framing — it places a policy tightening squarely in the reaction function. At 3.8% PCE headline with Iran-driven energy prices embeds, a hike decision in the H2 2026 window is now a credible scenario that risk assets must price; (2) Cook’s position in the Fed’s voting rotation matters — she is not a perennial hawk but a centrist whose hawkish turn signals the inflation concern has moved beyond the Warsh/Logan camp into the broader committee; (3) Thursday’s PCE print is now a direct policy trigger: if April PCE confirms 3.8% headline (as anticipated) or surprises higher, Cook’s language provides the institutional cover for the FOMC to accelerate hawkish signaling at the June meeting. The 10-year yield’s behavior around 4.50% (retreating on oil/Iran optimism but constrained by Cook’s remarks) captures the market’s conflicted assessment.
What to watch:Thursday’s April PCE print — 3.8% confirms Cook’s narrative; any surprise above 3.9% would immediately accelerate market pricing of a H2 2026 hike. Monitor the June FOMC meeting statement for explicit rate-hike language or “prepared to act” language migrating from individual speeches into the formal committee guidance.
BEARISH
3. Dallas Fed’s Logan at BOJ: Hormuz Supply Gap Is Structural, Not Transitory — US Can Add Only 250K bpd vs. 13M bpd Hormuz Shortfall
The core facts:Dallas Federal Reserve President Lorie Logan delivered a stark energy supply assessment at the Bank of Japan conference on Wednesday (May 27). Logan quantified the Hormuz supply disruption at approximately 13 million barrels per day — the total daily flow routed through the strait that has been curtailed since the conflict began. Against this, she stated that US production capacity can add only approximately 250,000 bpd by end of 2026 — a supply response ratio of less than 2%. Logan explicitly characterized the energy supply constraint as structural rather than temporary: temporary inventory drawdowns have been absorbing the gap to date, but those reserves are finite. Her remarks directly contradict the “transitory energy shock” thesis that some market participants have used to justify ignoring the inflation transmission from oil prices.
Why it matters:Logan’s remarks are analytically significant because they come from a regional Fed president with the most direct institutional expertise in energy markets — the Dallas Fed’s district is the heart of US shale production. The 250K bpd vs. 13M bpd comparison is damning: there is no feasible supply-side offsetting response available within the US production system. Three implications: (1) If Hormuz remains closed even partially, the energy shock is not self-correcting on any investable timeframe — it feeds into PCE directly and durably, supporting Cook’s rate-hike posture; (2) Logan’s explicit rejection of the “transitory” narrative eliminates the Fed’s most convenient escape valve for ignoring energy inflation. If the PCE print Thursday confirms 3.8%, the Fed cannot dismiss it as weather or one-time supply shock; (3) Energy sector strategists should note Logan’s data specifically contradicts the forward oil-price curve’s embedded assumption of Hormuz normalization within 3–6 months — if Logan’s structural framing is correct, any portfolio long energy equities as an inflation hedge faces duration risk longer than the equity market is currently pricing.
What to watch:US production data (EIA weekly inventory and rig count) for whether shale operators are accelerating drilling in response to elevated prices; any forward guidance from Logan or other Fed members on the threshold at which the energy supply shock explicitly drives FOMC rate decisions; OPEC+ spare capacity announcements for the only material non-US supply response available.
BEARISH
4. Federal Reserve Beige Book (May 27): Economic Activity Declines Slightly; Iran War and Tariffs Drive “Elevated” Uncertainty Across All 12 Districts
The core facts:The Federal Reserve released its Beige Book on Wednesday (May 27), covering economic conditions since late April across all 12 Federal Reserve Districts. The summary reported a slight decline in overall economic activity — a step down from the prior report’s “slight to modest growth” characterization. Regional business contacts across all 12 districts cited “elevated levels of economic and policy uncertainty” as the primary constraint on decision-making, driven overwhelmingly by the ongoing Iran war and recent tariff policy changes. Contacts across multiple sectors — manufacturing, services, transportation, agriculture — described a defensive wait-and-see posture on hiring, capital investment, and pricing. Employment held roughly steady at low levels of net change. Prices increased moderately, with energy-related input costs cited as the primary inflationary pressure accelerating in pace since the last report. Several districts noted that firms were absorbing higher energy and logistics costs rather than immediately passing them through, creating margin compression in energy-intensive industries.
Why it matters:The Beige Book is the Fed’s institutional qualitative signal about economic conditions — it does not have the statistical precision of BLS or BEA data, but it captures what businesses are actually doing and saying on the ground. Three implications: (1) The step-down from “slight to modest growth” to “slight decline” in the May 27 edition is meaningful — it represents the first time the Beige Book has characterized activity as declining since early 2024, and it arrives on the same day as two Fed officials explicitly prepared markets for rate hikes. The FOMC now faces a combination of declining activity AND rising prices — the classic stagflation configuration; (2) The universal “wait-and-see” hiring posture across all 12 districts is a leading indicator for the June employment report — if firms are not hiring, the June non-farm payrolls print will likely disappoint; (3) For corporate earnings guidance, the margin compression signal — energy cost absorption rather than pass-through — is a specific warning for Q2 guidance quality in July reports for transportation, industrials, and consumer staples. Watch Q2 earnings commentary closely for explicit guidance reductions tied to Beige Book dynamics.
What to watch:June 6 non-farm payrolls for first hard-data confirmation of the Beige Book’s wait-and-see hiring signal; the next Beige Book (July, ahead of the July FOMC) for whether the decline characterization deepens toward “modest decline” across multiple districts; Q2 corporate earnings guidance in July for explicit acknowledgment of margin compression from energy and logistics cost absorption.
BULLISH
5. Oil Crash Drives Dow Jones to Record 50,670 (+0.5%); Consumer Discretionary +1.48%, Transports +1.36% as Fuel Cost Tailwind Front-Run
The core facts:The Dow Jones Industrial Average surged 245 points (+0.5%) to a record close of 50,670.59 on Wednesday as oil’s 4.69% single-session crash reshaped the inflation and margin outlook for capital-intensive and consumer-facing sectors. Consumer Discretionary was the session’s top-performing sector at +1.48%; Transports surged +1.36% on direct fuel savings; Consumer Defensive rose +0.91% — the sharpest reversal for that group after being the prior week’s worst performer (-3.33%). Procter & Gamble (PG) surged +3.17% — a rare move of that magnitude for a defensive staple, capturing the market’s front-running of input cost relief. Consumer Cyclical sectors including retail and restaurants benefited from the expected purchasing-power tailwind of lower gasoline prices. The 10-year Treasury yield retreated modestly, supporting rate-sensitive sectors. The S&P 500 gained +0.1% to 7,509.77 and the Nasdaq Composite added +0.1% as tech was mixed — AI names broadly flat after Tuesday’s record surge. Energy sector fell -1.84% as oil producers sold off on lower realized prices.
Why it matters:The Dow record in a mixed-tape session illustrates a specific rotation dynamic critical for portfolio construction: the market’s major oil-sensitive beneficiaries are concentrated in the Dow’s industrials and consumer names, not in the Nasdaq’s tech-heavy composition. Three implications: (1) The consumer and transport sector surge is a direct relief valve for the inflation/spending story of the past two weeks — if Brent holds below $95, the two-thirds of consumers cutting spending (per Tuesday’s Conference Board data) face meaningfully lower gasoline bills, providing a demand tailwind for Consumer Discretionary names that has been absent since the Iran conflict began; (2) PG’s +3.17% signals the market is pricing input cost relief as durable, not a one-day trade — staples companies with global supply chains and energy-intensive operations (packaging, logistics, distribution) are among the primary beneficiaries of a sustained Brent decline; (3) The S&P 500’s relative underperformance vs. the Dow (+0.1% vs. +0.5%) reflects the index composition difference — energy and tech headwinds (QCOM, NVDA modestly lower) offset the consumer/transport tailwinds in the broader cap-weighted index. The rotation is sectorally specific, not broad-based.
What to watch:Brent crude for sustained hold below $95 — that level appears to be the threshold for consumer/transport sector rotation continuing vs. reversing; June gasoline retail prices for real-world pass-through of the WTI decline to consumer purchasing power; next week’s retail sales data for any early signal that the oil-price drop is translating to actual consumer spending.
— Quantifying recession risk so you don’t have to guess. Apply for membership at join.recessionalert.comD. MODERATE-IMPACT STORIES -> TOP
BEARISH
6. Qualcomm -6.18% — Parabolic 30%-in-a-Week AI Trade Unwinds; Semiconductor Sector Bifurcates Between Memory (MU +3.6%) and Mobile
The core facts:Qualcomm (QCOM) fell 6.18% on Wednesday after surging approximately 30% in a single week on enthusiasm surrounding the ByteDance AI chip deal and mobile AI monetization prospects. No new negative news catalyst emerged Wednesday — the decline is classic profit-taking after a parabolic single-week move, compounded by rotation within the semiconductor sector. Simultaneously, Micron Technology (MU) extended its record-breaking run with an additional +3.63% gain, supported by a second major analyst price-target raise — Barclays lifted its target 74% to $1,175, adding to Monday’s UBS $1,625 Street-high. ARM Holdings and broader AI hardware names also declined modestly. The Nasdaq Composite dipped -0.09% on the net sector drag. The PHLX Semiconductor Index had mixed performance with memory outperforming and non-memory underperforming.
Why it matters:The QCOM/MU bifurcation is a sector rotation signal with duration implications. Three considerations: (1) QCOM’s 30% single-week gain was driven by a single deal announcement — the ByteDance AI chip contract — which, while meaningful, does not justify a 30% permanent upward re-rating of the entire company without sustained revenue confirmation. The 6.18% pullback begins the rationalization phase, and the full mean-reversion to pre-announcement levels may not be complete; (2) The continued MU upgrade cycle (now two major price target raises in two sessions from separate banks) reinforces that the AI memory thesis is institutionally validated and not simply momentum-driven; (3) For sector allocators, the divergence signals a preference for companies with contracted, structural AI revenue streams (MU via HBM LTAs) over companies with deal-specific or mobile-AI execution risk (QCOM). This rotation within semiconductors is likely to persist until QCOM’s next earnings report provides revenue confirmation of the ByteDance deal’s financial magnitude.
What to watch:QCOM’s next earnings for ByteDance revenue contribution and any disclosure of additional AI chip partnerships; MU share price relative to the $1,625 UBS and $1,175 Barclays targets for whether institutional consensus is converging or diverging on valuation; Barclays’ additional upgrade commentary for whether further banks follow with comparable AI memory thesis upgrades.
BULLISH
7. Nvidia Commits $150 Billion/Year in Taiwan — Breaks Ground on “Constellation” Taipei HQ Campus; Taiwan Chip Stocks Rally
The core facts:Nvidia CEO Jensen Huang announced Wednesday that the company plans to invest approximately $150 billion annually in Taiwan, calling the island the “epicentre of the AI revolution.” Current Taiwan spending is approximately $100 billion per year, with the increase reflecting accelerating AI hardware procurement from TSMC, CoWoS advanced packaging, and related supply-chain partners. Simultaneously, Huang unveiled the design for Nvidia’s new Taiwan headquarters, “Constellation,” to be built in the Beitou-Shilin Technology Park in northern Taipei. The campus will house 4,000 employees when it opens in approximately 2030. Taiwan semiconductor stocks rallied on the announcement: TSMC’s ADR and related names gained in sympathy. Huang did not specify a timeframe for how many years the $150 billion annual commitment would be sustained.
Why it matters:The $150 billion/year figure is the largest publicly-disclosed single-company manufacturing commitment to a geographic region in semiconductor history. Three implications: (1) The announcement materially validates the Taiwan semiconductor ecosystem as the irreplaceable center of AI hardware production — TSMC’s leading-edge node capacity, CoWoS stacked-die packaging, and advanced DRAM integration are all required for Nvidia’s H-series and future GB-series GPUs. This commitment reduces the probability of any meaningful Nvidia supply-chain diversification away from Taiwan in the near term; (2) For geopolitical risk analysis, Nvidia’s deepening Taiwan dependency is a double-edged signal — it raises the economic cost to the US of any Taiwan Strait conflict scenario, potentially reinforcing US strategic commitment to Taiwan’s security, while simultaneously concentrating AI infrastructure risk in a single geopolitical flashpoint; (3) The $150B/year figure exceeds the entire annual revenue of most semiconductor companies and implicitly validates TSMC’s pricing power and capacity expansion roadmap through the late 2020s.
What to watch:TSMC’s next quarterly call for whether $150B in Nvidia commitments is translating into confirmed capacity expansion at leading-edge nodes; any US government response to the level of AI infrastructure concentration in Taiwan; whether other hyperscalers (Amazon, Google, Microsoft) announce comparable Taiwan investment scaling to maintain competitive parity.
BULLISH
8. Snowflake Surges +34% — Q1 FY2027 Revenue +34% YoY Marks Strongest Sequential Dollar Growth in History; $6 Billion AWS Infrastructure Deal Announced
The core facts:Snowflake (SNOW) surged approximately 34% on Wednesday after reporting Q1 FY2027 earnings: product revenue of $1.33 billion, +34% year-over-year, marking what CEO Sridhar Ramaswamy described as “the strongest sequential dollar growth in our history.” Simultaneously, Snowflake announced a $6 billion multi-year infrastructure partnership with Amazon Web Services, committing to expand its use of AWS’s Graviton general-purpose processors and cloud-based GPU architectures to accelerate enterprise AI workloads. The $6 billion is structured as a five-year purchase commitment. The Natoma and related acquisitions were also disclosed as part of the quarterly announcement. SNOW’s prior quarter had shown decelerating growth, making the +34% acceleration and record sequential dollar growth a significant positive revision to the growth trajectory narrative.
Why it matters:Snowflake’s result is a positive read-through for enterprise AI software adoption and cloud infrastructure spending in Q1 2026. Three implications: (1) The $6B AWS commitment is strategically significant — it deepens the Snowflake/AWS ecosystem lock-in and validates AWS Graviton as a competitive alternative to GPU-heavy workloads for certain data warehouse and analytical AI applications; Amazon’s relationship with Snowflake (which also competes with Amazon’s own Redshift product) suggests the cloud economics of hosting outweigh the competitive tension; (2) SNOW’s reversal from deceleration to “strongest sequential growth in history” confirms that enterprise AI investment is accelerating in the database-and-analytics layer, not just at the LLM/model layer. Data infrastructure companies (Databricks, MongoDB, Confluent) face renewed re-rating pressure as the Snowflake result demonstrates the AI demand cycle has reached the enterprise data pipeline; (3) The 34% single-session gain is also a technical sentiment signal — SNOW was under significant valuation and growth-deceleration pressure entering the quarter. The magnitude of today’s move suggests short-covering and renewed institutional accumulation, which may sustain the stock at a structurally higher price level for the near term.
What to watch:Snowflake’s Q2 FY2027 revenue guidance for whether the acceleration was a one-quarter catch-up or a durable trend resumption; AWS Graviton adoption metrics for any disclosure on enterprise cost efficiency vs. GPU alternatives; peer data infrastructure names (Databricks private, MongoDB, Confluent) for whether they confirm the same acceleration in enterprise AI-driven data consumption.
BEARISH
9. PDD Holdings (Temu) -10.38% on -41.59% EPS Miss — Massive Revenue Shortfall Raises Global Consumer Demand Flag
The core facts:PDD Holdings (PDD) — parent company of both Pinduoduo (China) and Temu (US/global) — fell -10.38% on Wednesday after reporting BMO Q1 2026 results that showed a -41.59% EPS negative surprise against consensus estimates. Revenue came in at $15.65 billion versus the $16.10 billion estimate, a -2.78% revenue miss. EPS actual of $1.40 versus the $2.40 estimate. PDD’s market cap is approximately $123 billion, making this among the largest single-session drawdowns by dollar amount for a large-cap global e-commerce name in 2026. PDD is an ADR and is excluded from Section F; results are covered here for their US market transmission signal.
Why it matters:PDD’s dual-market footprint — Pinduoduo in China and Temu in the US, Europe, and Southeast Asia — makes its revenue miss a cross-border consumer signal. Three implications: (1) The magnitude of the EPS miss (-41.59%) is too large to attribute to routine operational variance — it signals either demand deceleration in Temu’s US expansion (plausibly due to tariff-driven price increases on Chinese-manufactured goods), weaker-than-expected Chinese domestic consumer sentiment in Pinduoduo, or both. Either reading is negative for global consumer discretionary; (2) For US-listed Amazon, the Temu miss could be interpreted as a mild positive — reduced cross-border competition from Chinese discount imports if Temu is losing pricing advantage under tariff pressure. Conversely, if US consumer spending is broadly contracting, Amazon’s own demand environment is under pressure from the same forces; (3) The scale of the miss adds to the accumulating evidence of consumer stress globally (Conference Board two-thirds cutting spending; UMich record-low sentiment; Case-Shiller negative real returns), suggesting the spending pullback is more widespread than any single indicator captures.
What to watch:PDD’s earnings call commentary on Temu US revenue performance under tariff-imposed price pressures; Amazon Q2 GMV data for cross-referencing Temu’s US consumer demand signal; June US retail sales data for hard confirmation that the consumer spending pullback is translating to register-level numbers.
BULLISH
10. Richmond Fed Manufacturing Surges — Composite +13 vs. +4 Expected, Shipments Jump from -2 to +16; Industrials Sector Signal
The core facts:The Richmond Federal Reserve Manufacturing Survey for May 2026 printed a composite reading of +13, sharply exceeding the +4 consensus estimate. The shipments sub-index surged from -2 in April to +16 — the largest single-month shipments rebound in the Richmond district since the post-pandemic restock surge. New orders and employment components were also positive. Prices paid moderated compared to April, with firms reporting some easing in input cost pressure — a notable contrast to the Dallas Fed’s same-period surge in raw materials prices to an 8-month high. The Richmond district covers key manufacturing states including Virginia, Maryland, North Carolina, South Carolina, West Virginia, and Washington DC.
Why it matters:The Richmond result is the first major regional manufacturing surprise to the upside since the Dallas Fed’s stagflation reading on May 26. The contrast between the two districts — Richmond surging while Dallas showed capacity utilization collapse — suggests regional heterogeneity in manufacturing conditions that must be interpreted carefully. Three considerations: (1) The most positive interpretation: the Richmond shipments surge reflects genuine demand-side recovery in the District’s manufacturing base — possibly tariff front-running as companies place orders before expected further tariff escalation, or genuine demand normalization. If the former, it is a temporary pull-forward that will depress future readings; if the latter, it provides some positive offset to the overall stagflation narrative; (2) The moderation in Richmond prices paid, contrasting with Dallas’s 8-month high, may reflect geographic exposure differences — Richmond’s manufacturing base includes more service-adjacent and technology-adjacent manufacturing, while Dallas’s is more energy-intensive; (3) For industrials sector allocation, the Richmond data provides a counter-narrative to the Beige Book’s wait-and-see caution — at least one major district’s manufacturers are shipping, not waiting.
What to watch:June 2 ISM Manufacturing PMI for national confirmation of whether Richmond’s surge is a regional outlier or a leading signal for the broader manufacturing economy; Richmond’s June reading for durability of the shipments recovery; inventory data alongside future Richmond orders for whether the April-to-May surge reflects genuine demand or tariff-motivated front-running.
BEARISH
11. Mortgage Rates Hit 6.65% — 9-Month High; MBA Applications Fall -8.5%, Refinancing Crashes -18.1% for Fifth Consecutive Weekly Rate Rise
The core facts:The Mortgage Bankers Association reported Wednesday (data for week ending May 22) that the 30-year fixed mortgage rate rose to 6.65% — a 9-month high, and the fifth consecutive weekly rate increase. MBA total mortgage applications fell -8.5% week-over-week. Refinancing applications collapsed -18.1% on the week. The context: this rate reading compounds last week’s Case-Shiller data showing 10 consecutive months of negative real home price returns, with more than half of major US metro areas now declining in nominal prices year-over-year. The rate increase is driven by elevated Treasury yields persisting under the Fed’s hawkish posture and inflation expectations from energy prices.
Why it matters:The housing sector is the most rate-sensitive major segment of the US economy, and five consecutive weeks of mortgage rate increases without any offsetting demand improvement signal structural affordability deterioration. Three implications: (1) The -18.1% refinancing collapse removes a key consumer liquidity mechanism — refinancing allows homeowners to extract equity or reduce monthly payments. At 6.65%, virtually no existing mortgage holder has refinancing economics that work, eliminating this cash-flow channel for consumer spending; (2) Homebuilders face compounding pressure: purchase applications declining -8.5% overall (with purchase-specific applications even weaker as the spring selling season should be peak demand) signals order book deterioration ahead of Q2 earnings reports in July. Homebuilder stocks have been pricing affordability improvement that is not materializing; (3) For the Fed’s rate decision calculus, rising mortgage rates and housing deterioration provide the “cyclical weakness” argument for patience — but with PCE at 3.8%, the FOMC cannot act on housing softness without first addressing inflation. Housing is caught in the stagflation trap with no near-term relief valve.
What to watch:Next MBA application data (week of May 27, released June 4) for whether the fifth consecutive decline extends to a sixth; homebuilder Q2 earnings in July for explicit guidance on order cancellation rates and incentive packages; Fed commentary on housing as a cyclical offset to inflation persistence in June FOMC communications.
UNCERTAIN
12. Mega-Data Thursday Preview — Q1 GDP 2nd Estimate, April PCE, Durable Goods, Personal Income: All Released May 28; Positioning Risk Is Elevated
The core facts:Thursday May 28 is the most data-dense scheduled release day of the 2026 calendar to date. In a single morning: Q1 2026 GDP Second Estimate (BEA; Q1 advance was 0.5%, consensus for 2nd estimate is 2.0% — representing a major upward revision possibility); April PCE Deflator (BEA; consensus 3.8% headline, 3.3% core — both would be the highest readings since 2023); April Durable Goods Orders (Census; consensus +3.5%); April Personal Income and Spending; and Weekly Jobless Claims (consensus ~230K). The divergence between the Q1 GDP advance (0.5%) and the 2nd estimate consensus (2.0%) would represent one of the largest single-report upward revisions in recent memory if confirmed — driven primarily by trade balance revisions and inventory adjustments.
Why it matters:The simultaneous release of potentially conflicting GDP (strong economy) and PCE (high inflation) creates an UNCERTAIN positioning environment ahead of Thursday’s open. Three scenarios: (1) GDP upward revision confirms economy held up in Q1 despite tariff/conflict headwinds AND PCE confirms 3.8% inflation → stagflation signal confirmed, rate-hike probability increases significantly. For equities, this is the worst-case combination: growth may have been front-loaded into Q1 before tariff impact, while inflation persistence now forces a hawkish Fed response; (2) GDP comes in below the 2.0% consensus (i.e., advance 0.5% is more accurate) AND PCE is in line → recessionary-with-inflation signal. Stagflation most severe form — growth contracting while prices rise; (3) GDP strong + PCE slightly below 3.8% → best-case: economy growing with some inflation easing. Would likely produce a significant equity rally and 10-year yield relief. Scenario (1) is the street consensus; scenario (3) would be the biggest surprise. The UNCERTAIN badge reflects the genuine bidirectionality of the data outcome.
What to watch:April PCE deflator headline vs. 3.8% consensus — this is Thursday’s single most market-moving print given Cook’s “prepared to raise rates” statement today; Q1 GDP 2nd estimate vs. 2.0% revision consensus — a downward surprise below 1.0% would significantly change the stagflation narrative; Personal Spending growth rate for consumption momentum heading into Q2.
BEARISH
13. GE Vernova -3.60% — AI Data Center Capex Premium Hits Valuation Ceiling After +124% 12-Month Run; Analyst Caution Mounts
The core facts:GE Vernova (GEV) fell -3.60% on Wednesday after surging +5.31% on Tuesday and gaining approximately +124% over the trailing 12 months. No new negative catalyst emerged Wednesday; the decline represents profit-taking following parabolic performance and growing analyst commentary that the AI data center-driven power infrastructure premium may be approaching near-term valuation saturation at current prices (~$1,030/share). GEV’s valuation is primarily supported by the AI infrastructure buildout narrative — hyperscalers and data center operators require substantially increased electrical grid capacity and power generation, with GE Vernova as a key turbine and grid technology supplier.
Why it matters:GEV’s pullback illustrates the valuation tension embedded in all AI-infrastructure adjacent names after extended rallies. Three considerations: (1) Power infrastructure names (GEV, Eaton, Quanta Services, Vistra) have been priced as growth compounders on AI capex expectations that are multi-year in nature — single-quarter execution must now increasingly justify the multiple, as the “AI theme” alone no longer provides the re-rating catalyst it did in 2024–2025; (2) The -3.60% after +5.31% pattern creates a technical overhead — investors who bought the Tuesday spike are now offside, creating potential for continued near-term selling pressure as they seek exits. This pattern (one-session parabolic followed by reversal) has historically indicated a short-term peak in momentum-driven names; (3) For sector analysts, the GEV pause is an important signal that the power infrastructure sub-theme within AI — while fundamentally intact — may be entering a consolidation phase. New catalysts (e.g., specific large data center supply contracts, grid interconnection approvals) would be needed to re-accelerate the run.
What to watch:GEV’s next earnings call for Q2 order intake, backlog growth, and any new hyperscaler supply agreements; data center power demand announcements from major hyperscalers for contract-level validation of GEV’s revenue pipeline; GEV share price behavior around $950–$1,000 — a hold above this range would confirm consolidation; a break below would signal a more significant mean-reversion.
— Separating signal from noise since 2007. Apply for membership at join.recessionalert.comE. ECONOMY WATCH -> TOP
Hard and soft US economic data continued to diverge sharply in May: manufacturing surged back while credit-sensitive sectors stalled. Richmond Fed’s composite index registered its sharpest advance in a year, yet mortgage demand fell to a two-month low as 30-year rates hit their highest level since August 2025. Three Fed officials addressed the markets today; the common thread was a live two-way policy risk — Cook signaled rate-hike readiness if disinflation does not materialise, while Logan delivered a structurally bearish oil assessment, warning that US production cannot fill the 13-million-bpd Hormuz gap. Thursday brings the key data: Q1 GDP second estimate, April PCE (expected 3.8% headline), and jobless claims — with Warsh chairing his first FOMC in June.
Richmond Fed Manufacturing Surges to +13 in May, Shipments Explode from -2 to +16 (Richmond Fed, May 27, 2026)
What they’re saying:The Richmond Fed’s composite manufacturing index jumped to +13 in May — up from +3 in April and well above the +4 consensus — marking its strongest reading in nearly a year. The shipments index surged from -2 to +16, new orders rose from +8 to +17, and the employment index turned positive (+3 from 0). Forward-looking indicators improved sharply, with future business conditions rising to +17 from +3 and future employment expectations hitting +23 from +7. Prices paid and received both eased somewhat in May.
The context:The breadth of improvement — across shipments, orders, employment, and future expectations simultaneously — suggests either tariff-related front-running in goods ordering is accelerating, or genuine demand recovery is underway. The easing in prices paid is the most critical component: if manufacturers are absorbing less cost pressure while volumes expand, it directly reduces the probability of another inflationary leg from the goods sector. Today’s reading follows Dallas Fed manufacturing’s return to positive territory in April (+0.4), building a case that the US industrial base is stabilising after seven months of contraction.
What to watch:Chicago PMI (Friday May 29, expected 49.7) — if it moves into expansion territory alongside Richmond, the manufacturing re-acceleration narrative gains significant credibility heading into June’s ISM releases.
Dallas Fed’s Logan Warns US Oil Production Cannot Fill 13-Million-Bpd Hormuz Supply Gap (Dallas Fed / BOJ Conference, May 27, 2026)
What they’re saying:Dallas Fed President Lorie Logan, speaking in Tokyo at the Bank of Japan’s Institute for Monetary and Economic Studies Conference, warned that US oil production is structurally incapable of filling the global supply void created by the Strait of Hormuz closure. The war has removed approximately 13 million barrels per day — more than 10% of global supply. Dallas Fed surveys show US producers expect output gains of at most 250,000 bpd by end 2026 and 500,000 bpd in 2027. Logan warned: “world oil and natural gas consumption could need to fall more meaningfully than it has so far.” She also called for the Fed to centrally clear its own Treasury securities trading to bolster market resilience.
The context:Logan’s assessment structurally undermines the “transitory energy shock” narrative that Treasury Secretary Bessent and others have promoted. Capital constraints, labour shortages, and Permian Basin infrastructure limits mean US shale cannot scale fast enough to offset Iranian supply — extending the period during which elevated energy costs translate into generalised inflation. For the Fed, Logan’s warning means the oil-driven component of inflation is not a near-term mean-reverting event but a sustained headwind, reducing the probability of disinflation materialising on the timetable Cook and others have outlined. Logan’s Treasury clearing remarks signal she is aligned with Warsh’s balance sheet reform agenda.
What to watch:EIA Crude Oil Stocks Change (Thursday May 28); any Strait of Hormuz diplomatic developments; Permian Basin rig count trajectory as the clearest real-time proxy for US production capacity response.
Fed’s Cook Signals Rate-Hike Readiness as PCE Nears 4-Year High; AI Job-Displacement Risk Flagged (Federal Reserve / Stanford, May 27, 2026)
What they’re saying:Federal Reserve Governor Lisa Cook, speaking at Stanford’s SIEPR, said holding rates steady remains the right course but escalated her language: “I am prepared to raise rates, if the expected disinflation does not appear in a timely manner.” Cook cited PCE inflation running at 3.8% for the 12 months ending in April — well above the 2% target — and core PCE at 3.3%, its highest reading since 2023. Unemployment held at 4.3% in April, aligned with natural rate estimates. She characterised risks as “tilted toward higher inflation” while noting Iran and tariff shocks are expected to be temporary. Separately, Cook flagged AI-driven job displacement as an “elevated downside risk” to the labour market.
The context:Cook’s explicit rate-hike conditioning — moving beyond “holding” to naming the trigger — represents the clearest FOMC signal yet that the next policy move is live in both directions. With core PCE at its highest level since 2023 and five consecutive years of above-target inflation, the Fed’s credibility window for patience is narrowing. The AI labour-displacement flag is unusual for a monetary policy speech and hints that the Fed is modelling a scenario where disinflation arrives not through demand destruction but through productivity-driven supply expansion — which would give Warsh the cover to avoid rate hikes even with elevated PCE.
What to watch:April PCE (Thursday May 28, 8:30 AM ET — expected 3.8% headline / 3.3% core / 0.5% MoM). A miss above the 3.3% core threshold would significantly increase pressure for FOMC action at the June 16-17 meeting, Warsh’s first as chair.
Mortgage Applications Plunge 8.5% as 30-Year Rate Hits 9-Month High of 6.65% (MBA, May 27, 2026)
What they’re saying:Mortgage applications fell 8.5% for the week ending May 22, the sharpest weekly decline in nearly two months. The average 30-year fixed mortgage rate rose to 6.65% — its highest level since August 2025 — from 6.56% the prior week, marking the fifth consecutive weekly rate increase. Refinance applications collapsed 18.1% while purchase applications declined a more modest 0.4%. Rates have tracked persistently higher Treasury yields driven by ongoing inflation concerns from elevated energy costs and rising global public debt issuance.
The context:The housing market is absorbing a double squeeze: rates rising (6.65% is 200 bps above the long-run average) while home prices remain elevated after years of appreciation, compressing affordability to near-decade lows. Refinance activity’s near-collapse removes a key source of consumer liquidity that supported spending through 2022-2024. The sequential transmission — rates rising → mortgage demand falling → housing transactions slowing → home price deceleration → reduced wealth effect — is precisely the channel through which restrictive monetary policy eventually cools consumer spending. Thursday’s April New Home Sales (expected 670K) will confirm whether the trend is accelerating.
What to watch:April New Home Sales (Thursday May 28, expected 670K); weekly MBA survey for week ending May 29 — a third consecutive 30-year rate print above 6.65% would signal a sustained affordability crisis, not a transient spike.
Dallas Fed Texas Services Activity Edges to -7.7 in May — Seventh Consecutive Month of Contraction (Dallas Fed, May 27, 2026)
What they’re saying:The Dallas Fed’s Texas Service Sector Outlook Survey showed the general business activity index at -7.7 in May, improving modestly from -9.9 in April but remaining in contraction for the seventh consecutive month. The services revenues index turned marginally more positive at +5.0 from +4.3. The result contrasts with the separate Dallas Fed Texas manufacturing survey released Tuesday, which turned positive (+0.4) for the first time in four months.
The context:The Texas services sector — spanning finance, retail, professional services, and healthcare — accounts for roughly two-thirds of state output and historically tracks national services trends by 4-6 weeks. Persistent contraction in services activity alongside a manufacturing recovery reflects the classic tariff-era goods/services split: manufacturers benefit from front-running inventory builds and nearshoring demand while services businesses face consumer fatigue from elevated fuel and food costs. The positive revenues index alongside a still-negative activity reading suggests pricing power is holding even as transaction volumes are flat — consistent with stubborn core services inflation that gives the Fed little room to ease.
What to watch:Chicago PMI (Friday May 29, expected 49.7) and ISM Services (early June) for a national read on whether the Texas services contraction is regionally confined or a leading indicator of broader softening.
— Know the probability before the market prices in the risk. Apply for membership at join.recessionalert.comF. EARNINGS WATCH -> TOP
YESTERDAY AFTER THE BELL (Markets Reacted Today)
No major earnings yesterday after the bell from companies with >$100B market cap.
TODAY BEFORE THE BELL (Markets Already Reacted)
No major earnings before the bell from companies with >$100B US-domiciled market cap. Note: PDD Holdings ($123B, ADR) and Bank of Montreal ($115B, Canadian bank) reported BMO but are excluded per the ADR/foreign-domicile filter. PDD’s -41.59% EPS miss and -10.38% stock decline are covered as a US market signal in Section D (Story 9).
TODAY AFTER THE BELL (Markets React Tomorrow)
UNCERTAIN
14. Marvell Technology (MRVL): AH: pending | Q1 FY2027 — AI Custom XPU Execution Must Justify Tuesday’s +10% Sympathy Surge
The Numbers:Reports AMC tonight. Consensus: $0.80 non-GAAP EPS | $2.41B revenue (Q1 FY2027). Marvell surged +10% on Tuesday (May 26) in AI sympathy following Micron’s UBS upgrade. Market cap: $173.97B. Released: AMC May 27, 2026.
The Problem/Win:Tuesday’s pre-earnings +10% surge has materially elevated the bar. The report must confirm: (1) NVLink Fusion partnership execution and revenue contribution timeline; (2) 800G/1.6T optical interconnect ramp — volume inflection or delay; (3) New or expanded hyperscaler custom XPU program disclosures, particularly any new AI ASIC design-win announcements beyond the known Google TPU lineage. Any guidance miss or cautious commentary on custom program timelines would trigger rapid retracement of Tuesday’s move.
The Ripple:MRVL’s result is the first real-time validation of whether the AI custom silicon thesis — distinct from Micron’s memory thesis — is commercially confirmed. A beat-and-raise would extend the SOX rally and potentially re-rate the entire AI application-specific ASIC sub-sector (Broadcom, Cadence, Synopsys). A miss would expose the gap between sympathy-driven pre-earnings positioning and fundamental reality.
What It Means:MRVL is the cleanest test of whether the AI custom XPU narrative has substance behind the sympathy rally. Markets react Thursday morning — a confirming report would broaden the semiconductor AI rally from memory into application silicon; a miss would narrow the AI trade back to pure-memory and model-training names.
What to watch:Q2 FY2027 revenue guidance vs. $2.53B consensus estimate; any new hyperscaler XPU engagement announcement on the call; after-hours price reaction as a real-time verdict on whether Tuesday’s 10% pre-earnings move was justified.
UNCERTAIN
15. Salesforce (CRM): AH: pending | Q1 FY2027 — Agentforce AI Platform Adoption vs. Macro Enterprise Software Demand
The Numbers:Reports AMC tonight. Consensus: $3.13 non-GAAP EPS | $11.05B revenue (Q1 FY2027). Market cap: $145.21B. Released: AMC May 27, 2026.
The Problem/Win:Salesforce’s report centers on two questions: (1) Agentforce AI platform adoption rate — the number of paid enterprise seats and revenue contribution is the single most-watched metric, as management has made aggressive claims about agent-driven monetization that must now be validated with reported numbers; (2) Q2 FY2027 revenue guidance — with enterprise software spend under macro pressure from the Beige Book’s “wait-and-see” corporate posture and Brent-driven cost inflation, CRM’s forward guidance will signal whether enterprise software demand is holding or beginning to compress. The high-stakes nature of the AI platform narrative means any Agentforce adoption miss is likely to be treated more severely than a simple revenue beat/miss.
The Ripple:CRM is the bellwether for enterprise software AI monetization. A strong Agentforce adoption number would re-rate the enterprise software sector broadly (ServiceNow, Workday, SAP, Oracle) as confirmation that AI agents are converting from pilots to paid deployments. A disappointment would dampen the entire AI software monetization narrative that has supported sector multiples through H1 2026.
What It Means:Salesforce is the highest-stakes AI monetization proof-point of the current earnings cycle. Unlike hardware (NVDA, MU) where AI spend is confirmed by capex flows, software AI monetization depends on enterprise willingness to pay — a signal that is much more sensitive to macro slowdown and corporate budget pressure.
What to watch:Agentforce paid seat count and any revenue attribution disclosed on the call; Q2 FY2027 revenue guidance vs. ~$11.3B street consensus; remaining performance obligations (RPO) growth for forward contract pipeline strength.
UNCERTAIN
16. Synopsys (SNPS): AH: pending | Q2 FY2026 — Ansys Integration Progress and EDA Demand the Critical Focus
The Numbers:Reports AMC tonight. Consensus: $3.15 non-GAAP EPS | $2.25B revenue (Q2 FY2026). FY2026 guidance: $9.61B (confirmation expected). Market cap: $100.32B — smallest qualifying earner by just $320M above the $100B threshold. Released: AMC May 27, 2026.
The Problem/Win:Synopsys completed the Ansys acquisition in early 2026, and the first earnings reports showing integration progress are critical for validating the deal’s strategic rationale. Key focus: EDA (electronic design automation) tool license demand from semiconductor designers — SNPS is the upstream software that chip designers use before fabrication, making it a leading indicator for future semiconductor R&D investment. AI chip design complexity is driving secular demand growth for EDA tools.
The Ripple:SNPS tracks semiconductor design activity rather than production — strong EDA demand confirms that the AI chip design pipeline remains active and that next-generation custom silicon development is not slowing despite current macro uncertainty. Read-through to Cadence Design Systems (CDNS) as SNPS’s primary competitor.
What It Means:Synopsys at ~$100B market cap is the smallest company in tonight’s AMC lineup, but its EDA position makes it a canary for the AI chip design pipeline — confirmation of demand here validates that hyperscaler custom AI chip programs are accelerating, not plateauing.
What to watch:FY2026 guidance confirmation vs. $9.61B consensus; Ansys revenue contribution and integration timeline; any disclosure on design starts in AI ASIC programs as a forward semiconductor pipeline signal.
WEEK AHEAD PREVIEW:
Q1 2026 earnings season is functionally complete (~92% of S&P 500 reported; blended +27.7% YoY EPS growth — the strongest since Q4 2021). The remaining notable reporters are clustered in late May, after which Q2 2026 reporting begins in mid-July.
Costco Wholesale (COST) — AMC Thursday, May 28 — Q3 FY2026 (fiscal year ending August); consensus $4.98 EPS, $69.61B revenue (+10% YoY). Key focus: same-warehouse sales growth trajectory and whether April’s strong +13% net sales carry into the quarter; membership renewal rate (tracking above 89%); any pricing commentary on inflation pass-through given gasoline and food cost pressures; international expansion update. Options market implying ~3.65% post-earnings move. Costco is a high-quality consumer bellwether — its results will provide the most direct read on whether oil-price relief and discretionary spending are intersecting with high-income consumer resilience.
Dell Technologies (DELL) — AMC Thursday, May 28 — Q1 FY2027; consensus $3.00 EPS, $34.95B revenue. Key focus: AI server revenue run rate (guided ~$13B for Q1) and whether the $43B AI server backlog is converting to revenue at expected pace; Infrastructure Solutions Group margin performance under component cost pressures; PC segment demand amid enterprise budget caution; and management commentary on AI server margin sustainability as competitive pricing pressure from hyperscaler direct-build alternatives intensifies. DELL is up ~140% year-to-date — the stock is priced for execution perfection on its AI infrastructure pivot.
Q2 2026 earnings season begins mid-July.
— US market commentary trusted by family offices and institutions. Apply for membership at join.recessionalert.comG. WHAT’S NEXT -> TOP
UPCOMING RELEASES:
| Date | Event | Why It Matters |
|---|---|---|
| Thu, May 28 | Q1 GDP 2nd Estimate (exp. 2.0% vs. 0.5% advance) | One of the largest advance-to-second estimate revisions on record if confirmed; strong GDP + 3.8% PCE simultaneously cements the stagflation narrative and removes the Fed’s cover for patience at the June 16–17 meeting. |
| Thu, May 28 | April PCE Deflator — Headline YoY (exp. 3.8%), Core YoY (exp. 3.3%), MoM Headline (exp. 0.5%), MoM Core (exp. 0.3%); Personal Income (exp. +0.4%), Personal Spending (exp. +0.5%) | The single most market-moving print of the week; Cook explicitly named 3.8% headline as her inflation watch-point and said “I am prepared to raise rates” — a confirmed 3.8% or upside surprise accelerates June FOMC hawkish signaling; personal spending confirms whether consumer demand is holding despite the affordability squeeze. |
| Thu, May 28 | Durable Goods Orders Apr (exp. +3.5% vs. prior +0.8%) | A +3.5% print would be the strongest monthly durable goods reading since early 2025; cross-reference with Richmond’s shipments surge — confirms whether the manufacturing rebound is tariff front-running or genuine demand recovery. |
| Thu, May 28 | Initial Jobless Claims (exp. 211K); Continuing Claims (exp. 1,780K) | The Beige Book flagged universal wait-and-see hiring posture across all 12 districts; any claims deterioration above 225K would confirm the leading-edge of the hiring freeze is transmitting to layoffs ahead of June’s NFP. |
| Thu, May 28 | New Home Sales Apr (exp. 670K vs. prior 682K) | With mortgage rates at a 9-month high of 6.65% and MBA purchase apps declining, a print below 650K would confirm affordability destruction is now filtering into actual transaction volume — negative for homebuilder Q2 guidance in July. |
| Thu, May 28 | Fed Williams Speech | NY Fed President Williams is one of the most influential FOMC voices; his response to Cook’s “prepared to raise rates” language will signal whether the hike option has migrated from individual members into the committee’s centre of gravity. |
| Fri, May 29 | Chicago PMI May (exp. 49.7 vs. prior 49.2) | If Chicago moves into expansion territory alongside Richmond’s +13 surge, the manufacturing re-acceleration narrative gains significant credibility heading into June’s ISM releases — a meaningful offset to the Beige Book’s decline characterization. |
| Fri, May 29 | Goods Trade Balance Adv Apr (exp. −$87B vs. prior −$87.45B) | Trade balance feeds directly into Q1 GDP revisions; a sharper-than-expected deficit would indicate import front-running ahead of tariff escalation, which would inflate near-term activity measures while depressing subsequent quarters. |
| Fri, May 29 | Fed Bowman Speech; Fed Paulson Speech | Two additional FOMC voices post-Cook and post-PCE; watch for explicit endorsement or pushback on rate-hike language — if Bowman and Paulson echo Cook, the June meeting statement will almost certainly include tightening bias language. |
KEY QUESTIONS:
1. Does Thursday’s April PCE confirm 3.8% headline / 3.3% core — and does a confirmed print trigger Cook’s rate-hike language into explicit June FOMC committee guidance, or does any downside surprise give the majority cover to stand pat through summer?
2. Can WTI hold below $90 and today’s consumer/transport rotation sustain if the White House maintains the “complete fabrication” denial through the week — or does the Hormuz risk premium fully return, reversing the oil tailwind before it reaches retail gas prices?
3. Does the Q1 GDP 2nd estimate confirm the massive revision from 0.5% to 2.0%, and if GDP is strong while PCE prints at 3.8%, does the simultaneous data combination lock in the stagflation regime as the consensus market framework for the second half of 2026?
— US market commentary trusted by family offices and institutions. Apply for membership at join.recessionalert.comH. CHART OF THE DAY -> TOP
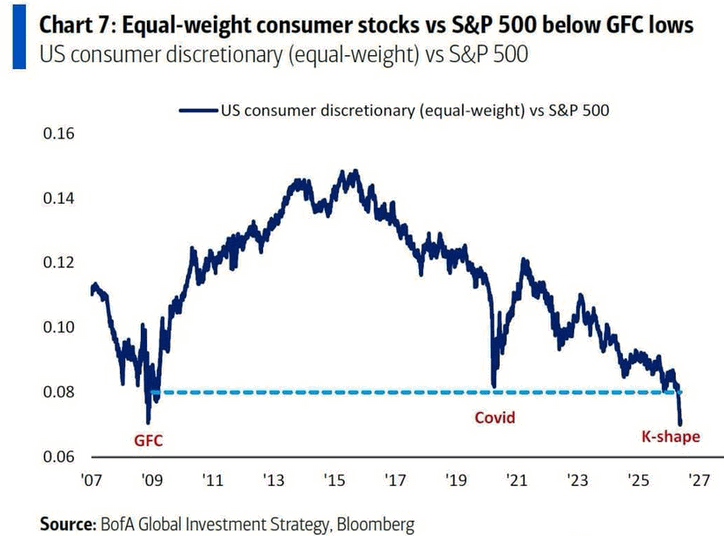
Below the 0.08 floor that held in 2009 and through the Covid wick — and still falling. Equal-weight US consumer discretionary versus the S&P 500 has decisively breached the level that marked the GFC trough, printing near 0.07 with the index at all-time highs and no recession on the tape. From the 2014/2015 peak near 0.15, eleven years of structural bleed just removed the last historical backstop. The mechanism is composition, not catastrophe. Cap-weighted XLY looks healthy because Amazon runs roughly 25-30% of the sleeve and Tesla rides close behind — both orthogonal to median-household consumption. Strip that mask and the apparel retailer, the casual-dining chain, the mid-tier auto name are priced for permanently impaired demand. GFC and Covid bounced from here; this print went through without pausing and is still pointed lower — an active leg, not mean-reversion setup. Two readings, both load-bearing. Equities are pricing median-household stress PCE and retail sales have yet to ratify; for those households, the read is already in. The K-shape just became a ticker. Falsification: weekly close back above 0.08.
Market Intelligence Brief (MIB) Ver. 18.37
For professional investors only. Not investment advice.
© 2026 RecessionALERT.com

Comments are closed.