
Dell’s AI server blowout — $43.8B revenue, AI revenue +757%, $51.3B backlog — drove DELL +32.8% and the Dow above 51,000 for the first time, with IBM +12.71% on quantum/CHIPS momentum. Chicago PMI surged to 62.7, a 37-month high — Monday’s ISM is the critical confirmation. Bowman and Schmid raised June FOMC hike risk; Schmid floated accelerated QT as a policy tool. Trump’s Iran meeting ended undecided; oil’s 17% monthly loss has a deal priced in — Monday open is binary.
TABLE OF CONTENTS
A. EXECUTIVE SUMMARY
B. MARKET DATA
C. HIGH-IMPACT STORIES (5)
D. MODERATE-IMPACT STORIES (6)
E. ECONOMY WATCH (5)
F. EARNINGS WATCH (2)
G. WHAT’S NEXT
H. CHART OF THE DAY
A. EXECUTIVE SUMMARY -> TOP
Dell Technologies’ record AI server quarter — $43.8B revenue, 757% server growth, a $51.3B backlog — drove the Dow above 51,000 for the first time and delivered the S&P 500’s ninth consecutive weekly gain, but the advance was structurally narrow: 8 of 11 sectors declined, the NYSE Composite finished negative, and the Russell 2000 fell -0.53%. The macro backdrop complicates the bullish read: Chicago PMI surged to 62.7 (a 37-month high reinforcing the growth narrative), while four Fed officials this week escalated June FOMC rate-hike risk — Bowman’s hawkish pivot and Schmid’s balance sheet tightening proposal shifting the committee from consensus hold to genuine debate. Bonds declined to confirm the rally (10Y barely -1.6 bps) and gold’s +1.34% advance alongside equities flags inflation persistence — sector rotation tells the story: Consumer Defensive -1.93%, Energy -0.89% sold as institutional capital concentrated into Technology (+1.71%), the sole advancing major sector.
• DELL +32.8% / IBM +12.71%: Dell’s $43.8B Q1 revenue (88% YoY), AI server revenue +757%, and $51.3B backlog drove the Dow to its first-ever 51,000 close; IBM’s $10B quantum commitment with $1B CHIPS Act backing added a second mega-cap catalyst and re-rated the quantum supply chain (IonQ, Rigetti)
• Chicago PMI 62.7 — 37-month high: The 13.5-point surge from 49.2 demolished the 50.5 consensus by 12.2 points — the largest single-month increase since 2020; Monday’s ISM Manufacturing PMI (exp. 52.6) is now the critical national confirmation test
• Four hawkish Fed voices escalate June FOMC risk: Bowman signaled a potential rate-hike pivot if Iran inflation effects persist; Schmid called inflation “too hot for five years” and raised accelerated balance sheet tightening as a policy tool — markets still price a June hold but the debate has materially shifted
• Iran binary looms over the weekend: Trump’s Situation Room “final determination” meeting ended without a decision; WTI -1.73%/$87.36, Brent posted its largest monthly loss in six years as markets front-ran a deal — an Iran deal collapse would reverse the monthly crude decline in days
• COST -3.91% on sell-on-earnings; auto content mandate adds tariff layer: Costco’s gross margin compressed 21 bps despite EPS beat at P/E 49; separately, the White House’s 82% North American/50% US auto content mandate elevates tariff exposure on foreign automakers and Mexican/Canadian parts suppliers
• OpenAI IPO at $852B — largest in history taking shape: Citi and JPMorgan join Goldman and Morgan Stanley in the underwriting syndicate; September 2026 target at ~$1T valuation creates near-term rotation pressure on current AI mega-cap positions (MSFT, GOOGL, AMZN)
1. AI Infrastructure Super-Cycle Achieves Institutional Legitimacy — Dell’s $51.3B backlog and 5,000+ enterprise customers spanning neocloud, sovereign, and corporate buyers transforms AI capex from hyperscaler optionality into a structural demand cycle. The 64% EPS beat at $43.8B scale means consensus models for every AI-adjacent peer are systematically too low. Investors benchmarked against cap-weighted indices face a growing AI infrastructure allocation problem heading into H2 2026.
2. Triple-Assumption Pricing Elevates Correction Risk — Friday’s record S&P close simultaneously priced: (1) Chicago PMI 62.7 growth acceleration, (2) an Iran deal driving oil toward PCE relief, and (3) no June Fed rate hike. Any single leg failing — Iran deal collapse, ISM disappointment Monday, or Bowman-Schmid language hardening into committee guidance — creates meaningful correction risk in a market that has not had a corrective week in nine consecutive gains.
3. Fed Hawks vs. Iran Peace Premium: Binary Portfolio Decision — Bowman’s hawkish pivot and Schmid’s QT proposal represent a tightening dimension the market has not priced. Yet the Iran energy channel runs in the opposite direction — WTI at $80/bbl post-deal reduces 2026 PCE materially and erodes the case for a rate hike. Next week’s portfolio decision is whether to hedge the Fed hawkish tail or lean into Iran-driven inflation relief.
 — Leading economic indicators. Accurate market forecasts. Apply for membership at join.recessionalert.com
B. MARKET DATA -> TOP
Today was Dell Technologies’ moment: a record $43.8B quarter with AI server revenue up 757% produced the stock’s best single-session gain (+32.8%) and lifted the Dow above 51,000 for the first time, even as 8 of 11 S&P 500 sectors declined. IBM’s +12.7% move on a $10B quantum computing commitment added a second catalyst; breadth, however, was unambiguous — the NYSE Composite slipped negative and the Russell 2000 fell -0.53%, exposing concentrated large-cap leadership rather than a market-wide rally. Gold’s +1.34% advance alongside US-Iran ceasefire optimism was the session’s anomaly: a safe-haven bid rising concurrent with equity strength signals that inflation risk, not just geopolitical relief, is the bond market’s lingering concern.
CLOSING PRICES – Friday, May 29, 2026:
MAJOR INDICES
Dow Theory bull confirmation is entrenched — ninth consecutive session with DJIA setting a new 10-session high at 51,032 and DJTA only 0.4% below its own 10-session high. The signal remains valid, but internals are fragmenting: S&P 500 managed only +0.22% while the NYSE Composite slipped negative, 8 of 11 sectors declining as the AI hardware trade concentrated gains into a handful of mega-caps. Russell 2000 -0.53% alongside DJ Transports +0.26% maintains Dow Theory confirmation without signaling broad cyclical participation — the bull signal is technically unimpeachable; its economic basis increasingly narrow.
| Index | Close | Change | %Move | Why It Moved |
|---|---|---|---|---|
| S&P 500 | 7,580.08 | +16.45 | +0.22% | Positive close driven entirely by Technology sector (+1.71%) weighting; 8 of 11 sectors declined; ninth consecutive weekly gain |
| Dow Jones | 51,032.65 | +363.68 | +0.72% | First-ever close above 51,000; DELL earnings surge, MSFT +3.47%, Goldman Sachs +1.13% among key contributors |
| DJ Transportation | 21,410.4 | +55.3 | +0.26% | Mild gain alongside risk-on sentiment; logistics tracking AI capex-driven demand narrative; Dow Theory confirmation maintained |
| Nasdaq 100 | 30,333.18 | +109.29 | +0.36% | AI capex narrative from DELL blowout and IBM quantum announcement; gains concentrated in AI-adjacent mega-caps |
| Russell 2000 | 2,920.93 | -15.64 | -0.53% | Small caps sold as institutional capital rotated into mega-cap AI names; confirms narrow breadth beneath the headline index |
| NYSE Composite | 23,292.17 | -10.09 | -0.04% | Broad composite slipped negative despite positive S&P 500; exposes that mega-cap tech weighting is carrying the headline indices alone |
VOLATILITY & TREASURIES
VIX eased to 15.32 (-2.67%) even as 10Y yields held at 4.44% — bond markets declining to join the equity rally is a quiet non-confirmation. The 2Y led the yield decline at -2.3 bps vs -1.6 bps for the 10Y, marginally steepening the curve and suggesting near-term rate-cut expectations nudged slightly higher. Dollar weakness (-0.10% DXY) traces to Iran ceasefire optimism rather than classic risk-on positioning — geopolitical character, not growth character.
| Instrument | Level | Change | Why It Moved |
|---|---|---|---|
| VIX | 15.32 | -0.42 (-2.67%) | Fear gauge eased on DELL AI earnings euphoria and Iran ceasefire optimism; options market pricing lower near-term equity risk |
| 10-Year Treasury Yield | 4.436% | -1.6 bps | Modest yield dip; bond market not confirming the equity rally — mild bid in Treasuries as inflation concerns offset ceasefire relief |
| 2-Year Treasury Yield | 4.002% | -2.3 bps | Short end fell more than long end; marginal curve steepening implies market nudged near-term rate-cut probability slightly higher |
| US Dollar Index (DXY) | 98.92 | -0.10 (-0.10%) | Dollar softened on US-Iran ceasefire extension narrative; geopolitical relief trade rather than classic risk-on dollar weakness |
COMMODITIES
Gold +1.34% to $4,593/oz while copper slipped -0.10% — precious leading industrial metals confirms this is a safe-haven/inflation hedge trade, not a growth impulse. Silver tracked gold (+0.34%); platinum flat. The driver: US-Iran ceasefire uncertainty plus persistent inflation expectations, a dual bid that tends to persist rather than revert. Bitcoin -0.23% declining alongside small caps — no independent store-of-value narrative today; risk proxy behavior intact.
| Asset | Price | Change | %Move | Why It Moved |
|---|---|---|---|---|
| Gold | $4,593.00/oz | +$60.60 | +1.34% | Dual bid: US-Iran ceasefire uncertainty preserving geopolitical premium and persistent inflation expectations driving inflation hedge demand |
| Silver | $76.173/oz | +$0.261 | +0.34% | Tracked gold’s safe-haven bid; industrial demand component kept gains modest relative to pure gold |
| Copper | $6.4195/lb | -$0.0065 | -0.10% | Marginal dip; industrial metals underperforming precious — growth demand signal slightly soft; confirms safe-haven rather than growth character |
| Platinum | $1,929.50/oz | +$2.20 | +0.11% | Negligible gain; automotive/industrial exposure muted the precious metals bid; lagged gold significantly |
| Bitcoin | $73,452.0 | -$169.0 | -0.23% | Mild decline alongside small caps and consumer defensives; tracking risk sentiment rather than acting as independent store of value |
ENERGY
WTI and Brent fell near-lockstep (-1.73%/-1.70%) with minimal spread widening — coordinated demand-side pull, not regional supply disruption. The primary driver is US-Iran ceasefire extension optimism removing a Middle East supply premium from crude. Natural gas sat out the decline (+0.15% Henry Hub, TTF flat), confirming this is a crude-specific geopolitical move, not a broad energy-inflation story. Oil lower on a tech-driven green equity day is growth-positive — cost relief without growth concern.
| Asset | Price | Change | %Move | Why It Moved |
|---|---|---|---|---|
| Crude Oil (WTI) | $87.36/bbl | -$1.54 | -1.73% | US-Iran ceasefire extension talks eased Middle East supply-disruption risk premium; global crude prices under coordinated pressure |
| Crude Oil (Brent) | $91.12/bbl | -$1.58 | -1.70% | Near-lockstep decline with WTI; minimal spread widening confirms global demand-side driver rather than regional supply disruption |
| Natural Gas (Henry Hub) | $3.290/MMBtu | +$0.005 | +0.15% | Domestic gas resilient; warm weather demand outlook supported; sat out crude oil’s ceasefire-driven decline entirely |
| Natural Gas (Dutch TTF) | $15.72/MMBtu | +$0.02 | +0.10% | European gas flat in €/MWh terms (0.00%); tiny USD gain entirely from EUR/USD appreciation (+0.10%); no independent European gas move |
S&P 500 SECTORS
Technology +1.71% extends dominant multi-month leadership (+15.14% 1M, +29.33% 3M) — the only sector keeping the S&P positive as 8 of 11 peers declined. The sharpest reversal: Energy was the YTD leader (+26.08% YTD) but has shed -5.08% this week and -5.55% this month, today’s -0.89% deepening the correction as ceasefire news removed crude’s risk premium. Consumer Defensive -1.93% confirms capital rotating firmly away from safe-haven sectors and into AI infrastructure.
| Sector | 1-Day | 1-Week | 1-Month | 3-Month | 6-Month | YTD | 12-Month |
|---|---|---|---|---|---|---|---|
| Technology | +1.71% | +5.27% | +15.14% | +29.33% | +27.32% | +25.38% | +54.24% |
| Financial | +0.37% | -0.37% | +0.97% | +1.03% | +2.39% | -2.42% | +10.43% |
| Basic Materials | +0.22% | +3.19% | +4.31% | -7.00% | +26.10% | +17.48% | +48.99% |
| Industrials | -0.54% | +2.26% | +3.22% | -0.09% | +17.92% | +15.11% | +27.74% |
| Utilities | -0.63% | -1.36% | -3.27% | -6.37% | +1.74% | +4.90% | +14.18% |
| Healthcare | -0.67% | +0.82% | +4.48% | -5.40% | -3.99% | -2.21% | +16.11% |
| Real Estate | -0.87% | -0.87% | +0.80% | -0.13% | +5.15% | +7.69% | +7.46% |
| Energy | -0.89% | -5.08% | -5.55% | +2.59% | +27.03% | +26.08% | +38.85% |
| Consumer Cyclical | -0.97% | +1.37% | +3.09% | +3.80% | +2.09% | +0.29% | +11.07% |
| Communication Services | -1.49% | 0.00% | +3.67% | +8.04% | +6.64% | +7.04% | +35.34% |
| Consumer Defensive | -1.93% | -3.23% | -1.61% | -8.39% | +5.79% | +5.68% | +2.54% |
TOP MEGA-CAP MOVERS:
GAINERS
| Company | Ticker | Close | Change | Why It Moved |
|---|---|---|---|---|
| Dell Technologies Inc | DELL | $420.91 | +32.76% | Record Q1 FY2027 results: revenue $43.8B (+88% YoY), AI server revenue +757% YoY, $24.4B in AI orders booked; EPS $4.86 vs $2.94 est.; best single-session gain in stock history |
| International Business Machines | IBM | $297.80 | +12.71% | $10B quantum computing commitment announced with US government CHIPS Act backing; ~$2B federal support package (grants + equity stake); $5B open-source security investment |
| Oracle Corp | ORCL | $225.78 | +10.84% | AI cloud infrastructure momentum; Oracle Cloud AI training demand accelerating on DELL sector read-through; AI capex cycle beneficiary |
| Palo Alto Networks Inc | PANW | $281.69 | +9.28% | Cybersecurity AI platform benefiting from IBM’s $5B open-source security commitment and enterprise AI infrastructure build cycle |
| Palantir Technologies Inc | PLTR | $156.54 | +9.21% | AI data analytics momentum; DELL’s blowout AI order backlog ($24.4B) validates AI infrastructure spending cycle benefiting PLTR’s enterprise contracts |
DECLINERS
| Company | Ticker | Close | Change | Why It Moved |
|---|---|---|---|---|
| Intel Corp | INTC | $114.68 | -5.14% | Reversed from +4% open; DELL’s AI server surge (757% YoY) runs on NVIDIA/AMD chips, bypassing Intel CPUs; insider selling after 492% prior-year rally amplified the reversal |
| Costco Wholesale Corp | COST | $956.32 | -3.91% | Q3 FY2026 earnings: slight EPS beat ($4.93 vs $4.91 est.) but gross margin contracted 21 bps to 12.8%; valuation concern at P/E 49 triggered sell-on-earnings reaction |
| Texas Instruments Inc | TXN | $305.68 | -3.25% | Analog/industrial chip maker absent from AI capex cycle; sector rotation out of traditional semiconductors and into AI-focused names accelerated by DELL results |
| GE Vernova Inc | GEV | $968.32 | -2.78% | Industrials sector weakness; power equipment/turbine maker underperformed as oil price decline removed energy infrastructure spending tailwind |
| Walmart Inc | WMT | $115.75 | -2.65% | Consumer defensive sector rotation as risk-on capital shifted toward tech; same sector headwind driving COST lower; defensive names broadly sold on AI infrastructure rotation day |
— Institutional-grade intelligence for serious investors. Apply for membership at join.recessionalert.comC. HIGH-IMPACT STORIES -> TOP
BULLISH
1. Chicago PMI Surges to 62.7 — 37-Month High, Demolished 50.5 Consensus by 12.2 Points; Manufacturing Rebound Signals Cyclical Re-Acceleration
The core facts:The MNI Chicago Business Barometer surged 13.5 points in May to 62.7 — the largest single-month increase since 2020 and the highest reading in 37 months. The prior reading was 49.2 (contraction territory); consensus stood at 50.5. The 12.2-point demolition of consensus represents one of the largest beat-to-estimate gaps in the indicator’s modern history. Released Friday, May 29, 2026, the reversal from April’s contraction is the sharpest one-month turnaround since pandemic reopening dynamics.
Why it matters:Market-impact and forward-implication layer: (1) XLK advanced +2.2% and cyclicals broadly benefited as the manufacturing rebound narrative displaced the “Q3 industrial slowdown” thesis that had weighed on the sector. (2) The Chicago PMI is historically a leading indicator for the national ISM Manufacturing PMI releasing June 2. A 62.7 Chicago reading argues for a significant beat vs. ISM consensus near 49–50; a national ISM confirmation above 50 would force rapid unwinding of short positions in industrials and basic materials. (3) Bond market impact: yields face upward pressure from the growth signal arriving alongside persistent 3.8% PCE and Fed officials flagging rate-hike risk. The simultaneous “stronger growth + higher inflation + no rate cuts” environment is the most challenging configuration for duration portfolios ahead of the June FOMC.
What to watch:ISM Manufacturing PMI on June 2 — a reading above 50 would confirm the Chicago signal and force a reassessment of the manufacturing contraction thesis; 10Y yield behavior around 4.55% as the threshold where growth-driven repricing accelerates into the June FOMC window.
BULLISH
2. IBM Commits $10 Billion to Quantum Computing by 2029; US Government Awards $1 Billion CHIPS Act Grant for “Anderon” — First US Quantum Chip Foundry; IBM +12.71%
The core facts:IBM announced a $10+ billion investment over the next five years targeting delivery of a large-scale, fault-tolerant quantum computer by 2029. Simultaneously, the US Department of Commerce announced a proposed $1 billion CHIPS Act incentive award — alongside approximately $1 billion in IBM cash, IP, and infrastructure — to establish Anderon, the first purpose-built, standalone quantum chip foundry in the United States. IBM currently operates 90+ quantum systems globally with an ecosystem of 325+ Fortune 500 companies, universities, and government agencies. IBM shares surged +12.71% on the session, creating approximately $32 billion in market value.
Why it matters:(1) IBM’s +12.71% move on a ~$250B market cap company demonstrates the market is willing to pay a premium growth multiple for quantum positioning — a thesis previously treated as speculative is now validated by federal capital commitment. The Anderon foundry designation carries the same industrial policy signal as TSMC’s Arizona fabs: the US government is guaranteeing demand for domestic quantum wafer production. (2) The $1B CHIPS Act award formally expands US industrial policy from classical semiconductors into quantum computing — positioning quantum as the next national technology competitiveness battleground alongside AI. This creates direct read-through for the quantum supply chain (IonQ, Rigetti, D-Wave). (3) The consecutive government-validated tech surges this week — Oracle +6.67% on government cloud, IBM +12.71% on CHIPS-backed quantum — confirm a structural re-rating dynamic: US government infrastructure contract = immediate multiple expansion. This playbook will attract investment across every company with federal AI, cloud, and quantum exposure.
What to watch:IBM Q2 2026 earnings (July) for early Anderon commercialization signals and CHIPS Act revenue recognition; whether DOE/DoD follow Commerce with additional quantum infrastructure investments; IonQ and Rigetti price reaction as the quantum infrastructure re-rating broadens.
BULLISH
3. Dell Q1 FY2027 Blowout Catalyzes AI Infrastructure Sector Rally — $51.3B AI Backlog Validates Enterprise Super-Cycle; DELL +32.8%, XLK +2.2%
The core facts:Dell’s Q1 FY2027 results (reported AMC Thursday, after yesterday’s MIB cutoff) triggered the broadest technology sector rally of the week on Friday. DELL surged +32.8% — the largest single-session gain for any S&P 500 mega-cap in 2026 — as institutions absorbed the scale of the beat: revenue $43.84B vs. $35.43B expected (+88% YoY), non-GAAP EPS $4.86 vs. $2.96 expected (64% beat), AI server revenue $16.1B (+757% YoY), AI orders $24.4B, and a record AI backlog of $51.3B. Dell raised FY27 guidance to $165–169B in revenue (vs. $142.5B consensus), $17.90 EPS (vs. $13.09 consensus), and $60B in AI server revenue. The Technology Select Sector SPDR (XLK) advanced +2.2% on the session.
Why it matters:(1) The $51.3B AI backlog is the most concrete enterprise-side evidence to date that AI infrastructure spending is structural and demand-driven — not hyperscaler capex that could be cut. Dell’s 5,000+ AI customers span neocloud providers, sovereign governments, and enterprise corporations — a demand breadth that makes the AI infrastructure thesis far more durable than a single-customer concentration risk. (2) Dell’s 64% EPS beat at $43.8B revenue scale represents a systematic failure of analyst models analogous to NVDA’s consistent underestimation in 2024-2025. With forward FY27 guidance raised to $17.90 EPS vs. $13.09 consensus, the gap between street estimates and actual results is widening, not narrowing — current forward estimates for DELL’s AI-adjacent peers are likely also too conservative. (3) The XLK +2.2% gain confirms that DELL’s blowout is being read as a sector signal, not a company-specific event. Nvidia, AMD, Super Micro Computer, and Oracle all benefited as the enterprise AI capex validation created a broad institutional buying wave heading into June.
What to watch:Palo Alto Networks (PANW) earnings on June 2 for whether enterprise IT security capex confirms DELL’s strength; NVDA earnings in mid-August for GPU shipment volume confirmation of the $51.3B Dell backlog; SMCI Q2 for the server-supply-chain read-through.
BEARISH
4. Fed Bowman Signals Hawkish Pivot on Iran Inflation; Schmid Raises Balance Sheet Tightening as Policy Tool — June FOMC Rate-Hike Risk Escalates
The core facts:Two Federal Reserve officials delivered market-moving speeches Friday, May 29, meaningfully escalating June FOMC rate-hike risk. Fed Vice Chair for Supervision Michelle Bowman stated that the Iran war’s ongoing energy shock “could change her view on the outlook for rates” if inflation effects persist and broaden — a notable departure from her prior framing as the committee’s most patient voice. Kansas City Fed President Jeffrey Schmid was more direct: calling inflation “too hot and above target for too long” and explicitly raising additional balance sheet tightening (quantitative tightening beyond current levels) as a policy tool to create needed economic headwinds — a proposal apparently at odds with Chair Warsh’s skepticism about using QT as a rate-augmentation instrument. Markets currently price a June FOMC hold.
Why it matters:(1) Bowman’s shift is the most significant individual move in the current communications cycle. She was the clearest “patient” voice on the committee; her “could change my view” language removes the last identifiable easing backstop. The FOMC now has four documented hawkish voices from this week alone: Cook (prepared to raise), Musalem (rates may head higher), Bowman (pivot signaled), and Schmid (balance sheet). The June 11-12 FOMC meeting has materially shifted from consensus hold to genuine debate. (2) Schmid’s balance sheet tightening proposal is qualitatively new and not priced by markets. Using both rate increases AND accelerated QT simultaneously — a tool combination never deployed in the 2022-2023 hiking cycle — would create more restrictive financial conditions than a rate hike alone. The 2Y Treasury yield would face immediate upward pressure if this view migrates into formal committee language. (3) The growth-inflation combination today — Chicago PMI 62.7 (growth accelerating) + PCE 3.8% (inflation persistent) + four hawkish Fed voices — creates the “no good news is good news” environment where strong data is bearish for fixed income and creates a ceiling for equity multiples.
What to watch:June 11-12 FOMC statement for whether individual hawkish language migrates into formal committee guidance; the FOMC blackout period beginning approximately June 3 as the last window for additional Fed speeches; 2Y Treasury yield for sustained break above 4.80% as the market’s signal that a rate hike is being actively priced.
UNCERTAIN
5. Trump Convenes Situation Room Meeting on Iran “Final Determination” — Oil Falls 4th Day; WTI -1.73% to $87.36; Brent Posts Biggest Monthly Loss in Six Years
The core facts:President Trump met with senior aides in the White House Situation Room for approximately two hours Friday to make a “final determination” about whether to approve a framework Iran deal. As of market close, Trump had not announced a decision. The president has publicly stated that any deal requires Iran to: (1) permanently forswear nuclear weapons, (2) immediately open the Strait of Hormuz to unrestricted commercial traffic without tolls, (3) clear all remaining mines in the strait, and (4) surrender enriched uranium buried under rubble from last year’s US and Israeli strikes. WTI crude fell -1.73% to $87.36/bbl and Brent declined -1.77% to $92.05/bbl — the fourth consecutive day of energy sector losses. WTI and Brent both posted their largest monthly declines in six years in May 2026.
Why it matters:(1) Markets are front-running an Iran deal. WTI’s 17% monthly decline and Brent’s six-year monthly loss represent the equity and commodity complex pricing in Iranian energy normalization before it is signed. If Trump approves a deal with Hormuz reopened, US PCE would receive a structural energy-cost reduction — WTI below $80/bbl would meaningfully reduce the 3.8% PCE print and give the Fed cover for patience through year-end. (2) The risk asymmetry is extreme in both directions. A signed deal: energy deflation accelerates, Fed stays on hold, S&P extends the rally. A collapse: oil reverses the monthly decline in days, energy sector gains on supply risk, and the inflation-driven rate-hike case from Bowman/Schmid is validated simultaneously. The market has no clear hedge for a binary outcome of this magnitude. (3) For equity portfolio managers, the Iran peace premium is now embedded in today’s record S&P close — which prices a world where both PCE declines (Iran deal) and growth accelerates (Chicago PMI 62.7). This simultaneous “best-case” scenario pricing means the S&P faces meaningful correction risk if either leg of the thesis fails to materialize.
What to watch:Trump’s formal announcement — likely weekend or early next week — as the critical binary catalyst; Iran’s domestic political response to Hormuz and nuclear conditions as the feasibility test; Monday oil futures open as the first real-time market verdict on any weekend announcement.
— Quantifying recession risk so you don’t have to guess. Apply for membership at join.recessionalert.comD. MODERATE-IMPACT STORIES -> TOP
BULLISH
6. April Goods Trade Balance Beats at -$82.4B vs. -$86.5B Consensus — Record Oil Exports Drive Narrowing; GDPNow Q2 Holds at 3.8%
The core facts:The Census Bureau’s advance April 2026 goods trade balance came in at -$82.4B, narrowing $2.9B from March’s -$85.3B and exceeding the -$86.5B consensus estimate by $4.1B (vs. some pre-release forecasts as wide as -$90.0B). The improvement was driven by record US oil and petroleum exports as domestic production captured Middle Eastern market share during Hormuz-disrupted supply routes. Capital goods imports remained elevated, reflecting sustained AI infrastructure procurement. The data released Friday, May 29, 2026.
Why it matters:Market-impact and forward-implication layer: (1) The narrower-than-expected deficit provides a modest positive contribution to the Atlanta Fed’s Q2 2026 GDPNow estimate (currently 3.8%) — the trade data supports the “Q2 growth acceleration” thesis that is driving today’s record market close. (2) Record US oil and petroleum exports are a direct consequence of the Iran conflict: US LNG and crude exporters captured Middle Eastern market share during Hormuz closure. If the Iran deal normalizes Hormuz access and Iranian exports resume, US export volumes may moderate — potentially widening the trade deficit again in Q3. (3) Persistent capital goods import strength confirms that AI infrastructure demand is not import-constrained — the US corporate sector is actively procuring AI hardware regardless of tariff headwinds, which supports sustained domestic IT capital spending through at least Q3 2026.
What to watch:May advance trade balance (released late June) for whether the April improvement is trend or a one-month oil-export artifact related to Hormuz disruption; GDPNow Q2 for any further upward revision following today’s combined trade + Chicago PMI beats.
UNCERTAIN
7. Gold Climbs to $4,593/oz (+1.34%) — Dual Inflation Hedge and Iran Uncertainty Bid Diverges From Oil’s Decline
The core facts:Gold advanced +1.34% Friday to close at $4,593/oz, extending its record-setting 2026 run on simultaneous demand from two distinct sources. The session reflected: (1) inflation hedge buying driven by PCE holding at 3.8% and Bowman’s hawkish Fed pivot, and (2) residual geopolitical uncertainty as Trump’s Situation Room meeting concluded without an Iran deal announcement. Silver tracked modestly (+0.34%); copper slipped -0.10%, confirming precious metal over industrial metal bifurcation — this was not a broad commodity rally but a safe-haven and inflation-hedge specific bid.
Why it matters:(1) Gold’s simultaneous rise alongside equities while oil falls is the classic stagflation hedging pattern: gold outperforms when inflation expectations rise faster than nominal yields, reducing real rates. The market is sending two signals at once — equities pricing soft landing via AI/growth momentum, gold pricing an inflation persistence scenario where the Fed cannot outrun 3.8% PCE without cracking growth. (2) GLD and IAU positions are now consensus longs. Any rapid Iran de-escalation that causes a sharp oil drop could temporarily hurt gold’s geopolitical bid, but the inflation hedge bid (3.8% PCE, Bowman pivot) would cushion the downside — gold’s floor is structural, not just geopolitical. (3) The copper divergence (-0.10%) is a warning signal: if the same investors bullish on Chicago PMI’s manufacturing rebound thesis were fully committed, copper should be outperforming. The copper-gold ratio declining indicates the market is hedging the growth thesis even as it participates in the equity rally.
What to watch:Gold around the $4,600/oz psychological threshold and its relationship to 10Y TIPS real yields — if real yields decline further as inflation expectations rise, the gold rally extends; copper for any reversal above $4.60/lb as confirmation that the manufacturing rebound is gaining broader commodity market credibility.
UNCERTAIN
8. OpenAI Adds Citigroup and JPMorgan to IPO Bank Lineup — $852B Valuation, September 2026 Target; Largest IPO in History Taking Shape
The core facts:Bloomberg reported Friday that OpenAI has held discussions with Citigroup and JPMorgan Chase about joining its IPO underwriting bank lineup alongside Goldman Sachs and Morgan Stanley, already engaged. OpenAI is targeting a confidential S-1 draft filing by late May 2026 and a public listing for September 2026. The company’s most recent private market valuation stands at $852 billion following a March 2026 funding round — the largest private company valuation in history. A public listing at approximately $1 trillion market capitalization would rank OpenAI immediately among the top five companies in the S&P 500 by market cap.
Why it matters:(1) A four-bank lead syndicate (Goldman, Morgan Stanley, Citi, JPMorgan) signals OpenAI is preparing a $1 trillion-class institutional distribution — sub-$500B IPOs do not require four bulge-bracket co-leads. The September target creates a specific near-term supply event for institutional portfolio managers: allocating to OpenAI at $1T valuation requires selling existing positions, creating rotation pressure on current AI names (MSFT, GOOGL, AMZN). (2) For financial sector investors, an OpenAI IPO at this scale generates underwriting fee revenue that may be the largest single-event fee pool in investment banking history — directly benefiting the four named banks and all co-managers. (3) The AI IPO pipeline — OpenAI ($852B) + Anthropic (planning listing) + SpaceX (expected) — is the largest concentrated capital market event in history. Simultaneous supply from three trillion-class AI offerings in 2026-2027 creates a supply-absorption question for institutional fixed allocations that current bullish sentiment has not yet priced.
What to watch:OpenAI’s confidential S-1 draft filing (targeted late May) for confirmation it occurred and any preliminary structural details (share class, employee liquidity, profit-sharing changes); Anthropic’s parallel IPO preparation for whether AI IPO supply concentration creates absorption issues for institutional investors.
BULLISH
9. Dow Closes Above 51,000 for the First Time; S&P 500 Posts Ninth Consecutive Weekly Gain — Longest Winning Streak Since 2023 Builds Overhead Risk
The core facts:The Dow Jones Industrial Average closed at 51,032.46 (+0.72%, +363 points) on Friday, May 29 — the first close above 51,000 in the index’s 130-year history. The S&P 500 advanced +0.22% to a record 7,580.06, logging its seventh consecutive daily gain and ninth consecutive weekly advance — the longest weekly winning streak since 2023. The Nasdaq rose +0.20% to 26,972.62, completing an +8% month for May. The S&P has gained approximately +20% from its March 2026 lows. DELL (+32.8%) and IBM (+12.71%) led the Dow’s advance, with Goldman Sachs also contributing. Five of eleven S&P sectors advanced; the Technology sector (XLK +2.2%) and Healthcare sector (XLV +1.4%) led.
Why it matters:(1) Nine consecutive weekly gains without a corrective week means the market has absorbed a calendar of bearish data — Q1 GDP at 1.6%, corporate profits -0.4% QoQ, PCE at 3.8%, and four Fed officials signaling rate hike risk — and still extended. This is momentum-driven pricing with elevated “sell the fact” correction risk once any of the embedded bull-case assumptions (Iran deal, no rate hike, Q2 earnings beat) fails to materialize. (2) The advance is narrow: only 5 of 11 sectors gained, with the Dow’s move concentrated in two stocks (DELL, IBM). An equal-weight S&P would show materially lower performance than the cap-weighted index. Breadth deterioration is a precursor indicator for corrections — the current breadth narrowing warrants monitoring alongside the VIX (currently near 15-16). (3) The Dow’s 51K milestone historically attracts retail inflows and media coverage — both factors that can temporarily sustain momentum. Simultaneously, institutional profit-taking at round-number psychological thresholds accelerates; the Dow 51K level may serve as a temporary ceiling before a corrective pullback.
What to watch:VIX for any expansion above 18 as the first signal of risk-sentiment deterioration; equal-weight S&P (RSP) vs. cap-weighted SPY for breadth confirmation or divergence; Monday’s open following a weekend that may include a Trump Iran deal announcement — a signed deal extends the rally while a collapse removes the embedded peace premium.
UNCERTAIN
10. Caesars Entertainment Acquired by Fertitta Entertainment for $17.6B — Largest Casino Acquisition in US History; 49% Premium Unlocks Gaming Sector Value
The core facts:Caesars Entertainment entered into a definitive merger agreement to be acquired by privately held Fertitta Entertainment — controlled by Tilman Fertitta (Golden Nugget, Landry’s) — in an all-cash transaction valued at $17.6 billion including approximately $11.9 billion of assumed debt. The offer of $31.00/share represents a 49% premium to Caesars’ unaffected share price as of February 25, 2026. The deal is the largest casino acquisition in US history by enterprise value and has received full board approval. A 10-bank debt financing syndicate is committed. A go-shop period runs through approximately July 11, 2026. Fertitta Entertainment’s 30+ Golden Nugget properties combined with Caesars’ 54 properties would create the largest gaming operator in the US by property count.
Why it matters:(1) The 49% premium at record equity market valuations confirms that large public gaming operators trade at persistent discounts to their private market value — a structural premium gap that draws attention to similarly situated operators. MGM Resorts, Wynn Resorts, and Vici Properties (gaming REIT) will all be evaluated through this lens; any activist or strategic buyer will now have a public precedent transaction at 49% premium to anchor an acquisition argument. (2) The 10-bank committed debt financing syndicate for this LBO represents significant leveraged loan issuance at current credit spreads — the market’s absorption of this gaming debt at current pricing is a signal of institutional risk appetite for high-yield credit, relevant for fixed income portfolio managers tracking credit spread dynamics. (3) The combined Fertitta-Caesars entity capturing approximately 25% of all US gaming floor space creates meaningful competitive pressure on MGM Resorts’ Las Vegas Strip dominance and accelerates the gaming sector’s shift toward private equity concentration away from public market ownership.
What to watch:Whether a competing bid emerges during the go-shop period (July 11 deadline); antitrust review timeline (FTC and multi-state gaming regulators; expected 12-18 months); MGM Resorts and Wynn Resorts share price reaction as the competitive implications are assessed and the strategic options repricing accelerates.
BEARISH
11. White House Targets 82% North American Auto Content (50% US Origin) — Supply Chain Restructuring Mandate Elevates Tariff Pressure on Foreign Automakers
The core facts:The Trump administration announced a formal push to raise North American automotive content requirements to 82% — with an explicit mandate that at least half of that content (41%+ of vehicle value) must originate from the United States. The policy represents a meaningful escalation of USMCA content thresholds, targeting further restructuring of automotive supply chains away from Mexican and Canadian input dependence. The announcement was made Friday, May 29, 2026.
Why it matters:(1) Ford, GM, and Stellantis — which have already moved manufacturing toward US-content compliance — are relatively positioned to benefit, while foreign automakers with deep Mexican and Canadian supply chains (Toyota, Honda, Hyundai/Kia, BMW/Mercedes US facilities) face the highest incremental compliance cost burden. Vehicles failing to meet the new threshold would likely face tariff exposure, creating near-term margin pressure as supply chains are restructured. (2) Mexican and Canadian parts suppliers are the most directly exposed: companies like Aptiv, Lear Corporation, and Magna International — with significant cross-border manufacturing footprints — face potential facility relocation pressure or margin compression if customers demand US-origin compliance at scale. (3) The announcement arrives as the auto sector is already managing elevated steel and aluminum tariff costs, rising borrowing rates slowing vehicle demand, and core capex contraction (-1.1% in April). A third layer of supply chain cost pressure — on top of materials tariffs and credit headwinds — compounds the sector’s operational challenges heading into Q3 2026.
What to watch:Formal regulatory filing timeline for the content requirement increase (determines enforcement date and compliance transition period); GM and Ford Q2 earnings for explicit supply chain cost quantification of the new threshold; Mexican peso and Canadian dollar reaction as trade-weighted currency impacts of reduced auto parts export demand become clearer.
— Separating signal from noise since 2007. Apply for membership at join.recessionalert.comE. ECONOMY WATCH -> TOP
Friday’s data split along a now-familiar fault line: hard activity data roared back — Chicago PMI’s 13.5-point surge to 62.7 is the index’s highest reading in 37 months, and the April goods trade deficit narrowed to $82.4B, beating consensus by $4.6B on record petroleum exports — while the labor and consumption layer remained soft (claims 215K, above forecast; Paulson flagging cautious households). The Fed divide deepened in parallel: Bowman defended the easing bias and framed Iran-war energy prices as temporary, while Schmid warned inflation has run above target for five years and floated additional balance sheet tightening. GDPNow’s Q2 estimate of 3.8% remains robust, but the Fed hawks’ insistence that the all-clear hasn’t been sounded keeps the June FOMC outcome genuinely open.
Chicago PMI Surges 13.5 Points to 62.7 in May — A 4-Year High Demolishing Forecasts (MNI/ISM Chicago, May 29, 2026)
What they’re saying:The MNI Chicago Business Barometer surged to 62.7 in May, a 13.5-point jump from April’s contraction reading of 49.2 and the largest single-month increase since 2020. The print was 12.2 points above the 50.5 consensus and marks the index’s highest level in 37 months — a dramatic reversal from two consecutive sub-50 months that had raised industrial recession concerns.
The context:The Chicago PMI is a regional proxy for national manufacturing momentum, and a swing of this magnitude from contraction to near-boom conditions in a single month is exceptional. It points to persistent tariff front-running (pulling forward orders ahead of potential escalation) and sustained AI-related capital expenditure as the dominant demand drivers. The data now points sharply against last week’s “manufacturing hard data cracking” narrative; if Monday’s national ISM Manufacturing PMI (expected 52.6) confirms, the industrial recession scenario for Q2 loses most of its remaining credibility.
What to watch:Mon Jun 1 ISM Manufacturing PMI (May) — expected 52.6, prior 52.7 — the national barometer; a reading above 52 confirms today’s Chicago signal and shifts the industrial outlook firmly to expansion.
US Goods Trade Deficit Narrows to $82.4B in April — $4.6B Better Than Expected as Oil Exports Hit Record (Census Bureau, May 29, 2026)
What they’re saying:The April advance estimate for the US goods trade deficit came in at $82.4 billion, narrowing 3.4% from March’s $87.45 billion and beating the $86.5 billion consensus by $4.6 billion. Record exports in oil and petroleum products drove the improvement, while a continued surge in capital goods imports — linked to AI infrastructure buildout — partially offset the gain.
The context:The better-than-expected trade figure directly reduces the Q2 net exports drag on GDP. The Atlanta Fed’s GDPNow model currently tracks Q2 growth at 3.8% (updated May 28, down from 4.3% on May 21), and the June 1 model update will incorporate today’s data — a positive revision is likely. The divergence between record petroleum exports and surging AI capex imports captures two competing structural forces: energy independence tailwinds versus technology import intensity. On balance, the net result is constructive for Q2 tracking.
What to watch:Jun 1 GDPNow update (will incorporate today’s trade data); full April trade report (goods + services, due in approx. 4 weeks).
Fed Divide Deepens: Bowman Defends Easing Bias While Schmid Warns Inflation Has Run Hot for Five Years (Federal Reserve, May 29, 2026)
What they’re saying:Vice Chair Michelle Bowman defended retaining the FOMC’s rate-cut language in the policy statement, arguing that core PCE inflation — excluding tariff effects and energy — remains near 2%, and that Iran war-driven energy price pressures are likely temporary. Kansas City Fed President Jeff Schmid pushed back sharply, warning that inflation has run above the 2% target for over five years, calling for the Fed to “signal its commitment to price stability,” and raising the prospect of additional balance sheet tightening beyond rate policy.
The context:The Bowman-Schmid split is a precise map of the June FOMC dilemma. Bowman’s framework — look through temporary energy shocks, preserve optionality to cut if labor weakens — is supported by today’s constructive hard data (Chicago PMI, trade beat). Schmid’s counter — five years above target demands credibility, not accommodation — is supported by April core PCE at 3.3% and the Iran conflict keeping energy elevated indefinitely. Schmid’s mention of balance sheet tightening as a potential additional tool adds a hawkish tail risk the market has not priced. The committee’s ability to remain unified around the current “no change, watch and wait” stance is being tested.
What to watch:Next FOMC meeting; May CPI and PCE data (due before the meeting) will be the decisive inputs — a further pickup in headline inflation could break the committee’s current consensus hold.
Initial Jobless Claims Rise to 215K — Modest Miss vs. 211K Forecast (DOL, May 28, 2026)
What they’re saying:Initial jobless claims rose 5,000 to 215,000 for the week ending May 23, modestly above the 211,000 consensus and up from the prior week’s revised 210,000. The 4-week moving average climbed to 209,000 (+6,250 from the prior week’s average). Continuing claims for the week ending May 16 rose 15,000 to 1,786,000.
The context:The slight miss is not alarming in isolation — 215K remains historically low and consistent with a stable labor market — but the gradual upward creep in both initial and continuing claims is worth tracking alongside Philadelphia Fed President Paulson’s observation this week that households and businesses are increasingly cautious and moderating consumption. A labor market that remains resilient at the headline level but is slowly softening at the margin is precisely the scenario that supports Bowman’s “stay on hold, preserve optionality” view at the Fed.
What to watch:Jun 5 Non-Farm Payrolls (May) — the highest-impact upcoming release; >200K would confirm labor market resilience and lock the Fed on hold; <150K would deepen the stagflation-lite dilemma ahead of the next FOMC meeting.
Atlanta Fed GDPNow Trims Q2 2026 Estimate to 3.8% — Down 50bps From Last Week’s 4.3% (Atlanta Fed, May 28, 2026)
What they’re saying:The Atlanta Fed’s GDPNow model lowered its Q2 2026 real GDP growth estimate to 3.8% (seasonally adjusted annual rate) as of May 28, down from 4.3% on May 21. The 50-basis-point week-over-week decline reflects the weight of last week’s soft personal income (flat in April) and PCE data on the model’s household consumption components. The next update, expected June 1, will incorporate today’s better-than-expected April trade balance data.
The context:A 3.8% Q2 nowcast remains robust relative to Q1’s downward-revised 1.6%, and the incoming trade beat should nudge the June 1 update upward. However, the week-over-week softening illustrates how quickly a strong Q2 tracking estimate can erode when consumption data disappoints. The nowcast-vs-recession-forecast divergence remains wide — GDPNow 3.8%, Polymarket recession odds 19%, RSM 12-month recession probability 30% — suggesting markets are pricing a Goldilocks soft landing that the Fed’s internal hawks do not yet feel comfortable endorsing.
What to watch:Jun 1 GDPNow update (first Q2 model read incorporating today’s trade data); Jun 3 ISM Services PMI and ADP Employment (May) will be key consumption and labor inputs into subsequent model updates.
— Know the probability before the market prices in the risk. Apply for membership at join.recessionalert.comF. EARNINGS WATCH -> TOP
YESTERDAY AFTER THE BELL (Markets Reacted Today)
UNCERTAIN
12. Costco Wholesale (COST): -4.6% | Revenue Beat and Strong Comps Cannot Offset Stretched Valuation as Sell-on-Earnings Discipline Hits P/E 49 Stock
The Numbers:Q3 FY2026 (ended May 11, 2026): Revenue $70.53B (+12% YoY), net sales $69.15B (+11.6%) — beat. Non-GAAP EPS $4.93 vs. ~$4.91 estimate — minimal beat. Gross margin 11.04%, down 21 bps YoY (transportation costs from higher gas prices; lower margins in fresh and food and sundries). Comparable sales +9.8% global. Membership renewal rate 89.7%. Released AMC May 28, 2026.
The Problem/Win:The win is operational: +9.8% comps and 89.7% renewal rate confirm Costco’s member loyalty and pricing power are structurally intact. The problem is valuation: at a P/E of approximately 49x, the market prices perfection. A 21-bps gross margin contraction — driven by Iran-related gas price increases flowing into transportation costs — removed the “margin stability” pillar of the bull case. Management also warned of further inflation in nonfood categories as higher resin costs (tariff-driven) flow through the supply chain, signaling Q4 margin pressure ahead. The -4.6% session reaction is consistent with Costco’s historical pattern of selling off post-earnings at elevated valuations even on operational beats.
The Ripple:Consumer staples broadly underperformed Friday as the COST reaction reinforced valuation-discipline selling in high-multiple defensive names. BJ’s Wholesale, Target, and Walmart all face investor scrutiny on whether their current multiples can absorb margin pressure from tariff-driven cost inflation. Separately, reports emerged that Costco may issue a special dividend — providing a potential earnings catalyst support that partially offsets the near-term margin narrative headwind.
What It Means:Costco’s sell-on-earnings reaction illustrates the multiple-compression risk embedded in high-P/E consumer staples at current valuations: even operationally solid results trigger selling when margins disappoint and the company explicitly flags further tariff-driven inflation. The Q4 FY2026 earnings (August 2026) are the key test for whether the margin contraction stabilizes or deepens.
What to watch:Q4 FY2026 Costco earnings (August 2026) for gross margin trajectory and tariff cost quantification; special dividend announcement timing as a potential near-term catalyst; Walmart’s next quarterly report for comparable comps and margin compression signals across the big-box sector.
BULLISH
13. Dell Technologies (DELL): +32.8% | Record AI Server Revenue +757% YoY; $51.3B Backlog and Raised FY27 Guidance Validate Enterprise AI Capex Super-Cycle
The Numbers:Q1 FY2027 (ended May 1, 2026): Revenue $43.84B vs. $35.43B estimate — beat (+88% YoY). Non-GAAP EPS $4.86 vs. $2.96 estimate — 64% beat (diluted EPS +214% YoY). AI server revenue $16.1B (+757% YoY); AI orders $24.4B; AI backlog $51.3B (record). Operating income $4.2B (+154% YoY) on 9% operating expense growth. Operating cash flow $4.1B (record). FY27 guidance raised to $165–169B revenue (vs. $142.5B consensus), $17.90 EPS (vs. $13.09 consensus), and $60B AI server revenue. Released AMC May 28, 2026.
The Problem/Win:An extraordinary beat across every metric with significant guidance raises across every forward measure. The $51.3B AI backlog — representing approximately 3x Q1 AI revenue — confirms that demand is structural and multi-quarter, not front-loaded. Demand continues to outpace supply with memory and components as the primary constraint. Dell’s AI customer count surpassed 5,000, spanning neoclouds, sovereign governments, and enterprises — the broadest enterprise AI hardware customer base in the industry. The pipeline is described by management as “multiples” of the existing backlog, suggesting $51.3B materially understates forward demand. The 64% EPS beat at $43.8B scale confirms analyst models are systematically underestimating AI infrastructure build velocity.
The Ripple:DELL’s +32.8% session — the largest for any S&P 500 mega-cap in 2026 — triggered the broadest AI infrastructure sector rally of the week. XLK advanced +2.2%; Nvidia, AMD, and Super Micro Computer all gained as the enterprise AI capex validation removed any remaining doubt about the cycle’s duration. The Dow’s historic 51,000 close was driven in significant part by DELL’s contribution. With FY27 guidance of $60B in AI server revenue, DELL’s supply chain — including NVDA GPU components — is implicitly guiding for sustained demand well into 2027.
What It Means:Dell’s Q1 FY27 result is the most definitive evidence to date that AI infrastructure spending is a structural, multi-year investment cycle with enterprise breadth beyond hyperscalers. For portfolio managers, DELL now serves as a leading indicator for AI hardware demand — its $51.3B backlog and raised guidance reset the floor for consensus estimates across the AI infrastructure supply chain through at least FY27.
What to watch:PANW earnings June 2 for enterprise IT spending confirmation beyond hardware; NVDA mid-August earnings for GPU shipment volume corroboration of the $51.3B DELL backlog; SMCI Q2 for the server supply-chain read-through; any management commentary at upcoming tech conferences on memory and component supply normalization.
TODAY BEFORE THE BELL (Markets Already Reacted)
No major earnings before the bell from companies with >$100B market cap.
TODAY AFTER THE BELL (Markets React Tomorrow)
No major earnings after the bell from companies with >$100B market cap.
WEEK AHEAD PREVIEW:
Q1 2026 earnings season is functionally complete (~92% of S&P 500 reported). The coming week’s spotlight shifts to a single major reporter — cybersecurity’s bellwether — before the June FOMC decision and May Non-Farm Payrolls define the macro direction for summer.
Palo Alto Networks (PANW) — AMC, Tuesday, June 2 — Key focus: NGS Annual Recurring Revenue (ARR) guidance of $7.94–7.96B (+56% implied YoY) vs. Q2’s $6.33B actual (+33%); platformization momentum (1,550 customers, +35% YoY) for acceleration signals; integration cost headwinds from the CyberArk acquisition; EPS consensus $0.80, revenue consensus $2.94B (+28.6% YoY). PANW is the high-watermark cybersecurity name — guidance commentary on enterprise IT security spending will be read as a direct corroboration or challenge to Dell’s AI capex super-cycle thesis from Thursday’s blowout.
Beyond earnings, the week’s defining events are macro: ISM Manufacturing PMI (Tuesday, June 2) as the first national confirmation or refutation of today’s Chicago PMI 62.7 surge; and May Non-Farm Payrolls (Friday, June 5) as the highest-impact remaining data point ahead of the June 11-12 FOMC meeting — a print above 200K locks the Fed on hold; below 150K deepens the stagflation-lite dilemma.
— US market commentary trusted by family offices and institutions. Apply for membership at join.recessionalert.comG. WHAT’S NEXT -> TOP
UPCOMING RELEASES:
| Date | Event | Why It Matters |
|---|---|---|
| Mon, Jun 1 | ISM Manufacturing PMI — May (exp. 52.6, prior 52.7) | The highest-stakes release of the week: Friday’s Chicago PMI exploded to 62.7, a 37-month high. A national ISM above 52 confirms the manufacturing rebound and forces short-covering in industrials; a miss below 50 would expose the Chicago reading as a regional outlier and revive the Q3 industrial slowdown thesis |
| Mon, Jun 1 | ISM Manufacturing Prices — May (exp. 85.3, prior 84.6) | Input price inflation at 85.3 alongside persistent 3.8% PCE would add directly to the Bowman-Schmid hawkish case at the Fed; a sustained elevation above 80 in the prices component is the transmission channel from manufacturing demand to consumer inflation |
| Mon, Jun 1 | ISM Manufacturing New Orders — May (exp. 54.1, prior 54.1) | New orders stability at 54.1 would confirm forward demand visibility for US manufacturers; a surprise jump consistent with Chicago’s blowout would signal Q3 order books are filling ahead of potential tariff escalation |
| Mon, Jun 1 | Construction Spending MoM — Apr (exp. 0.3%, prior 0.6%) | A deceleration to 0.3% would reflect the softening in residential investment visible in recent housing data; watch for AI data center and semiconductor fab construction offsetting residential weakness |
| Tue, Jun 2 | JOLTs Job Openings — Apr (exp. 6.8M, prior 6.866M) | A decline toward 6.8M would suggest modest labor demand cooling consistent with gradual jobless claims increases; the openings-to-unemployed ratio is the Fed’s preferred labor tightness gauge ahead of the June FOMC — any sharp drop below 6.5M would shift the committee’s balance toward caution |
| Wed, Jun 3 | ADP Employment Change — May (exp. 110K, prior 109K) | The private sector payroll preview for Friday’s NFP; consensus at 110K implies steady but unspectacular hiring; a print above 150K would reinforce the labor resilience narrative and lock the June FOMC on hold, while a sub-80K miss deepens the stagflation concern |
| Wed, Jun 3 | ISM Services PMI — May (exp. 53.6, prior 53.6) | Services sector stability is the core underpinning of the 3.8% GDPNow Q2 estimate; a beat combined with Monday’s ISM Manufacturing above consensus would present a fully re-accelerating economy to Fed hawks at precisely the wrong time — June FOMC rate-hike odds would re-price sharply higher |
| Wed, Jun 3 | Fed Beige Book | The anecdotal district-level survey is the last Fed communication before the June 3 blackout period begins; watch for language on consumer spending durability, regional manufacturing conditions, and any early inflation pass-through from tariffs or energy costs that would validate the Schmid hawkish view |
KEY QUESTIONS:
1. Did Trump approve the Iran deal over the weekend? A signed framework means WTI toward $80/bbl, structural PCE relief, and Fed patience extended through summer — a collapse reverses the monthly crude decline in days and simultaneously validates Bowman and Schmid’s hawkish case, creating a dual macro headwind heading into June FOMC
2. Will Monday’s ISM Manufacturing PMI confirm Chicago’s 37-month high at 62.7, or will the national reading reveal a regional distortion? A sub-50 ISM would immediately challenge the growth-acceleration thesis driving the S&P’s ninth consecutive weekly gain — and with GDPNow at 3.8%, the divergence from soft data would become impossible to ignore
3. Can labor market resilience carry the market through a week front-loaded with employment data? Wednesday’s ADP and Friday’s Non-Farm Payrolls are the decisive inputs into both the June FOMC calculus and the GDPNow Q2 forecast — a payrolls miss below 150K would force the Fed into the most difficult stagflation-lite policy environment since 2022
— US market commentary trusted by family offices and institutions. Apply for membership at join.recessionalert.comH. CHART OF THE DAY -> TOP
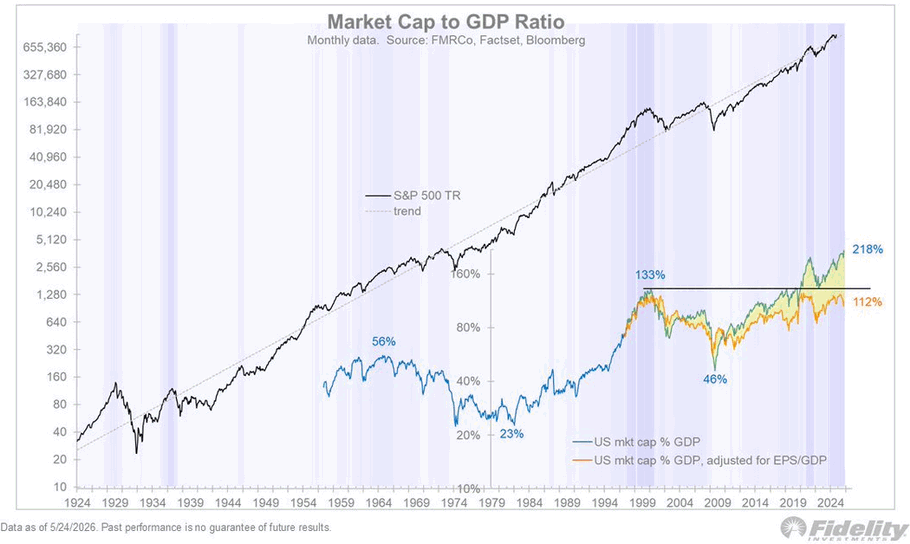
The headline screams biggest bubble in history. Read the same chart through the right lens and the alarm goes quiet. US market cap as a share of GDP sits at 218% — 1.6 times the 2000 dotcom peak of 133%, and parked above that line for eight straight years while the S&P 500 TR roughly doubled across the same span. Adjust for the EPS-to-GDP shift and the line drops to 112%, with roughly 21 points of clean air below 2000. That 106-point gap is the entire argument. Corporate profit-share of GDP stepped from a ~7% pre-2000 average to ~12% post-2010 — S&P firms now harvest over 40% of revenue offshore against a US-only denominator, while intangibles-heavy, capital-light models compounded the margin lift. The Buffett Indicator and the ten-year CAPE share the flaw: stationary ratios layered on a non-stationary earnings base. The yellow zone is not building danger; it is accumulating falsification. The real tripwire is mechanical — a margin reversal would drag the orange line toward 133%. That is the print to fear, not today’s 218%.
Market Intelligence Brief (MIB) Ver. 18.37
For professional investors only. Not investment advice.
© 2026 RecessionALERT.com

Comments are closed.