
MU surged +19% after UBS tripled its price target to $1,625, lifting Nasdaq past 30,000 and S&P 500 to records. Overnight US airstrikes on IRGC targets imperiled the ceasefire, sending Brent near $100 and gasoline to $4.56/gal — a four-year high. Energy equities (CVX -3.5%, XOM -3.3%) fell despite the crude surge as markets priced Iranian supply re-entry. SpaceX received FTSE Russell fast-entry eligibility for its $1.75T IPO. Consumer Confidence slipped as two-thirds of consumers cut spending on inflation.
TABLE OF CONTENTS
A. EXECUTIVE SUMMARY
B. MARKET DATA
C. HIGH-IMPACT STORIES (5)
D. MODERATE-IMPACT STORIES (5)
E. ECONOMY WATCH (5)
F. EARNINGS WATCH (0)
G. WHAT’S NEXT
H. CHART OF THE DAY
A. EXECUTIVE SUMMARY -> TOP
Tuesday’s record S&P and Nasdaq closes rest on a geopolitically fragile foundation: overnight US airstrikes on IRGC targets near Bandar Abbas have materially imperiled the ceasefire framework that equity markets are pricing — the VIX rising 2.5% alongside a record tape is the clearest signal that professional hedgers are not yet accepting the Iran deal narrative. The inflation transmission is already live: Brent near $100/barrel, gasoline at a four-year $4.56/gal high, and today’s Conference Board data showing two-thirds of consumers actively cutting spending are converging into a stagflation setup the Fed cannot cut through, with Dallas Fed manufacturing input costs at 8-month highs. Breadth was 8-of-11 sectors positive, but leadership extremes tell the structural story — semiconductors and AI infrastructure (SOX +5%) carried the advance while Energy (-2.31%) and Consumer Defensive (-1.44%) accelerated their multi-month declines, confirming this session’s rally was a growth-in-tech rotation, not a broadening cyclical recovery.
• MU +19%, Nasdaq 30,000, S&P record: UBS tripled Micron’s price target to $1,625 (Street-high), citing HBM4 sold out through year-end 2026, multi-year hyperscaler LTAs, and $400B+ FCF through 2029; SOX +5%, MRVL +10% on AI sympathy ahead of Wednesday earnings.
• Ceasefire at risk: Overnight US airstrikes on IRGC targets near Bandar Abbas — Iran’s Revolutionary Guard reserved the right to retaliate; Brent surged to ~$99.50, national gasoline $4.56/gal (four-year high); Hormuz remains closed.
• Energy sector vs. crude divergence: CVX -3.5%, XOM -3.3% fell while Brent surged — market pricing future Iranian supply re-entry (1–2mbpd re-entry scenario) over today’s war premium; Energy sector -2.31%, YTD’s best sector turned session’s worst.
• SpaceX $1.75T IPO: FTSE Russell fast-entry eligibility confirmed; passive mandates estimated to force buying of ~19% of public float — the largest single index-entry demand event in equity history; Nasdaq listing expected June 2026.
• Consumer stress deepening: CB Confidence 93.1 — two-thirds cutting spending on inflation; Dallas Fed capacity utilization plunged 15 points (8-month input-cost high); Case-Shiller real home price returns negative for a 10th consecutive month.
• Thursday macro barrage: Core PCE Apr (exp. +3.3% YoY), GDP Q1 2nd estimate (exp. 2.0%), Durable Goods, Personal Spending (exp. +0.5% vs. +0.9% prior), and Initial Claims — the Fed’s full scorecard arrives in one session.
1. AI Secular Re-Rating vs. Geopolitical Fragility — The Nasdaq crossed 30,000 on AI-infrastructure conviction while the VIX rose and the Dow fell — an analytically honest split revealing that the market knows its risk appetite depends on an Iran ceasefire framework that overnight airstrikes have materially destabilized. The AI trade and the geopolitical macro are pulling in opposite directions simultaneously, and the record closes obscure which force is winning.
2. Stagflation Feedback Loop Building — Every major data point today converges on contracting real consumer health and rising input costs: Brent near $100, gas at $4.56/gal, CB two-thirds cutting spending, Dallas Fed capacity utilization -15 points, and real home prices negative for 10 consecutive months. The CFNAI’s above-trend +0.14 is the sole bullish counter-signal — driven by AI capex, not consumer health. The Fed’s policy paradox is explicit: cutting would validate the inflation impulse; holding risks an abrupt consumer pullback as the spending deceleration in Thursday’s Personal Spending print could confirm.
3. Markets Pricing the Post-War World — Energy equities pricing a future supply glut while spot Brent prices a supply shock is the session’s most structurally important signal: the market believes the ceasefire ultimately holds (or is forced), Iranian crude re-enters at 1–2mbpd, and the war premium mean-reverts — even as the overnight airstrikes actively threaten that scenario. The US-China Board of Trade and $30B tariff-cut review adds a second de-escalation pricing layer. The market is simultaneously pricing resolution of both the Middle East conflict and the trade war, despite neither being resolved.
 — Leading economic indicators. Accurate market forecasts. Apply for membership at join.recessionalert.com
B. MARKET DATA -> TOP
An AI-fueled semiconductor surge — Micron Technology leaping 19% after UBS raised its price target to $1,625 — carried the Nasdaq and S&P to fresh all-time highs, with US-Iran ceasefire optimism amplifying gains in industrials and transports. Breadth was broadly positive (8 of 11 sectors gained) but the Dow’s -0.23% close exposed the split: energy stocks (CVX -3.5%, XOM -3.3%) and consumer defensive dragged blue-chips lower even as growth indices hit records. The sharpest anomaly was Brent crude surging +3.06% while the energy sector fell -2.31% — stocks are pricing future Iranian supply re-entry through Hormuz, not today’s spot price. Yields edged down modestly while VIX rose 2.5% alongside equities — a bond/options disconnect signaling residual uncertainty about whether the Iran framework holds.
CLOSING PRICES – Tuesday, May 26, 2026:
MAJOR INDICES
S&P and Nasdaq hitting records while the Dow fell -0.23% tells the whole story: this was a high-growth, semiconductor-driven session, not a broad blue-chip rally. Dow Theory’s same-day divergence reinforces it — DJIA -0.23% vs DJTA +2.13%, a 2.36pp gap well above the 1.5% threshold, with transports surging on Iran/Hormuz optimism while energy-heavy components weighed on the Dow. The longer trend remains firmly constructive: Dow Theory bull confirmation is entrenched — the 5th consecutive session with both DJIA and DJTA within 2% of their 10-session highs — but today’s sharp intraday split demands attention. DJTA reached a new 10-session high, outrunning industrials for the first time in this stretch.
| Index | Close | Change | %Move | Why It Moved |
|---|---|---|---|---|
| S&P 500 | 7,519.34 | +45.87 | +0.61% | Semiconductor surge (MU +19%) and Iran deal optimism lifted tech-heavy index to record close; energy and defensive declines capped the gain |
| Dow Jones | 50,461.68 | -118.02 | -0.23% | Heavy weighting toward energy (CVX -3.5%, XOM -3.3%) and consumer defensive dragged blue-chips lower; blue-chip index diverged sharply from Nasdaq and S&P records |
| DJ Transportation | 21,209.3 | +441.8 | +2.13% | Iran ceasefire and Hormuz reopening prospects boosted freight and logistics stocks; DJTA hit a new 10-session high, outpacing the Dow by 2.36pp — widest same-day spread in this Dow Theory stretch |
| Nasdaq 100 | 30,001.32 | +519.68 | +1.76% | Semiconductor rally (MU +19%, AMD +8%, KLAC +6.5%) on UBS AI-memory upgrade; Nasdaq crossed 30,000 for the first time; record close |
| Russell 2000 | 2,921.21 | +51.98 | +1.81% | Broad risk-on rotation into domestic small-caps on Iran deal optimism; Russell closed above 2,900 — strongest session in two weeks |
| NYSE Composite | 23,295.50 | +69.75 | +0.30% | Modest composite gain; energy and defensive declines offset technology and industrials strength; breadth positive but muted at NYSE level |
VOLATILITY & TREASURIES
VIX rising 2.5% on a day S&P gained 0.6% is the session’s clearest tell — equity bulls and options hedgers parted ways, almost certainly reflecting uncertainty about whether the US-Iran ceasefire framework holds beyond the short term. Both yields edged down (10Y -0.6 bps, 2Y -1.1 bps), a mild flight-to-quality bid coexisting with the equity rally. The spread barely moved (2Y fell more than 10Y, tiny curve flattening); no shift in the rate path — this was a market that rallied but didn’t fully believe it.
| Instrument | Level | Change | Why It Moved |
|---|---|---|---|
| VIX | 17.01 | +0.42 (+2.53%) | VIX rose alongside equities — classic geopolitical hedging; traders bought protection against Iran deal collapse even as stocks rallied on deal optimism |
| 10-Year Treasury Yield | 4.486% | -0.6 bps | Mild safe-haven bid coexisted with equity rally; geopolitical uncertainty capped any yield rise despite risk-on; bond market declining to confirm the equity move |
| 2-Year Treasury Yield | 4.036% | -1.1 bps | Short-end declined slightly more than 10Y; markets see no Fed catalyst to reprice near-term rate path; flat policy expectations intact |
| US Dollar Index (DXY) | 99.14 | -0.10 (-0.10%) | Modest dollar softness on Iran deal risk-on; safe-haven demand reduced marginally; EUR/USD edged up +0.07% as ceasefire prospects reduced geopolitical premium |
COMMODITIES
Gold’s near-flat close ($4,543, +0.04%) amid an equity surge signals that the geopolitical bid has largely normalized — markets aren’t panic-buying safety, but aren’t abandoning it either. Bitcoin’s -1.87% decline against a risk-on tape is the divergence: institutional flows chased the AI/semiconductor equity story rather than crypto this session, suggesting BTC is tracking its own supply/positioning dynamics. Copper and platinum both essentially flat — industrial metals unimpressed by the surface rally, consistent with a tech-driven rather than economy-driven session.
| Asset | Price | Change | %Move | Why It Moved |
|---|---|---|---|---|
| Gold | $4,543.25/oz | +$1.65 | +0.04% | Essentially flat; risk-on reduced safe-haven buying but residual Iran deal uncertainty provided a floor; gold holding $4,500+ level |
| Silver | $77.540/oz | +$0.265 | +0.34% | Modest industrial demand lift from strong Industrials/Materials session; moved in line with precious metals complex |
| Copper | $6.4268/lb | +$0.0034 | +0.05% | Near-flat; industrial metals unmoved by the tech/semiconductor rally; copper confirming this was a growth-in-tech story, not a broad cyclical recovery |
| Platinum | $1,971.20/oz | +$0.40 | +0.02% | Essentially flat; moved with the broader precious metals complex; no specific catalyst |
| Bitcoin | $75,724.0 | -$1,440.0 | -1.87% | Declined against a risk-on tape; institutional flows rotated into AI/semiconductor equities rather than crypto; BTC holding above $75K support |
ENERGY
The session’s defining energy signal: Brent surging +3.06% while the energy sector fell -2.31% — the equity market is pricing what comes after Hormuz reopens (Iranian crude re-entering global supply), not today’s spot price. WTI’s near-flat close (+0.07%) reflects North American insulation from the Hormuz dynamic; the Brent-WTI spread blew out to approximately -$2.67, a geopolitical premium visible almost exclusively on internationally-traded barrels. Natural gas decoupled entirely (Henry Hub +0.17%, Dutch TTF -2.42%), confirming this is a geopolitical crude story with no broader energy-inflation transmission.
| Asset | Price | Change | %Move | Why It Moved |
|---|---|---|---|---|
| Crude Oil (WTI) | $93.61/bbl | +$0.07 | +0.07% | Near-flat; North American crude insulated from Hormuz supply dynamics; US producers unaffected by Iran re-entry into international markets |
| Crude Oil (Brent) | $96.28/bbl | +$2.86 | +3.06% | Surged on near-term Hormuz supply uncertainty as US-Iran negotiations remain fluid; globally-traded barrels carrying geopolitical premium; Brent-WTI spread blew out to ~-$2.67 |
| Natural Gas (Henry Hub) | $3.013/MMBtu | +$0.005 | +0.17% | Near-flat; US natural gas driven by domestic supply/demand fundamentals, fully decoupled from geopolitical crude story |
| Natural Gas (Dutch TTF) | $16.19/MMBtu | -$0.40 | -2.41% | European natural gas declined on ample LNG supply and mild late-May demand; decoupled from Brent; TTF-Henry Hub spread compressing as European storage remains comfortable |
S&P 500 SECTORS
Energy’s -2.31% today is the sharpest rotation story: the session’s worst sector is also YTD’s best (+29.81%) — Iran supply re-entry fears are repricing the entire sector, overriding a 30%+ 6-month tailwind. Basic Materials’ +2.49% reverses a -6.13% 3-month slide, suggesting a tentative positioning reset rather than fundamental demand recovery. Consumer Defensive continues its structural unraveling: -1.44% today, -3.95% this week, -6.61% over 3 months — every time horizon confirms secular rotation away from defensives and into growth and cyclicals.
| Sector | 1-Day | 1-Week | 1-Month | 3-Month | 6-Month | YTD | 12-Month |
|---|---|---|---|---|---|---|---|
| Basic Materials | +2.49% | +2.86% | -0.68% | -6.13% | +31.43% | +16.75% | +48.91% |
| Industrials | +1.94% | +3.12% | +1.84% | +0.17% | +22.75% | +15.59% | +29.70% |
| Technology | +1.69% | +4.62% | +10.69% | +23.36% | +27.04% | +21.76% | +50.89% |
| Communication Services | +0.99% | -0.78% | +4.32% | +10.41% | +14.84% | +7.50% | +37.55% |
| Real Estate | +0.48% | +2.11% | +1.62% | +1.73% | +9.63% | +9.20% | +10.73% |
| Utilities | +0.40% | +3.29% | -2.66% | -3.51% | +5.22% | +7.37% | +17.71% |
| Financial | +0.38% | +1.30% | +1.90% | +1.94% | +6.31% | -1.82% | +11.63% |
| Consumer Cyclical | +0.35% | +2.33% | +0.63% | +2.49% | +6.77% | -0.60% | +10.63% |
| Healthcare | -0.67% | +2.06% | +2.12% | -5.30% | -0.13% | -3.02% | +15.65% |
| Consumer Defensive | -1.44% | -3.95% | -0.72% | -6.61% | +8.80% | +7.42% | +5.02% |
| Energy | -2.31% | -4.20% | +0.46% | +7.23% | +30.54% | +29.81% | +43.69% |
TOP MEGA-CAP MOVERS:
GAINERS
| Company | Ticker | Close | Change | Why It Moved |
|---|---|---|---|---|
| Micron Technology | MU | $895.88 | +19.29% | UBS raised price target to $1,625 (from $535) citing AI-driven memory demand surge; MU topped $1 trillion market cap for the first time; largest single-day gain for a mega-cap semiconductor this cycle |
| Advanced Micro Devices | AMD | $503.89 | +7.78% | Sympathy rally with Micron; AI GPU demand narrative reinforced by the UBS/MU upgrade sweep; AMD is the second-largest beneficiary of AI accelerator spend after Nvidia |
| Sandisk Corp | SNDK | $1,589.55 | +7.50% | Flash memory/storage play surged on AI data-center storage demand optimism; NAND market tightening narrative directly benefits Sandisk’s flash portfolio |
| KLA Corp | KLAC | $2,011.39 | +6.51% | Semiconductor equipment maker benefited from AI capex expansion narrative; wafer inspection/metrology demand rises when memory fabs scale for AI |
| Analog Devices | ADI | $419.94 | +5.76% | Analog semiconductor exposure to AI infrastructure and industrial automation; rode the broader semiconductor sector re-rating triggered by UBS/MU upgrade |
DECLINERS
| Company | Ticker | Close | Change | Why It Moved |
|---|---|---|---|---|
| Philip Morris International | PM | $181.53 | -3.95% | European Commission initiated formal Call for Evidence to revise tobacco control framework, threatening novel nicotine products with tighter restrictions by Q4 2026; defensive rotation compounded the selloff |
| Chevron | CVX | $184.71 | -3.51% | Energy majors de-rated as US-Iran framework discussions signal potential Iranian crude re-entry through Hormuz; market pricing future supply competition, not today’s spot price |
| Exxon Mobil | XOM | $149.81 | -3.30% | Same Hormuz/Iran supply re-entry dynamics as CVX; integrated US oil majors face largest valuation headwind from any Iranian production normalization scenario |
| UnitedHealth Group | UNH | $376.86 | -2.99% | Healthcare sector rotation on risk-on day; Berkshire Hathaway complete stake exit (disclosed May 15) continues to weigh on sentiment; UNH remains a structural YTD underperformer (-3.02%) |
| Costco Wholesale | COST | $1,002.93 | -2.46% | Consumer defensive rotation out of safety stocks as risk appetite surged; Consumer Defensive sector -1.44% on the day; COST retreated from the $1,000+ level amid sector-wide pressure |
— Institutional-grade intelligence for serious investors. Apply for membership at join.recessionalert.comC. HIGH-IMPACT STORIES -> TOP
BULLISH
1. Micron Crosses $1 Trillion as UBS Triples Price Target to $1,625 — AI Memory Demand Triggers Largest Semiconductor Re-Rating in Years; SOX +5%, Nasdaq Record 26,656
The core facts:UBS analyst Timothy Arcuri raised Micron’s price target from $535 to $1,625 — a 204% increase and the new Street-high — citing structural AI-driven transformation of the memory industry. MU surged +19.29%, pushing its market capitalization above $1 trillion for the first time. The upgrade rested on three convictions: Micron’s entire HBM4 (High Bandwidth Memory 4) capacity is sold out through year-end 2026; long-term agreements with hyperscalers including Microsoft Azure, Google Cloud, and Amazon AWS are locking in multi-year contracted pricing; and the DRAM industry is expected to remain structurally undersupplied until at least Q2 2028. UBS projects Micron will generate over $400 billion in free cash flow through 2029. The move sparked a sector-wide rally: PHLX SOX +5%, Roundhill DRAM ETF +15%, AMD +7.8%, KLAC +6.5%, SNDK +7.5%, ADI +5.8%. Marvell Technology (MRVL) surged over 10% on AI sympathy ahead of Wednesday earnings. The Nasdaq Composite set a new all-time record high of 26,656.18 (+1.19%); the S&P 500 closed at a record 7,519.12 (+0.61%).
Why it matters:The UBS upgrade is the most consequential analyst-driven semiconductor re-rating since the 2024 AI capex inflection. Three portfolio-level implications: (1) The LTA-lock mechanism signals that memory semiconductors have transitioned from commodity to contracted infrastructure economics — a structural shift that eliminates cyclical trough risk and permanently re-rates the group’s forward multiple; (2) Micron’s status as the only major US-domiciled memory manufacturer at scale creates a national strategic moat aligned with DoD and CHIPS Act priorities, reducing regulatory headwind risk that weighs on foreign peers; (3) HBM4 sold out through 2026 confirms that hyperscaler AI hardware investment is accelerating, not plateauing — the most critical concern for the AI trade since Q1 2025. For broad equity portfolios, the SOX +5% combined with Nasdaq record narrows the risk premium on tech at current multiples, while the Dow’s simultaneous -0.23% decline illustrates the ongoing rotation out of defensive industrials into growth technology.
What to watch:Micron’s next earnings call for HBM4/HBM5 pricing and 2027 LTA expansion signals; hyperscaler capex guidance revisions from Microsoft Azure and Google Cloud in late-July earnings; SOX index behavior for whether the re-rating broadens into mid-cap semis or fades as a single-name event.
UNCERTAIN
2. US Airstrikes on Iran IRGC Targets in Hormuz — Brent Crude Surges to $99.50; Ceasefire Accused of Breach, Peace Deal Timeline Imperiled
The core facts:US Central Command confirmed overnight (May 25–26) precision airstrikes targeting IRGC missile launch facilities near Bandar Abbas and mine-laying vessels attempting to place sea mines in international shipping corridors in the Strait of Hormuz — described as “necessary measures of self-defense.” Iran’s Foreign Ministry accused the US of a “flagrant violation” of the April 8 ceasefire; the IRGC reserved the right to retaliate. Brent crude surged +3.6% to close near $99.50/barrel — approaching the critical $100 threshold. WTI fell -2.8% to $93.89, catching up to the global selloff during the US Memorial Day holiday on Monday. The Strait of Hormuz — through which approximately one-fifth of global oil supply transits daily — remains closed. Oil has risen approximately 39% since mid-2025; the national average gasoline price is now $4.56/gallon, a four-year high. Hopes for a rapid peace deal and Hormuz reopening were materially dampened. The 10-year Treasury yield retreated below 4.50% as flight-to-safety demand partially offset the inflation implications.
Why it matters:The airstrikes represent a significant escalation that puts the ceasefire framework at direct risk. Three transmission channels for US portfolios: (1) Brent sustaining near $100 — up +3.6% today alone — feeds directly into the inflation persistence driving the Fed’s hawkish pivot; every sustained $10/barrel increase in Brent adds approximately 25–30 bps to headline CPI through gasoline and shipping costs, compounding the extreme UMich five-year inflation expectations of 3.9% recorded last Friday; (2) Hormuz remaining closed embeds a structural insurance premium into all internationally-traded crude — $100+ Brent forces corporate margin compression across the S&P 500 for any company with energy-intensive operations or global logistics; (3) The ceasefire breach accusation elevates regime-change and broader escalation scenarios the market had not fully priced, creating equity tail-risk premium not yet fully visible in volatility surfaces. The 10-year yield’s decline below 4.50% (flight-to-safety) conflicting with inflation implications illustrates the market’s conflicted assessment — not yet panic, but no longer pricing near-term resolution.
What to watch:Iran’s formal retaliation decision and CENTCOM’s response posture; Brent for a confirmed close above $100 as the threshold forcing Fed acknowledgment of an externally-driven inflation shock; Omani or Qatari diplomatic intervention as the most likely ceasefire reset pathway.
BEARISH
3. Energy Sector Worst Performer as CVX -3.5%, XOM -3.3% Fall on Brent Surge — Market Prices Post-Deal Supply Glut Over War Premium
The core facts:The Energy sector fell -2.31% on Tuesday — the day’s worst-performing sector — on a day when Brent crude surged +3.6% to near $100/barrel. Chevron (CVX, ~$280B market cap) fell -3.5%; Exxon Mobil (XOM, ~$460B market cap) fell -3.3%. The Brent-WTI spread widened sharply, with WTI falling -2.8% to $93.89 (catching up to the Memorial Day global session) while Brent surged on the Hormuz geopolitical premium. The divergence reflects two simultaneous market pricing mechanisms: energy equities are pricing a forward scenario where eventual ceasefire and Hormuz reopening brings Iranian crude back into global supply — compressing US oil major margins — while Brent prices the current supply disruption premium.
Why it matters:The energy sector’s decline while spot crude rallied is one of the market’s clearest forward-pricing signals of 2026. US oil majors (XOM, CVX) generate returns on long-cycle assets whose value depends on sustainable mid-cycle oil prices — consensus planning range $65–$75/barrel — not crisis-level spikes expected to mean-revert. The market is simultaneously pricing: (1) near-term Brent spike ($99.50 = war premium) as TEMPORARY, and (2) post-resolution supply glut from Iranian crude re-entry (Iran produced ~3.8mbpd pre-conflict; even partial re-entry adds 1–2mbpd to global supply) as DURABLE margin pressure. The -2.31% sector move on an oil spike day is a leading indicator of sector rotation risk — when energy equities diverge this sharply from their underlying commodity, the market is pricing an exit from the conflict premium, not a deepening of it. Portfolio managers holding energy names as an Iran hedge should note this divergence: the hedge may be less effective than the commodity exposure implies.
What to watch:XOM and CVX Q2 guidance and hedging disclosure for how much of the Brent spike is being captured vs. locked out by prior hedges; WTI-Brent spread normalization as a signal that the geopolitical premium is narrowing; any formal ceasefire extension announcement that would trigger additional energy equity selling.
UNCERTAIN
4. US-China Establish “Board of Trade” — USTR to Seek Public Comment on $30B Tariff Cut Package; Consumer Relief Process Launched
The core facts:US Trade Representative Jamieson Greer announced Tuesday that the government will formally seek public comment on which Chinese goods should be eligible for tariff cuts. The announcement follows a bilateral US-China agreement to establish a joint “Board of Trade” to identify approximately $30 billion of non-strategic consumer goods on which both countries can lower or eliminate tariffs. A formal public notice will be issued shortly. Targeted categories include consumer electronics, apparel, footwear, and household goods — sectors where existing tariffs of 7.5%–25% have been most regressive on US consumers, particularly lower-income households. The process is explicitly limited to non-strategic goods, excluding technology, defense-adjacent, and semiconductor supply chains.
Why it matters:The tariff cut process is a meaningful policy signal at a moment when US consumer confidence is deteriorating and inflation is at three-year highs driven by both Iran-related energy costs and accumulated trade policy. Three market implications: (1) The $30B non-strategic goods scope targets consumer-facing categories — any tariff relief in electronics, apparel, and household goods would directly reduce CPI components and ease the most visible consumer pain points at a time when two-thirds of CB respondents report cutting spending due to rising prices; (2) The “public comment” mechanism is procedural and reversible — this is the beginning of a process, not a decision, which limits immediate market impact but signals a policy directional shift that reduces worst-case tariff escalation scenarios for H2 2026; (3) The “Board of Trade” institutionalization represents the first structured US-China bilateral trade framework in years — a de-escalation signal that matters for global supply chain planning even if the immediate tariff impact is modest. Consumer Discretionary, retail (WMT, AMZN supply chains), and consumer electronics importers are the primary beneficiaries of any eventual tariff relief outcome.
What to watch:Formal public comment notice for the specific goods categories and tariff levels proposed; the Board of Trade’s first meeting timeline and whether it expands its scope beyond the initial $30B; any Chinese government counter-concessions tied to the tariff relief package.
BULLISH
5. SpaceX Receives FTSE Russell Fast-Entry Eligibility — $1.75 Trillion IPO to Enter Russell 1000, FTSE All-World; Forced Passive Buying Estimated at Tens of Billions
The core facts:FTSE Russell announced Tuesday that SpaceX appears eligible for fast-track inclusion in the Russell US Equity Indexes and FTSE Global Equity Index Series following the company’s May 20 public S-1 IPO filing. SpaceX is expected to qualify for the Russell Top 50, Russell Top 200, Russell 1000, FTSE All-World, and FTSE World Index under newly adopted IPO fast-entry rules. SpaceX’s IPO targets a valuation of $1.75 trillion. The company reported 2025 revenue of $18.7 billion and adjusted EBITDA of $6.6 billion; Q1 2026 revenue was $4.7 billion with EBITDA of $1.1 billion. Passive fund analysis estimates that index-mandated buying would require acquiring approximately 19% of SpaceX’s public float — representing tens of billions of dollars in institutionally mandated demand on or around listing. Nasdaq listing is expected as early as June 2026. The space and satellite sector rallied broadly on the news.
Why it matters:SpaceX’s FTSE Russell eligibility is a structural institutional event with three distinct implications: (1) The forced passive buying mechanism — 19% of float mandated by Russell 1000 and FTSE AUM benchmarking — creates an institutional bid that is disconnected from fundamental valuation and provides a structural floor at IPO; at $1.75T, this is the largest single mechanical index-entry demand event in equity market history; (2) SpaceX immediately becomes a top-10 global company by market capitalization upon listing — altering sector weights across multiple indexes and forcing rebalancing in portfolios benchmarked to Russell and FTSE indices; the cross-sector classification complexity (defense, aerospace, broadband, commercial launch) will generate significant active portfolio adjustment; (3) For existing space and satellite names, SpaceX’s institutional legitimacy validates the entire sector’s growth narrative while simultaneously introducing the most formidable competitor — today’s rally in sector names reflects the “rising tide” co-optation premium that precedes large-cap additions in growth themes.
What to watch:SpaceX’s Nasdaq listing date and IPO pricing for the actual index inclusion timeline; Russell Index reconstitution calendar for earliest addition date; passive fund AUM benchmarked to affected indexes for magnitude of forced buying; and FTSE Russell’s final eligibility confirmation vs. the current preliminary “appears eligible” language.
— Quantifying recession risk so you don’t have to guess. Apply for membership at join.recessionalert.comD. MODERATE-IMPACT STORIES -> TOP
BEARISH
6. Conference Board Confidence 93.1 Misses Trend — Two-Thirds of Consumers Cutting Spending as Iran-Driven Inflation Bites
The core facts:The Conference Board Consumer Confidence Index for May 2026 printed at 93.1, slightly beating the 91.9 estimate but declining from April’s 93.8. The headline beat masked sharp underlying deterioration: the Present Situation Index fell 3.2 points to 121.2; only 18.5% of respondents said business conditions were “good,” down from 22.3%; and two-thirds of consumers reported actively cutting spending due to rising prices. CB Chief Economist Dana Peterson cited Middle East-driven inflation — particularly gasoline prices and food costs — as the primary driver. Data detail is covered in Section E.
Why it matters:The headline beat masks the operationally important signal: behavioral spending response. Two-thirds of consumers actively cutting spending is a direct earnings risk for Consumer Discretionary, Consumer Staples premium segments, and any retailer dependent on discretionary purchase frequency. Three market implications: (1) WMT’s fuel behavior data (sub-10 gallon fills) and today’s CB two-thirds-cutting-spending finding are converging on the same conclusion — lower-income consumer spending is contracting faster than headline confidence suggests; (2) The Present Situation drop (-3.2 pts) against a marginal expectations beat indicates the consumer sees today’s conditions deteriorating while remaining slightly more sanguine about the future — this pattern has historically resolved toward Present Situation’s direction (down), not the Expectations’ optimism; (3) For the Fed, the CB data compounds UMich’s all-time record low of 44.8 and the GDPNow 4.3% divergence — the real economy may be tracking well on hard data while sentiment-driven spending pullback builds in the background, a gap that closes abruptly.
What to watch:June Conference Board Consumer Confidence for whether the Present Situation slide continues; June retail sales for first hard-data confirmation that spending cuts are transmitting to register-level consumption.
BEARISH
7. Case-Shiller Home Prices March +0.7% YoY — Tenth Consecutive Month of Negative Real Returns; Over Half of Major Metros Now Declining
The core facts:The S&P Case-Shiller National Home Price Index for March 2026 rose +0.7% year-over-year, missing the 1.0% consensus estimate. This marks the 10th consecutive month of negative real home price returns — prices rising slower than inflation. More than half of major US metropolitan areas are now declining in nominal home prices year-over-year. The 30-year fixed mortgage rate had rebounded to 6.4% by end-March. Data detail in Section E.
Why it matters:Housing is the largest single asset class in US household wealth, and 10 consecutive months of negative real returns represent sustained wealth destruction only beginning to transmit into consumer behavior. Three sector implications: (1) Homebuilders (DHI, LEN, NVR) face double pressure — demand weakness from affordability constraints (6.4% 30Y rate) and now price reversion risk precisely as the spring selling season should be delivering peak demand; (2) Mortgage REITs face book value compression as underlying asset values decline on portfolios locked to earlier-vintage loans; (3) The housing slowdown, if it accelerates, provides the Fed a cyclical argument for rate relief — but PCE at 3.8% and Brent near $100 make cuts politically and economically impossible under the new Warsh framework. Housing is caught between rate sensitivity and inflation reality, with no near-term release valve.
What to watch:April Case-Shiller (released late June) for whether the YoY deceleration trend continues into outright nominal declines; homebuilder Q2 earnings (July) for order cancellation rates and incentive levels as the definitive spring-season read.
BEARISH
8. Dallas Fed Manufacturing May — Capacity Utilization Plunges 15 Points; Input Costs at 8-Month High as Hormuz Supply Shock Transmits to Factory Floor
The core facts:The Dallas Fed Manufacturing Survey for May 2026 printed a near-flat headline of +0.4, masking sharp internal divergence. Capacity utilization plunged 15 points in one month — the largest single-month drop since the pandemic. The Raw Materials Prices index surged to 42.7, an 8-month high, driven by energy and transportation cost pass-through from the Hormuz supply shock. Data detail in Section E.
Why it matters:The Dallas Fed’s May reading captures the first major manufacturing sentiment survey to fully incorporate the Iran-Hormuz supply shock — and the stagflation signature is explicit: output near-stagnant while input costs accelerate to multi-month highs. Three implications: (1) Capacity utilization plunging 15 points while orders remain neutral indicates manufacturers are throttling production in anticipation of demand weakness — not yet laying off but reducing operational intensity; this is the precursor pattern to industrial earnings guidance cuts in Q2 reports due in July; (2) The raw materials price surge to 42.7 is directly traceable to energy and logistics cost transmission — each additional week of Brent above $95 extends and deepens this cost pressure into Q3; (3) For the Fed, manufacturing stagflation — stagnant output plus rising input costs — eliminates the “supply-side improvement” thesis that had provided breathing room earlier in 2026. Industrials, materials, and energy-intensive manufacturers face direct margin compression in upcoming Q2 guidance.
What to watch:ISM Manufacturing PMI (released June 2) for national confirmation of the Dallas regional stagflation pattern; any Hormuz-related logistics cost data for the magnitude of energy-price pass-through into manufacturing input prices.
BEARISH
9. Philip Morris -3% — EU Launches Formal “Call for Evidence” on Heated Tobacco and Nicotine Pouches; CFO Succession Adds Execution Risk
The core facts:Philip Morris International (PM) fell approximately -3% on Tuesday on two converging headwinds. The European Commission initiated a formal “Call for Evidence” to revise its tobacco control framework, with proposed tighter restrictions on novel nicotine products — including heated tobacco (iQOS, IQOS ILUMA) and nicotine pouches — expected to be formalized by Q4 2026. Proposed controls include restrictions on flavors, packaging, and digital advertising for PM’s smoke-free portfolio. Separately, the company disclosed a Group CFO succession effective August 1, 2026.
Why it matters:The smoke-free portfolio — iQOS and heated tobacco units — is Philip Morris’s primary growth engine and the central thesis for its premium valuation versus legacy tobacco peers. Three risks now arrive simultaneously: (1) EU restrictions on heated tobacco and pouch products strike the fastest-growing revenue segment in PM’s most profitable markets — the EU represents PM’s largest geographic exposure by volume and margin, and any flavor restriction or advertising prohibition would reduce both product mix quality and category trial rates; (2) The Q4 2026 regulatory timeline is compressed — product reformulation, flavor removals, and advertising restrictions would pressure revenue before countermeasures can be developed; (3) CFO succession during an active regulatory response period introduces execution risk at C-suite level precisely when strategic consistency is most critical. The read-through for BAT and the broader novel nicotine sector is modestly negative — the EU regulatory framework sets precedent across jurisdictions that are likely to follow.
What to watch:EC’s formal proposal language and scope definition for heated tobacco and pouch restrictions, particularly on flavors and advertising; PM’s Q2 earnings for any management guidance update on EU regulatory impact; PM investor day for smoke-free strategy update under the new CFO and regulatory environment.
BULLISH
10. Marvell Technology Surges +10% on AI Memory Sympathy Trade — Wednesday Earnings Bar Now Elevated; Hyperscaler Custom XPU in Focus
The core facts:Marvell Technology (MRVL, $182.34B market cap) surged over +10% on Tuesday, driven primarily by sympathy buying following Micron’s record-breaking UBS upgrade and the broader AI semiconductor re-rating. The move was anticipatory — MRVL reports earnings after market close on Wednesday, May 27. Consensus expectations stand at $0.80 non-GAAP EPS and $2.41B revenue. The stock is pricing in a strong AI custom silicon and data networking revenue cycle, with investors front-running expectations that Micron’s structural demand signals will validate MRVL’s own hyperscaler engagement trajectory. Key earnings focus: NVLink Fusion partnership execution, 800G/1.6T optical interconnect ramp, and new custom XPU program disclosures.
Why it matters:The 10% pre-earnings sympathy move captures a key institutional behavior: when a major industry data point validates the AI demand thesis, capital repositions immediately into the next reporting company with the same thematic exposure. Three implications: (1) The pre-earnings move has materially elevated MRVL’s bar — Wednesday’s print must confirm hyperscaler AI custom XPU demand acceleration, not merely solid results; any guidance miss or cautious commentary on custom program timelines would retrace the 10% move rapidly; (2) MRVL’s NVLink Fusion partnership and custom ASIC design wins with hyperscalers are the differentiated story Micron’s memory upgrade does not directly validate — management must articulate why MRVL’s AI revenue trajectory is additive to, not merely correlated with, the HBM demand cycle; (3) A strong MRVL confirmation Wednesday would extend the semiconductor rally from memory into application-specific silicon, broadening the AI infrastructure trade’s investable universe and potentially driving another leg in the SOX.
What to watch:MRVL’s Q1 FY2027 revenue guidance vs. the $2.41B consensus; any new hyperscaler engagement or custom XPU program announcements on the earnings call; post-earnings reaction for whether the pre-earnings 10% move proved justified or needs to retrace.
— Separating signal from noise since 2007. Apply for membership at join.recessionalert.comE. ECONOMY WATCH -> TOP
The week opened with a sharp re-escalation: overnight US strikes against IRGC mine-laying vessels pushed Brent crude back toward $100/barrel ($99.50 close), jeopardising the tentative Iran peace deal and anchoring the inflation ceiling. Consumer data confirmed the squeeze already accumulating — CB Consumer Confidence dipped to 93.1 in May (beat the 91.9 estimate, but two-thirds of consumers are cutting spending due to rising prices), while Case-Shiller posted its 10th consecutive month of negative real home price returns (0.7% nominal YoY vs. CPI running ~2.6pp above). Against those headwinds, the Chicago Fed CFNAI rebounded to +0.14 in April (strongest since March 2025) and Dallas Fed manufacturing returned to fractional positive — activity hasn’t rolled over, but raw materials prices in Texas just hit an 8-month high. Thursday’s triple release — Q1 GDP second estimate, Core PCE for April, and weekly jobless claims — is the week’s decisive test for the Fed’s hold-at-current-rates posture.
Oil Surges Toward $100/Barrel as Fresh US Strikes on Iran Jeopardise Peace Deal; Gas at $4.56/Gal — 4-Year High (CNBC / CENTCOM, May 26, 2026)
What they’re saying:Brent crude surged back toward $100/barrel — touching $100 intraday and closing near $99.50 — after US Central Command confirmed precision airstrikes against IRGC mine-laying vessels in southern Iran in the overnight hours of May 25-26. Iran’s Revolutionary Guard reserved the right to retaliate, casting doubt on the fragile ceasefire framework. The national average gasoline price stands at $4.56/gal, the highest in four years. Oil has risen from approximately $72/barrel in mid-2025 to near $100 today — a ~39% shock over twelve months.
The context:Each 20% increase in crude prices adds approximately 0.3pp to US headline inflation; the cumulative ~39% rise since mid-2025 is already estimated to be suppressing consumer spending growth by more than 1pp annually. Today’s Conference Board data confirmed the transmission is live: two-thirds of consumers report cutting back on spending due to rising prices. If sustained at current levels, consumer spending growth could fall below 1% versus the previously projected 2.1% — a GDP-level risk. The Strait of Hormuz, which handles ~35% of global seaborne crude, remains the key variable: a permanent reopening would relieve the supply constraint, but the overnight strikes have put that timeline in question.
What to watch:Iranian retaliation response and ceasefire status; Strait of Hormuz shipping corridor developments; Thursday’s Core PCE (Apr, expected +3.3% YoY) for the Fed’s preferred inflation read; June OPEC+ production decisions.
CB Consumer Confidence Edges Down to 93.1 in May, Beats 91.9 Estimate; Two-Thirds of Consumers Cutting Spending on Rising Prices (Conference Board, May 26, 2026)
What they’re saying:The Conference Board Consumer Confidence Index fell 0.7 points to 93.1 in May, from an upwardly revised 93.8 in April, but beat the consensus estimate of 91.9. The internal split is notable: the Present Situation Index fell 3.2 points to 121.2, while the Expectations Index rose 1.0 point to 74.4. Only 18.5% of respondents rated business conditions as “good,” down from 22.3% in April. Survey Chief Economist Dana Peterson attributed the deterioration to “the inflationary impacts of the war in the Middle East intensifying.”
The context:The headline beat offers limited comfort against the underlying demand destruction signal: a two-thirds cut-back rate on consumer spending is an unusually elevated reading that portends weakening retail sales and subdued PCE. The CB survey, which focuses more on present labor conditions, is running sharply above the University of Michigan’s record-low reading of 44.8 (published May 22) — the divergence reflects that Michigan weights future inflation expectations more heavily, where the survey period captured peak anxiety over Middle East energy prices. Either way, both surveys confirm that pricing pressure has crossed a threshold from concern to behavioural change.
What to watch:Thursday’s Personal Spending MoM (Apr, expected +0.5% vs. +0.9% prior) for early evidence of the spending pullback; ADP Employment Change (Wednesday May 27); June CB Consumer Confidence.
Case-Shiller National Home Price Index Slows to 0.7% YoY in March, Misses 1% Estimate; Real Returns Negative for 10th Consecutive Month (S&P Cotality, May 26, 2026)
What they’re saying:The S&P Cotality Case-Shiller US National Home Price Index rose 0.7% year-over-year in March 2026, down from 0.8% in February and below the 1.0% consensus estimate. The 20-city composite gained 0.8% YoY and the 10-city composite 1.4%. More than half of major US metropolitan markets posted year-over-year price declines in March; Seattle was the weakest market at -2.5% and Chicago the strongest at +6.1%.
The context:March marked the 10th consecutive month in which CPI inflation outpaced national home price appreciation — with March CPI running approximately 2.6 percentage points above the 0.7% nominal home price gain, homeowners are experiencing persistent real wealth erosion. The affordability squeeze is compounded from the supply side: 30-year fixed mortgage rates, which had briefly dipped below 6% in late February, rebounded to approximately 6.4% by end-March as geopolitical risk reasserted itself — re-intensifying the rate lock-in effect that continues to suppress transaction volumes and constrain housing’s contribution to GDP growth.
What to watch:New Home Sales for April (Thursday May 28, expected 0.67M vs. 0.682M prior); 30-year fixed mortgage rate trajectory vs. Thursday’s PCE print; Building Permits Final (Thursday May 28).
Dallas Fed Manufacturing Returns to Positive Territory in May (0.4 vs. -2.3 in April), But Capacity Utilisation Plunges 15 Points and Raw Materials Prices Hit 8-Month High (Dallas Fed, May 26, 2026)
What they’re saying:The Dallas Fed Texas Manufacturing Outlook Survey general business activity index returned to positive territory at 0.4 in May, up from -2.3 in April. However, the headline rebound masked significant deterioration in key sub-indices: production fell 10 points to 9.4, capacity utilisation plunged 15 points to 5.2, and new orders slipped 4 points to 6.4. The employment index held near zero (0.2). Most notably, the raw materials prices index surged to 42.7, its highest reading in eight months. The company outlook index fell to 0.3 (from 3.0) and the outlook uncertainty index rose to 19.2, above its series average of 16.9.
The context:The raw materials surge — now at an 8-month high — directly reflects the Middle East oil shock feeding through to Texas manufacturers’ input costs. The 15-point collapse in capacity utilisation, despite a technically positive headline, is consistent with a post-tariff front-running dynamic: firms that built inventories ahead of tariff deadlines are now running below capacity while working through that stock. The near-stall in the company outlook index (0.3 from 3.0) and above-average uncertainty index suggest that even in Texas’s manufacturing heartland, confidence in the forward path has largely evaporated. The future general business activity index of 14.3 preserves a modest optimism bias but is difficult to reconcile with the current capacity and orders data.
What to watch:Richmond Fed Manufacturing (Wednesday May 27); national Durable Goods Orders MoM for April (Thursday May 28); ISM Manufacturing (Monday June 2).
Chicago Fed National Activity Index Rebounds to +0.14 in April, Strongest Reading Since March 2025, Driven by Production Recovery (Chicago Fed, May 26, 2026)
What they’re saying:The Chicago Fed National Activity Index (CFNAI) rose to +0.14 in April from a revised -0.15 in March, its strongest reading since March 2025. Production-related indicators drove the rebound, contributing +0.18 (up from -0.13 in March). Sales, orders, and inventories added +0.02. Employment indicators subtracted -0.02 and personal consumption and housing detracted -0.04. The 3-month moving average edged up to +0.03 from +0.02, signalling slightly above-trend growth.
The context:The CFNAI aggregates 85 national economic indicators; a reading above zero indicates above-trend growth, while a 3-month average below -0.70 signals elevated recession risk. At +0.14, April’s reading confirms the economy remained comfortably above recession thresholds, consistent with Atlanta Fed GDPNow’s Q2 estimate of 4.3%. The production-led rebound aligns with AI-infrastructure capital spending and tariff-driven inventory builds — but the persistent drag from housing and consumption (-0.04) reflects the energy price squeeze on real incomes. The 3-month average of +0.03 signals the trend is intact but modest; the CFNAI is not yet flashing expansion-level pressure (+0.70 threshold), leaving the Fed’s hold-and-watch posture well-supported by the data.
What to watch:Thursday’s Q1 GDP second estimate (expected 2.0% SAAR, prior 0.5%); May CFNAI released approximately June 23; ISM Manufacturing (Monday June 2).
— Know the probability before the market prices in the risk. Apply for membership at join.recessionalert.comF. EARNINGS WATCH -> TOP
YESTERDAY AFTER THE BELL (Markets Reacted Today)
No major earnings yesterday after the bell from companies with >$100B market cap.
TODAY BEFORE THE BELL (Markets Already Reacted)
No major earnings before the bell from companies with >$100B market cap. (AutoZone and Elbit Systems reported BMO but both carry market caps below the $100B inclusion threshold.)
TODAY AFTER THE BELL (Markets React Tomorrow)
No major earnings after the bell from companies with >$100B market cap.
WEEK AHEAD PREVIEW:
Q1 2026 earnings season is functionally complete (~92% of S&P 500 reported). The final cluster of notable reporters arrives Wednesday in a compressed after-market schedule driven by AI and enterprise software themes — all three are AMC.
Marvell Technology (MRVL) — AMC Wednesday, May 27 — +10.00% today — Consensus $0.80 non-GAAP EPS, $2.41B revenue. Key focus: custom AI XPU demand validation following Micron’s structural upgrade; NVLink Fusion partnership execution milestones; 800G/1.6T optical interconnect ramp cadence. Today’s 10% sympathy rally has elevated the bar — any guidance miss will retrace sharply.
Salesforce (CRM) — AMC Wednesday, May 27 — Consensus $3.13 non-GAAP EPS, $11.05B revenue. Key focus: Agentforce AI agent platform adoption metrics and enterprise attach rates; Q2 FY2027 revenue guidance as the proxy for enterprise software spending durability; operating margin expansion vs. Agentforce investment cost.
Synopsys (SNPS) — AMC Wednesday, May 27 — Consensus $3.15 non-GAAP EPS, $2.25B revenue. Key focus: Ansys integration progress and synergy realization timeline; EDA tool demand from semiconductor design complexity growth; full-year $9.61B revenue guidance confirmation in the face of any macro softness.
Q2 2026 earnings season begins mid-July. No further major reporters expected this week beyond Wednesday’s AMC cluster.
— US market commentary trusted by family offices and institutions. Apply for membership at join.recessionalert.comG. WHAT’S NEXT -> TOP
UPCOMING RELEASES:
| Date | Event | Why It Matters |
|---|---|---|
| Wed, May 27 | ADP Employment Change (prior 42.25K) | Labor market leading indicator ahead of Friday’s jobs report; a sharp deceleration would add to the consumer stress narrative building from CB confidence and spending data |
| Wed, May 27 | Richmond Fed Manufacturing Index (prior 4) | Second regional manufacturing survey this week; Dallas Fed’s stagflation print (capacity utilization -15 pts, input costs 8-month high) sets a bearish baseline — confirmation from Richmond would signal the regional pattern is national |
| Wed, May 27 | Fed Logan, Cook & Jefferson Speeches | Three Fed officials speaking on the same day — any commentary on the Iran-driven oil shock, inflation persistence, or the timeline to cuts will be parsed intensely; markets are watching for whether the FOMC is shifting to an “externally-driven inflation” framing that could open a path to cuts |
| Thu, May 28 | GDP Q1 2nd Estimate (exp. 2.0%, prior 0.5%) | The revision from 0.5% to 2.0% (expected) would reflect updated trade and inventory data stripping out the tariff-driven import surge that suppressed Q1’s advance estimate; the final read on the pre-Iran economy — a clean baseline for measuring the Hormuz shock’s Q2 impact |
| Thu, May 28 | Core PCE YoY Apr (exp. +3.3%) & PCE YoY Apr (exp. +3.8%) | The Fed’s preferred inflation gauge; +3.3% Core would be a fresh multi-year high and the defining data point for the June FOMC meeting — any upside surprise with Brent near $100 makes cuts structurally impossible through Q3; a downside miss would be the first dovish opening since January |
| Thu, May 28 | Personal Spending MoM Apr (exp. +0.5%, prior +0.9%) & Personal Income MoM Apr (exp. +0.4%, prior +0.6%) | The hard-data confirmation of the CB two-thirds-cutting-spending signal; a spending deceleration from +0.9% to +0.5% or below would confirm that energy inflation has crossed the threshold from concern to behavioral change — the most direct GDP risk for Q2 |
| Thu, May 28 | Durable Goods Orders MoM Apr (prior +3.5%) | Business investment proxy; the Dallas Fed’s capacity utilization collapse and uncertainty spike suggest front-running demand has faded — a sharp deceleration from the prior +3.5% would confirm that capex is turning with a lag from the Iran shock |
| Thu, May 28 | Initial Jobless Claims week May 23 (exp. 211K, prior 209K) | Labor market real-time read; any spike above 225K would be the first concrete sign that Hormuz-related corporate caution is transmitting to layoffs — the Fed’s most politically sensitive data point |
| Thu, May 28 | New Home Sales Apr (exp. 0.67M, prior 0.682M) & Building Permits Final Apr (prior 1.363M) | Housing data against a backdrop of a 10th consecutive month of negative real home price returns (Case-Shiller); a miss would deepen the housing drag on GDP and reinforce the wealth-effect headwind for consumer spending |
| Thu, May 28 | Fed Williams Speech (8:55 AM) | NY Fed President Williams is the Fed’s most closely watched FOMC voter; any signal about the Brent/$100 threshold’s implications for the inflation path will move rates markets — especially with PCE printing the same morning |
KEY QUESTIONS:
1. Does the Iran ceasefire hold after overnight US airstrikes on IRGC targets, or does Iranian retaliation force Brent through $100 — triggering Fed acknowledgment of an externally-driven inflation shock and materially repricing rate-cut timelines?
2. Will Thursday’s Core PCE (exp. +3.3% YoY) and Personal Spending (exp. +0.5% vs. +0.9% prior) confirm the stagflation signal building across Dallas Fed, CB confidence, and consumer survey data — locking in a Fed hold through Q3 and forcing a re-rating of rate-sensitive sectors?
3. Can Marvell’s Wednesday earnings confirm hyperscaler AI custom XPU demand acceleration and justify the pre-earnings +10% sympathy move — and if so, does the semiconductor rally broaden from memory (MU, HBM) into application-specific silicon, extending the AI infrastructure trade’s investable universe?
— US market commentary trusted by family offices and institutions. Apply for membership at join.recessionalert.comH. CHART OF THE DAY -> TOP
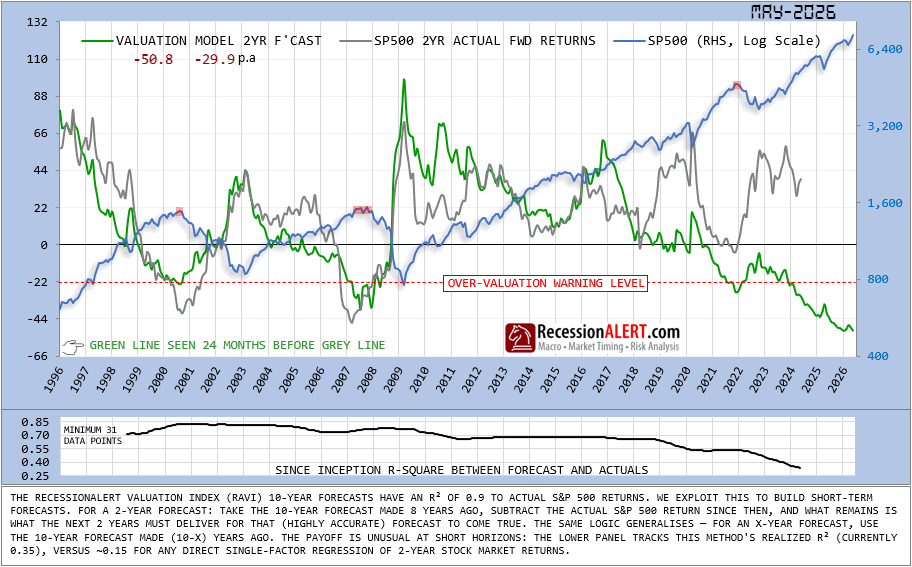
Three for three at -22 in 2000, 2007, January 2022 — each a coincident S&P peak, the first two followed by 45-55% drawdowns, the third by a credible 25% down payment before the market did what the prior episodes never did. It recovered, and kept going. The forecast did not relent. It deepened from roughly -30 in 2022 to -50.8 today, while the index it indicts climbed another third higher — four years below threshold, longer than 1999-2002, longer than 2007-2008, the longest unresolved warning in the series. The mechanism is arithmetic: a ten-year forecast made eight years ago minus what the S&P actually delivered since. Every dollar of rally above expectation deepens the implied giveback. The lower panel is the chart’s confession: R² has not decayed, it has stepped down from 0.80 toward 0.35 in discrete drops — the fingerprint of regime breaks, not aging math. Three trillion of Fed balance-sheet expansion, mega-cap earnings concentration hollowing the aggregate P/E, passive flows displacing the valuation-sensitive marginal buyer, the central-bank put priced rather than contingent: the math is intact, the market it was fit on is not. A manifestly bearish chart whose own R² counsels against acting on its depth — use it for what it now is, a tape-condition gauge, not a top-caller. Adjudication prints May 2028.
Market Intelligence Brief (MIB) Ver. 18.37
For professional investors only. Not investment advice.
© 2026 RecessionALERT.com

Comments are closed.