
MIB WEEKLY DIGEST
Week of May 18–22, 2026
Iran ceasefire optimism crashed WTI 5.7% to below $100 mid-week — lifting the Dow above 50,000 for the first time — but talks stalled Friday on uranium retention, keeping Brent above $100 and the IEA warning of a July–August supply “red zone.” The same Friday, Fed Governor Waller dropped the easing bias on Warsh’s swearing-in day as the 17th Fed Chair, with Polymarket pricing a 43% October hike probability. NVDA validated the AI supercycle (+85% revenue YoY, $81.6B) while QCOM surged +18% on the Stellantis automotive chip deal and IBM +16% on the CHIPS Act quantum foundry. Walmart’s guidance miss (—7.27%) and UMich’s all-time record low (44.8) confirmed the tariff-and-fuel squeeze is reaching corporate income statements.
TABLE OF CONTENTS
A. WEEK AT A GLANCE
B. WEEK IN MARKETS
C. WEEK’S TOP STORIES (8)
D. WEEK IN THE ECONOMY (5)
E. WEEK IN EARNINGS (3)
F. NEXT WEEK SETUP
G. CHART OF THE WEEK
A. WEEK AT A GLANCE -> TOP
The week produced the Dow’s first-ever close above 50,000 on Wednesday — driven by Iran ceasefire optimism that crashed WTI 5.7% to $98 and triggered simultaneous equity and bond rallies, the clearest disinflationary shock of 2026. Yet by Friday the week ended on a hawkish note: Governor Waller dropped the Fed’s easing bias, Warsh was sworn in as the 17th Fed Chair, and Polymarket priced a 43% October rate-hike probability — while University of Michigan final sentiment printed at 44.8, the lowest reading in the survey’s 74-year history. S&P 500 +0.88% WoW, Dow +2.13%, Russell 2000 +2.65% (led by yield-relief sessions), Technology +1.85% (masked NVDA’s —4.43% sell-the-news against QCOM/IBM/AMD/INTC each up 10–18%), Energy —0.14% as WTI fell —8.64%, Utilities +3.17% on the NextEra/Dominion AI power deal.
• Dow Jones 50,000: Historic first-ever close above 50,000 on Wednesday May 20 — driven by Iran ceasefire optimism (WTI —5.7%), AI earnings validation (NVDA beat), and broad cyclical rotation; week ended with Dow at record 50,579.70.
• 30-Year Treasury 5.198% (19-year high): Tuesday’s fiscal anxiety peak — Moody’s Aa1 downgrade backdrop, TIC data showing foreign official sellers (—$14.9B March), Treasury Q2 borrowing $79B above plan — drove the long end to its highest level since 2007.
• NVDA Q1 +85% YoY ($81.6B), AI demand saturation thesis removed: Data center $75.2B; Q2 guide ~$91B; $80B buyback — absorbed full China H20 headwind and beat by 5%+. Stock —4.43% WoW (4th post-earnings decline) as guidance missed the upper range of analyst estimates.
• WMT —7.27% on guidance miss (~$70B market cap lost): Q2/FY EPS below consensus; CEO explicitly cited tariffs and fuel as structural headwinds; sub-10 gallon fuel fills at Walmart stations observed for first time since 2022.
• QCOM +18.2% WoW — week’s top mega-cap gainer: Multi-year Stellantis Snapdragon automotive deal (millions of Jeep, Ram, Peugeot, Fiat vehicles; Level 2+ autonomy); aiMotive acquisition LOI; OpenAI AI agent chip partnership.
• UMich final 44.8 — all-time record low (survey began 1952): 5-year inflation expectations jumped 40 bps in one month to 3.9% — the de-anchoring signal that most constrains the Fed’s ability to look the other way and validates Waller’s Friday hawkish pivot.
• IBM +15.75% WoW on CHIPS Act quantum foundry “Anderon”: America’s first purpose-built quantum chip manufacturing facility; $2B total federal + private investment; counter-trend reversal from —14% YTD entering the week.
1. The Equity-Bond Paradox Sharpens — The Dow hit all-time records while the bond market priced a 43% October rate hike and UMich hit an all-time sentiment low on the same Friday — the widest divergence between equity confidence and economic fear since the 2022 inflation shock. Equity markets are pricing strong corporate earnings (NVDA +85%, TJX +17% EPS beat, GDPNow 4.3%). Bond markets are pricing the fiscal and monetary cost: Moody’s downgrade, foreign selling of Treasuries, Waller dropping cuts. These readings are temporarily consistent; they resolve when the cost of capital in bonds crosses into equity multiple compression — a level the 30Y’s 5.20% breach is approaching.
2. Consumer Stress Transitions From Survey to Income Statement — The week moved consumer weakness from UMich surveys into actual corporate guidance: Walmart’s explicit tariff-and-fuel attribution, Home Depot’s deferred-renovation signal, and observable checkout-level behavioral change (sub-10 gallon fuel fills). When the world’s largest retailer — with 90% US household penetration and conservative guidance history — formally guides lower and names the policy cause, buy-side models must incorporate a tariff demand-destruction assumption into forward PCE estimates. This is the week consumer stress became hard evidence.
3. AI Trade Matures: Supercycle Confirmed, Leadership Rotates — NVDA’s record $81.6B revenue removed the demand-saturation bear thesis for the AI infrastructure cycle. But NVDA itself —4.43% WoW while IBM, QCOM, AMD, and INTC each surged 10–18% tells the portfolio story: the AI trade is rotating from pure-play GPU concentration into industrial-policy (IBM quantum CHIPS Act), automotive AI (QCOM-Stellantis), and CPU infrastructure (INTC server sold-out). The broadening of the AI capex cycle from one stock into an ecosystem of beneficiaries is the defining portfolio reallocation of the week.
 — Leading economic indicators. Accurate market forecasts. Apply for membership at join.recessionalert.com
B. WEEK IN MARKETS -> TOP
The week was forged by two competing forces: Iran ceasefire optimism that crashed WTI 5.7% to $98 mid-week — lifting the Dow above 50,000 for the first time ever — and a hawkish Fed pivot that ended Friday with Governor Waller dropping the easing bias and Polymarket pricing a 43% October hike probability. The 30-year Treasury hit a 19-year high of 5.198% Tuesday before reversing sharply on Wednesday’s oil collapse; the 2Y finished +4.8 bps higher as the bear-flattening curve confirmed the front-end hawkish repricing. Breadth revealed the week’s architecture: Russell 2000 +2.65% outpaced S&P +0.88% on rate-relief sessions; Energy —0.14% gave back YTD leadership as WTI fell —8.64%; Technology +1.85% masked a QCOM/IBM/AMD surge against NVDA’s —4.43% sell-the-news. The defining divergence: Dow at all-time records while UMich sentiment hit its all-time low (44.8) on the same Friday — the equity-bond-sentiment paradox of 2026.
FRIDAY CLOSE & WEEK-ON-WEEK CHANGE — Fri, May 22, 2026:
MAJOR INDICES
No Market History Signals crossed threshold — DJIA/DJTA diverged by only 1.0% WoW (below the 2% Dow Theory trigger), NDX/S&P spread was 0.3% (below the 3% growth-vs-broad threshold), and RUT outpaced S&P by 1.8% (just below the 2% small-cap participation threshold). The week’s index moves were driven by a binary geopolitical event (Iran ceasefire mid-week) rather than sustained directional divergence. Dow +2.13% WoW was the week’s best major index on the historic 50,000 crossing; small-caps +2.65% outperformed on yield-relief sessions without establishing a durable breadth breakout.
| Index | Fri Close | WoW Change | WoW % | Why It Moved (Week) |
|---|---|---|---|---|
| S&P 500 | 7,473.45 | +64.95 | +0.88% | Three losing sessions Mon–Tue on 30Y spike and fiscal fears; reversed by Wednesday’s Iran oil crash (WTI —5.7%). NVDA’s $81.6B Q1 beat validated AI demand. Waller’s Friday easing-bias abandonment capped the advance. Net: Iran relief won narrowly over hawkish Fed repricing. |
| Dow Jones | 50,579.70 | +1,053.59 | +2.13% | Best major index WoW. Iran disinflation drove cyclical/industrial Dow components Wednesday (historic 50,000 crossing); IBM +12% Thursday (Dow component) added single-stock boost; QCOM-Stellantis automotive theme lifted Fri. Dow’s composition — cyclicals, industrials, financials — benefited disproportionately from the oil-crash relief. |
| DJ Transportation | 20,767.4 | +633.2 | +3.14% | Airlines surged Wednesday on WTI crashing to $98 (direct fuel-cost savings); IBM quantum and QCOM automotive themes lifted transport-adjacent names Thu–Fri. Made a new 10-session high Wednesday — Dow Theory bull confirmation extended all 5 sessions. |
| Nasdaq 100 | 29,481.64 | +356.44 | +1.22% | AI earnings wave (INTC +7.4%, AMD +8.1% Wed; IBM +12%, QCOM +11.6% Thu–Fri) partially offset by NVDA’s —4.43% sell-the-news and yield pressure on long-duration growth names Mon–Tue. Nasdaq underperformed the Dow all week — growth vs. cyclical rotation visible. |
| Russell 2000 | 2,868.78 | +74.03 | +2.65% | Second-best major index; domestic small-caps disproportionately benefited from mid-week yield collapse (—9.3 bps on 10Y Wednesday). Rate-sensitive leveraged balance sheets repriced on Iran-driven disinflation. Partially given back Thursday as 2Y reversed higher on Barkin/Waller hawkish signals. |
| NYSE Composite | 23,225.75 | +426.32 | +1.87% | Broad-market advance confirmed; energy, financial, and industrial names provided meaningful contribution alongside technology and healthcare. Breadth confirmed the rally extended well beyond mega-cap tech concentration. |
VOLATILITY & TREASURIES
The bear-flattening yield curve is the week’s defining fixed-income signal: 10Y fell 5 bps WoW (Iran oil-disinflation mid-week) while 2Y rose 4.8 bps (Waller drops easing bias Friday), compressing the 2Y–10Y spread from ~53 bps to ~43 bps. The intraweek swing was extreme — 30Y peaked at 5.198% (19-year high) Tuesday on Moody’s Aa1 downgrade and TIC sovereign-selling fiscal anxiety, then reversed sharply. Wednesday’s FOMC minutes confirmed a majority ready to hike — the most hawkish sequential Fed signal since 2022. VIX —9.3% WoW confirms Iran peace optimism dominated net sentiment over the policy hawkishness.
| Instrument | Fri Level | WoW Change | Why It Moved (Week) |
|---|---|---|---|
| VIX | 16.70 | –1.72 (–9.34%) | Peaked at 18.07 Tuesday (30Y at 19-yr high, 3rd straight equity loss); Wednesday’s Iran relief collapsed it; Waller’s Friday hawkish signal capped the decline. Net: fear subsided as Iran optimism outweighed hawkish Fed repricing. |
| 10-Year Treasury Yield | 4.551% | –5.0 bps | Extreme intraweek range: surged to 4.687% Tuesday (fiscal anxiety, Moody’s backdrop, 30Y at 5.198%), reversed —9.3 bps Wednesday on Iran oil crash. Held near 4.58% Thursday–Friday as Waller hawkish pivot offset oil disinflation. Net WoW modestly lower: Iran effect outpaced monetary hawkishness at the long end. |
| 2-Year Treasury Yield | 4.123% | +4.8 bps | Front end diverged from the long end by week’s end. Waller’s Friday easing-bias abandonment pushed the 2Y to February 2025 highs. The bear flattener confirms: markets removed near-term cut expectations while oil disinflation offered long-end relief — two separate drivers moving in opposite directions. |
| US Dollar Index (DXY) | 99.30 | +0.00 (0.00%) | Net flat: safe-haven bid (Mon–Tue, 10Y at 52-week high, VIX elevated) offset by Iran risk-on rotation Wednesday (USD softened) and Waller’s hawkish 2Y lift Friday (marginal bid). Competing forces canceled out; no clear directional signal from the dollar. |
COMMODITIES
Copper’s +1.70% WoW diverging from gold’s —0.79% and silver’s —0.70% is the week’s most precise commodity signal: this was not a safe-haven crisis but a growth-confidence rotation. The absence of a gold safe-haven bid despite genuine geopolitical stress (30Y at 5.198%, Moody’s downgrade, UMich all-time record low) confirms rising real yields (10Y above 4.5% all week) overwhelmed the geopolitical premium — same signal as the week of NVDA’s blowout and GDPNow tracking 4.3%. Bitcoin —3.93% tracked yield-sensitive risk assets; no inflation-hedge narrative emerged.
| Asset | Fri Price | WoW Change | WoW % | Why It Moved (Week) |
|---|---|---|---|---|
| Gold | $4,507.75/oz | –$36.07 | –0.79% | Real yield expansion (10Y 4.55–4.69% all week) capped the monetary metal bid. Intraweek: partially recovered Mon–Wed before Iran peace optimism unwound the safe-haven premium Friday. The gold/copper divergence confirms growth-confidence, not crisis-fear, drove the week. |
| Silver | $75.828/oz | –$0.534 | –0.70% | Near-flat WoW masks a Mon bounce (+1.42% recovery) and a Tue plunge (—4.20% on real yield spike) that roughly canceled. Dual headwinds from yield pressure and China trade uncertainty; industrial demand uncertainty weighed on the monetary-industrial hybrid. |
| Copper | $6.3857/lb | +$0.1069 | +1.70% | Industrial metal rose as Iran peace progress and GDPNow tracking at 4.3% Q2 sustained growth confidence. Diverged positively from gold — a clean growth-confidence signal confirming the week’s narrative was not a systemic crisis. |
| Platinum | $1,932.20/oz | –$50.85 | –2.56% | Worst commodity WoW; precious metal headwinds (yield pressure) combined with automotive catalysis demand uncertainty. The QCOM–Stellantis EV deal did not translate into platinum demand optimism — EV powertrain shift reduces auto-catalysis platinum content. |
| Bitcoin | $75,962 | –$3,110 | –3.93% | Tracked yield-sensitive risk assets throughout the week; no independent crypto catalyst or regulatory driver. Underperformed equities — pure risk-proxy behavior, not an inflation hedge or store-of-value play in a week with clear inflationary signals. |
ENERGY
The WTI/Brent spread widening from $3.69 to $6.98 WoW is the week’s most analytically precise energy signal: WTI fell more sharply than Brent because US domestic shale buffered the ceasefire optimism (reduced US domestic supply-disruption risk), while Brent retained the Hormuz premium for global buyers. Oil falling Wednesday as equities rallied confirms a supply-shock unwind read (disinflationary, equity-bullish) rather than demand destruction. Natural gas decoupled entirely from crude: Henry Hub driven by domestic weather and storage; Dutch TTF by Qatar LNG disruption fears (Tuesday spike, Friday easing).
| Asset | Fri Price | WoW Change | WoW % | Why It Moved (Week) |
|---|---|---|---|---|
| Crude Oil (WTI) | $96.37/bbl | –$9.11 | –8.64% | Iran ceasefire optimism crashed WTI —5.7% to below $100 Wednesday (first time since conflict began); talks stalled Friday on uranium retention and Hormuz toll, giving back some gains. WTI/Brent spread widened from $3.69 to $6.98 — US shale buffering more of the Iran relief than international crude. |
| Crude Oil (Brent) | $103.35/bbl | –$5.82 | –5.33% | International benchmark declined less than WTI — Hormuz structural disruption persists for European/Asian buyers regardless of US domestic strike risk. Still above $100 at week’s end as uranium/toll sticking points prevented full ceasefire premium unwind. |
| Natural Gas (Henry Hub) | $2.918/MMBtu | –$0.042 | –1.42% | Driven by domestic weather/storage — entirely decoupled from crude’s Iran narrative. Spiked Tuesday on EQT curtailments and Qatar LNG fears; fell Friday on Memorial Day weekend weather moderation. Classic US gas fundamentals, not geopolitics. |
| Natural Gas (Dutch TTF) | $16.55/MMBtu | –$0.70 | –4.06% | Spiked Tuesday on Qatar LNG supply disruption fears (∼20% of global LNG from Qatar), then reversed as Iran peace progress reduced European supply anxiety. Weekly net decline tracked Brent lower on ceasefire optimism. |
S&P 500 SECTORS — WEEKLY ROTATION
Utilities +3.17% leading the week is a dual-catalyst signal: the NextEra/Dominion $66.8B merger (Monday) repriced the entire sector from income stocks to AI power-infrastructure plays, and mid-week yield relief (10Y —9.3 bps Wednesday) added the rate-sensitivity lift. This is not defensive flight — it is a structural repricing of Utilities. Energy —0.14% pausing (despite YTD +32.88%) confirms Energy’s weekly performance is mechanically tied to crude price. Single-name dominance check: Technology ranked only 5th (+1.85% WoW) despite QCOM, IBM, AMD, and INTC each gaining 10–18% this week — NVDA’s —4.43% WoW at $5.4T market cap nearly fully offset those four names combined, the most pronounced single-name compression effect on a sector’s weekly return this year.
| Sector | 1-Week | 1-Month | 3-Month | 6-Month | YTD | 12-Month |
|---|---|---|---|---|---|---|
| Utilities | +3.17% | –2.87% | –2.85% | +3.96% | +6.94% | +15.83% |
| Healthcare | +2.89% | +1.71% | –4.84% | –0.24% | –2.36% | +15.72% |
| Real Estate | +2.76% | +0.97% | +1.58% | +8.62% | +8.68% | +9.76% |
| Financial | +1.89% | +1.13% | +1.95% | +4.90% | –2.05% | +11.56% |
| Technology | +1.85% | +11.72% | +23.10% | +21.41% | +19.72% | +48.87% |
| Consumer Cyclical | +1.66% | +1.40% | +3.51% | +4.20% | –0.95% | +10.74% |
| Industrials | +0.78% | –0.97% | –0.41% | +18.31% | +13.39% | +27.21% |
| Basic Materials | –0.11% | –2.44% | –7.20% | +24.82% | +13.91% | +44.65% |
| Energy | –0.14% | +2.48% | +10.04% | +32.18% | +32.88% | +46.49% |
| Consumer Defensive | –1.24% | +0.34% | –4.50% | +11.81% | +8.98% | +6.05% |
| Communication Services | –1.41% | +4.04% | +9.79% | +12.32% | +6.44% | +36.49% |
TOP WEEKLY MOVERS:
Three distinct catalysts drove the week’s gainer leaderboard: QCOM’s Stellantis automotive deal (multi-year OEM revenue with long-cycle visibility), IBM’s quantum foundry CHIPS Act award (federal industrial policy lifting a YTD laggard), and AMD/INTC benefiting from the NVDA earnings halo (AI capex validation). Cross-referencing the sector rotation table: Technology ranked only 5th (+1.85% WoW) despite having four of the week’s five top gainers — NVDA’s —4.43% at $5.4T cap largely offset QCOM, IBM, AMD, and INTC combined. For decliners: WMT’s —8.51% on tariff/fuel guidance (vs. 142–154% multi-year gains per the screener) confirms a policy-driven miss, not a structural break — the most actionable single-name macro signal of the week.
TOP 5 WEEKLY GAINERS
| Ticker | Week | YTD | Year | Why It Moved |
|---|---|---|---|---|
| QCOM | +18.20% | +39.23% | +61.61% | Expanded multi-year Snapdragon Digital Chassis deal with Stellantis covering Jeep, Ram, Peugeot, and Fiat — ADAS, cockpit, and Level 2+ autonomous driving across millions of vehicles. AI hardware trade rotating into automotive silicon with long-cycle OEM revenue visibility. Also OpenAI partnership for AI agent chip development announced same week. |
| IBM | +15.75% | –14.30% | –1.75% | DoC announced $1B CHIPS Act incentive for “Anderon” — America’s first purpose-built quantum chip manufacturing foundry (Albany, NY) — matched by IBM’s own $1B cash commitment. Counter-trend reversal: IBM was —14.30% YTD entering the week; the quantum industrial-policy catalyst catalyzed a structurally lagging name. |
| AMD | +10.24% | +118.30% | +322.28% | AI capex validation halo from NVDA’s +85% revenue beat (Wednesday) and INTC’s server CPU sold-out signal. Evercore ISI raised PT to $579 from $358 mid-week citing the $120B+ server CPU opportunity by 2030. Momentum continuation: AMD up 322% over the year per screener data. |
| INTC | +10.18% | +224.77% | +483.16% | Keybanc Overweight upgrade citing AI inference driving Intel’s server CPU business to a sold-out condition with ASP hikes of 10–15%. CEO confirmed 18A manufacturing yield improvement — a key credibility milestone for the factory turnaround. Intel potentially exploring AI chip startup Tenstorrent acquisition. |
| MRK | +9.90% | +16.29% | +57.26% | Phase III win for sacituzumab tirumotecan + Keytruda in first-line PD-L1-positive NSCLC (OptiTROP-Lung05) — the largest oncology market. Q1 2026 earnings beat with raised full-year guidance. Also: EU CHMP positive opinion for Keytruda + Padcev in bladder cancer. Merck partially decoupled from the consumer stress and rate headwind narratives dominating the week. |
TOP WEEKLY DECLINERS
| Ticker | Week | YTD | Year | Why It Moved |
|---|---|---|---|---|
| WMT | –8.51% | +7.95% | +25.37% | Q1 FY2027 guidance miss — Q2 revenue midpoint $185.4B below consensus, full-year EPS guidance $2.75–2.85 below the $2.92 estimate — with CEO explicitly citing tariff uncertainty and elevated fuel costs. World’s largest retailer converting consumer pessimism from survey data into hard guidance. Senior C-suite departures Friday deepened the selloff. |
| NVDA | –4.43% | +15.46% | +62.11% | Record Q1 (+85% revenue YoY, $81.6B) was the week’s most consequential earnings print — but Q2 guidance midpoint (~$91B) missed the upper range of analyst estimates, triggering the fourth consecutive post-earnings stock decline. Pre-earnings chip selloff (Mon–Tue) added to the weekly loss. AI pure-play trade now demands beat-and-exceed-every-estimate. |
| GOOGL | –3.48% | +22.35% | +124.13% | Alphabet filed antitrust appeal Friday with the DC Circuit challenging the 2024 search monopoly ruling and proposed data-sharing remedies; litigation cloud extended into 2028. Yield pressure on high-multiple mega-cap tech Monday–Tuesday added to weekly losses. Google I/O conference during the week provided no sustained upside catalyst. |
| AVGO | –2.60% | +19.66% | +79.65% | No single catalyst — broad AI semiconductor complex pressure from yield-driven selling early week and NVDA sell-the-news contagion Thursday–Friday. UBS, Evercore ISI, and Goldman Sachs each raised price targets during the week, confirming fundamental strength against a technical/sentiment headwind. |
— Institutional-grade intelligence for serious investors. Apply for membership at join.recessionalert.comC. WEEK’S TOP STORIES -> TOP
Five threads shaped the week. A geopolitical/energy thread (#1) dominated every session as Hormuz ceasefire talks oscillated between hope and impasse. A monetary/fiscal thread (#2, #5) ran independently — the Fed’s hawkish pivot and America’s sovereign fiscal credibility deteriorating simultaneously under the same long-bond pressure. A consumer reality-check thread (#3) converted sentiment survey pessimism into hard earnings guidance, with Walmart as the vector. An AI capex maturation thread (#4, #6, #7) validated the GPU supercycle while simultaneously rotating leadership toward industrial-policy and automotive silicon. A structural repricing thread (#8) recategorized Utilities as AI power infrastructure. Threads #1 and #2 were in direct tension all week: Iran optimism briefly suppressed the fiscal/monetary anxiety that resurged on Friday.
UNCERTAIN
1. Iran/Hormuz Saga: Strike Postponed → “Final Stages” → Talks Stall on Uranium — WTI —8.6% WoW, Brent Above $100 All Week, IEA “Red Zone” Warning by July–August
The core facts:Monday: Trump canceled a planned Iran military strike after Gulf allies (Saudi Arabia, Qatar, UAE) intervened for a 2–3 day pause; WTI fell —1.0% while Brent surged +2.7% as the WTI/Brent spread blew out from $3.69 to $7.72 — US shale buffering the geopolitical relief, international markets staying tight. Tuesday: Trump confirmed he was “one hour away” from ordering a strike; IEA warned that only weeks of global emergency oil reserves remained. Wednesday: Trump declared talks “in the final stages” — WTI crashed —5.7% to $98.26 (below $100 for the first time since conflict began), driving the Dow to its historic 50,000 close. Thursday: Iran talks held; oil near-flat. Friday: Iran demanded to retain enriched uranium within its borders (rejecting the primary US verification demand), and the Trump administration called a joint Iran-Oman Hormuz toll proposal “unfeasible” — Brent rebounded above $105. EIA weekly data showed a —7.86M barrel commercial crude draw (2.5x the expected draw) alongside a —9.92M barrel SPR drawdown; global emergency reserves approaching exhaustion.
Why it matters:The Hormuz saga drove the week’s most extreme individual market moves: Wednesday’s oil crash triggered simultaneous equity and bond rallies (the disinflationary shock the market had been waiting for), while Friday’s stall reinflated Brent above $100. Net WoW, oil fell —8.6% (WTI) / —5.3% (Brent) — but both benchmarks remain dramatically above pre-conflict levels (~$73 WTI), and the IEA’s July–August “red zone” supply deficit deadline means the US summer driving season will be under sustained energy inflation pressure if no deal materializes. The depleted SPR eliminates the US government’s primary supply-disruption buffer: any re-escalation from a depleted baseline would generate a price spike materially more severe than the initial shock. Three transmission channels remain active: direct CPI energy inflation, airline/trucking/manufacturing margin compression, and regressive household purchasing power destruction (confirmed in WMT’s guidance and UMich’s record-low sentiment).
What to watch:Whether the US accepts any modified uranium framework short of physical removal (the next negotiating decision point); Brent vs. the $110 level as the equity-market stress threshold where energy cost transmission forces S&P forward earnings estimate cuts; IEA coordinated emergency reserve release as the primary diplomatic time-buying tool before the July–August supply “red zone.”
BEARISH
2. Fed Hawkish Pivot: FOMC Minutes Confirm Rate-Hike Majority → Barkin Questions “Look Through” → Warsh Sworn In → Waller Drops Easing Bias — October Hike at 43% Polymarket
The core facts:Monday: 10-year Treasury held at a 52-week high (4.623%) with CME pricing 40–45% December hike probability — up from near-zero two weeks prior. Tuesday: Fed Governor Waller flagged rate-hike risks as live at the Hoover Institution; FOMC April minutes release was previewed with 4-way dissent (most since 1992). Wednesday: FOMC April minutes released — a majority of participants indicated additional firming would be appropriate if inflation persists; officials upgraded inflation from “somewhat elevated” to “elevated.” Thursday: Richmond Fed’s Barkin publicly questioned whether 5+ years above target still justifies the Fed’s “look through” doctrine. Friday: Kevin Warsh was sworn in as the 17th Fed Chair (54–45, narrowest modern confirmation); Governor Waller simultaneously dropped the easing bias explicitly, stating rate cuts are “crazy” given the inflation trajectory; Polymarket hike odds jumped 9 percentage points to 43%. The 2-year Treasury yield closed at its highest level since February 2025.
Why it matters:The sequential accumulation of hawkish signals across all 5 trading days — each a distinct, incremental escalation — constitutes the most sustained Fed tightening signal since the 2022 rate-hike cycle ended. The week ended with the easing bias formally abandoned and a new hawkish Chair installed, representing a regime change in Fed communications. Rate-sensitive sectors face a double compression: the terminal rate assumption rises while the timeline for any easing extends. Three sectors are directly exposed: REITs (dividend yields competing with 4.5%+ 10Y risk-free), homebuilders (30-year mortgage rates already at nine-month highs, an October hike extends the timeline), and long-duration growth equities (Nasdaq forward P/E multiples mechanically compress with higher discount rates). The defining paradox: the same week confirmed equities near records while the bond market fully removed any easing path — a divergence that historically closes through equity multiple compression, not sentiment recovery. (Market data receipt: see Vol & Treasuries table in Section B — 2Y +4.8 bps WoW, 10Y —5.0 bps WoW; D2 Polymarket table — hike odds at 43%.)
What to watch:June 16–17 FOMC — Warsh’s first meeting — for formal easing-bias removal and any explicit rate-hike signal; May 28 Core PCE (+0.3% expected) as the data gate before June’s meeting; Warsh’s first public statement as Chair for whether he endorses Waller’s hawkish framing or creates political space under White House pressure.
BEARISH
3. Consumer Stress Graduates From Surveys to Earnings: Walmart —7.27% Guidance Miss + UMich All-Time Record Low 44.8 + Sub-10 Gallon Fuel Behavior
The core facts:Tuesday: Redbook same-store sales decelerated from 9.6% to 8.1% YoY (sharpest weekly drop of 2026); Michigan preliminary sentiment 48.2 (historic low). Wednesday–Thursday: Home Depot’s Q1 results confirmed “greater consumer uncertainty and housing affordability pressure” with customers deferring large renovation projects; comparable transactions fell —1.3%. Thursday: Walmart Q1 FY2027 — Q2 guidance midpoint $185.4B missed consensus $186.4B; full-year EPS guidance $2.75–2.85 missed $2.92 estimate — CEO Doug McMillon explicitly cited “tariff uncertainty and elevated fuel costs” on the call. WMT fell —7.27% (~$70B market cap destroyed), its largest decline in several years. Friday: University of Michigan final May sentiment 44.8 — an all-time record low since the survey began in 1952 (well below 48.2 preliminary and 49.8 consensus); 5-year inflation expectations surged 40 basis points in a single month to 3.9%. WMT also disclosed sub-10 gallon fuel fills at Walmart stations for the first time since 2022 — observable behavioral evidence of fuel rationing at lower-income households. Two senior C-suite executives departed days after the guidance miss.
Why it matters:The significance of this story is its form, not just its magnitude. Prior consumer weakness existed only in survey data — UMich, Conference Board, Redbook. Walmart’s guidance miss converts that signal into a hard corporate earnings event with explicit policy attribution: the world’s largest retailer serving ~90% of US households is formally guiding lower and blaming tariffs and fuel. This changes buy-side models: consumer stress can no longer be dismissed as a survey artifact when a $1T market-cap company with complete household spending visibility takes it into guidance. The UMich all-time record low (44.8) and the 5-year inflation expectations surge to 3.9% simultaneously create the Fed’s worst-case scenario — collapsing demand confidence combined with de-anchoring long-run inflation expectations — the policy constraint that rules out both cuts and holds simultaneously. The sub-10 gallon fuel fills are the behavioral micro-signal that makes the macro concrete: lower-income households are rationing fuel spend at the margin, translating survey pessimism into checkout-level behavior.
What to watch:WMT Q2 actual results vs. the $185.4B guidance midpoint as the tariff-demand-destruction verification; May 28 Core PCE for whether the inflation expectations surge is validated in actual price data; June retail sales for national-scope confirmation of WMT’s consumer deceleration signal.
BULLISH
4. AI Capex Supercycle Validated: NVDA +85% Revenue, Intel Sold-Out Through 2026, AMD/INTC/LRCX Surge — But NVDA Itself —4.4% WoW on Expectation Compression
The core facts:Monday: Seagate’s CEO warned at the JPMorgan Global Tech Conference that AI capacity buildout “would just take too long” — triggering pre-NVDA chip selloffs (MU —6%, AMAT —5.3%). Tuesday–Wednesday: Intel (INTC) gained +2.45% Tuesday as pre-NVDA AI memory positioning continued; Keybanc upgraded INTC to Overweight (Wednesday) citing server CPUs sold out through 2026 with 10–15% ASP hikes and 18A manufacturing yield improvement. AMD surged +8.1% Wednesday ahead of NVDA’s report. Wednesday AMC: NVIDIA Q1 FY2027 — $81.62B revenue vs. $78.91B estimate (+85% YoY), EPS $1.87 vs. $1.75, data center $75.2B (beating $73.47B est.); Q2 guidance ~$89–93B (above $87.36B consensus but below upper-end estimates); $80B share repurchase. China H20 revenue absorbed ($0 vs. $4.6B prior year) and still beat by 5%+. Thursday: NVDA fell —1.77% (fourth consecutive post-earnings session decline); LRCX +3.47%, MU +4.11%, SNDK +10.75% on $42B hyperscaler NAND agreements. SanDisk’s separate Q3 2026 results showed 60% EPS beat and 233% sequential data-center revenue surge.
Why it matters:NVDA’s absorption of a $4.6B China headwind while posting a 5%+ revenue beat removes the primary AI hardware bear thesis — demand saturation — and confirms hyperscaler AI capex commitments are structurally real, not speculative. The Intel sold-out condition signals the AI infrastructure buildout has broadened from GPU silicon to the full compute stack (CPUs, memory, storage, equipment). The NVDA stock’s —4.43% WoW despite the fundamental beat creates a critical market structure observation: the AI pure-play trade has entered a phase where exceptional execution no longer rewards — markets now demand beat-and-exceed-every-estimate. This is analytically significant because it implies the AI hardware trade is maturing from a momentum trade into a fundamentals valuation story, where each successive quarter carries higher expectations and diminishing surprise capacity. The $80B buyback signals management’s conviction in sustained cash generation at these revenue scales — an unprecedented capital return commitment in semiconductor history.
What to watch:MRVL, CRM, SNPS all reporting Wednesday May 27 AMC as the next AI infrastructure data points; hyperscaler Q2 earnings calls for AI capex commitment depth and monetization timeline; AMD Q2 2026 earnings for parallel GPU demand confirmation.
BEARISH
5. US Fiscal Credibility Under Siege: Moody’s Aa1 Downgrade + Foreign Sellers —$14.9B + 20-Year Auction Weak at 5.12% — Structural Long-End Premium Expanding
The core facts:The week opened with the Moody’s Aa1 downgrade (announced Saturday May 16 after May 15’s MIB) as background context, immediately embedded into Monday’s TIC data: March 2026 Treasury International Capital figures showed foreign official institutions — central banks and sovereign wealth funds — were net sellers of $14.9B in US long-term securities, with China and Japan (the two largest foreign holders) reducing positions. Simultaneously, Treasury disclosed Q2 2026 borrowing needs at $189B — $79B above its February estimate of $110B. Tuesday: The 30-year Treasury yield reached 5.198% (its highest level since 2007) as fiscal deficit anxiety drove term-premium expansion in the long end; the 30Y breach was driven by the compounding of the Moody’s backdrop, foreign-selling confirmation, and above-plan Treasury supply. Wednesday: The $16B 20-year bond auction cleared at 5.122% — 23.9 basis points above the prior auction — with a bid-to-cover ratio of 2.55 (below the 10-auction average of 2.65). Foreign indirect bidder participation came in below the recent average. Philadelphia Fed’s Paulson and New York Fed officials separately proposed extending dollar swap lines, citing “growing international apprehension about US financial reliability.”
Why it matters:The sovereign fiscal risk story is distinct from and compounding to the monetary policy story (story #2). Even as Iran disinflation briefly pulled long yields down mid-week, the 20-year auction confirmed that the long end carries a structural fiscal risk premium that geopolitical tailwinds cannot fully neutralize: at 5.12% yield with a below-average bid-to-cover, the market is requiring a sustained concession to absorb US debt. The buyer base shifting from patient sovereign holders to hedge funds and tactical investors historically increases yield volatility and reduces the absorptive capacity for future supply shocks. The three compounding elements — Moody’s removing the final AAA rating, foreign official sellers, and $79B above-plan Q2 issuance — represent a structural repricing of the US sovereign risk premium that will persist independently of Fed policy decisions. Fed officials explicitly acknowledging “growing doubts about US financial reliability” in the swap-line context is a rare institutional admission that belongs in portfolio risk models.
What to watch:Next major Treasury auctions for bid-to-cover trends; April TIC data (released ~June 18) for confirmation of the foreign-official selling trend; any formal sovereign reserve-manager diversification announcements from major wealth funds; 10-year sustained above 4.6% as the secondary equity pain threshold.
BULLISH
6. IBM +12% on CHIPS Act “Anderon” Quantum Foundry — America’s First Purpose-Built Quantum Chip Manufacturing Facility; $2B Total Federal + Private Investment
The core facts:Thursday May 21: The US Department of Commerce and IBM announced a Letter of Intent to award $1B in CHIPS Act incentives for “Anderon” — America’s first purpose-built quantum chip manufacturing foundry — to be built in Albany, NY. IBM commits an additional $1B in cash, IP, and workforce. The 300-millimeter quantum wafer foundry will operate as an open-access facility serving multiple quantum hardware vendors initially focused on superconducting qubit wafers. Total DoC quantum investment across the sector reached $2B, with D-Wave Quantum and Rigetti Computing each receiving up to $100M separately. IBM surged +12.43% on the session (one of its largest single-session gains in years), with the broader semiconductor complex rallying (QCOM, MU, LRCX each +3–5%). IBM was —14.30% YTD and —1.75% YoY entering the week.
Why it matters:The CHIPS Act’s extension into quantum computing marks a qualitative shift in US industrial policy: federal investment has moved from defending legacy semiconductor fabs (TSMC, Intel) to actively seeding the next generation of computing infrastructure. The open-access foundry model — serving multiple vendors rather than IBM alone — mirrors TSMC’s merchant-fab success and dramatically lowers the barrier for quantum hardware startups to reach commercial scale. For IBM specifically, this resets the long-term narrative: from a hardware-to-services company back toward advanced manufacturing. The quantum supply chain — cryogenic components, specialized control electronics, quantum error-correction software — is now eligible for the same industrial policy tailwind that drove the first CHIPS Act wave into traditional semiconductor names. IBM’s +12.43% on a ~$230B market cap (~$27B in market cap creation) catalyzed the entire AI and quantum complex; the magnitude signals institutional conviction that the foundry model is commercially viable.
What to watch:Congressional confirmation of the $1B CHIPS Award and any conditions; Anderon’s first commercial wafer production timeline; D-Wave (QBTS) and Rigetti (RGTI) as fellow CHIPS recipients benefiting from the same quantum industrial policy wave; next CHIPS Act funding round for further quantum scope expansion.
BULLISH
7. QCOM +18% on Stellantis Snapdragon Deal — Multi-Year Automotive AI Partnership Across Millions of Jeep, Ram, Peugeot, Fiat Vehicles Including Level 2+ Autonomy
The core facts:Friday May 22: Qualcomm and Stellantis announced an expanded multi-year technology partnership integrating Qualcomm’s Snapdragon Digital Chassis — ADAS, cockpit, and connectivity platforms — across Stellantis’s next-generation vehicle architectures including Jeep, Ram, Peugeot, and Fiat. The deal includes Snapdragon Ride Pilot, enabling Level 2+ hands-free automated driving across Stellantis’s global fleet. Additionally, companies signed a non-binding letter of intent for Stellantis’s autonomous driving subsidiary aiMotive to join Qualcomm, subject to closing conditions — giving Qualcomm in-house simulation and full-stack AV software capability. QCOM surged +11.6% on the session (largest single-day gain in months), with automotive chip peers AMD +4.0% and TXN +3.6%. Qualcomm’s automotive revenue now exceeds $5B annually. Separately, OpenAI also announced a partnership with Qualcomm to develop an AI chip for agentic devices.
Why it matters:The Stellantis deal is the most significant automotive semiconductor partnership of the current cycle and illustrates the AI trade’s rotation from pure-play GPU into industrial applications with multi-year contractual visibility. QCOM’s automotive revenue stream ($5B+ annually) is poised to accelerate with a multi-brand, multi-million-vehicle commitment from the world’s fourth-largest automaker — providing durable long-cycle revenue that offsets handset market cyclicality. The Level 2+ Ride Pilot expansion places Qualcomm in direct competition with Mobileye and NVIDIA in the ADAS segment, the highest-margin sub-sector of automotive semiconductors. The aiMotive LOI brings full-stack software capability in-house — a value-capture move from chip to algorithm that peers cannot replicate quickly. For TI (+3.6%) and AMD (+4.0%), the read-through is clear: OEM automotive chipset budgets are expanding, not contracting, contradicting the EV demand deceleration narrative that had been weighing on auto-exposed names.
What to watch:aiMotive closing conditions and final LOI conversion; Mobileye and NVDA Drive competitive response; QCOM investor update for automotive revenue guidance revision upward given the expanded Stellantis scope; whether the OpenAI device partnership generates a distinct revenue line beyond automotive.
UNCERTAIN
8. NextEra/Dominion $66.8B Merger — AI Power Demand Institutionalized as a Utility Sector Thesis; D +9.4%, NEE —4.6%, Peers Repriced for Takeout Optionality
The core facts:Monday May 18: NextEra Energy announced a definitive agreement to acquire Dominion Energy in a $66.8B all-stock transaction — one of the largest utility mergers in US history. NextEra shareholders would own 74.5% of the combined entity. The strategic rationale is AI/data center power: Dominion’s Northern Virginia territory hosts the world’s highest concentration of hyperscale computing (“Data Center Alley”), where AWS, Microsoft, Google, and Meta hold multi-decade power purchase agreements. The combined company projects adjusted EPS growth exceeding 9% through 2035. Dominion surged +9.4% on the acquisition premium; NextEra fell —4.6% on dilution and regulatory-timeline concerns. Transaction closing is expected in 12–18 months, subject to FERC, Virginia State Corporation Commission, and antitrust review. Sector peers CEG, SO, DUK, AEP repriced for takeout optionality. UAE separately announced its Hormuz bypass pipeline is 50% complete — a structural long-term supply security development.
Why it matters:This deal crystallizes the AI power demand infrastructure thesis at the utility level: data centers require massive, reliable electricity; capacity is the binding constraint on AI expansion in Northern Virginia; and Dominion holds the franchise territory. The acquisition signals that AI power demand is now a secular growth driver justifying control-premium M&A in a regulated sector — a recategorization of Utilities from income vehicles to strategic AI infrastructure plays. The sector-wide repricing for takeout optionality (CEG, SO, DUK, AEP) contributed to Utilities leading all S&P 500 sectors for the week (+3.17% WoW — see weekly sector rotation table in Section B), the most concrete market validation of the AI power thesis. The UNCERTAIN sentiment reflects genuine deal uncertainty: the 18-month regulatory gauntlet and 10-year yields at elevated levels both compress deal economics; Virginia’s State Corporation Commission has historically scrutinized Dominion deals heavily.
What to watch:FERC review timeline and Virginia SCC approval process as the two critical regulatory bottlenecks; NextEra’s first post-announcement earnings call for deal financing and dilution guidance; utility sector peer re-rating for CEG, SO, and DUK as the market prices in takeout premiums.
— Separating signal from noise since 2007. Apply for membership at join.recessionalert.comD. WEEK IN THE ECONOMY -> TOP
The week delivered the clearest “Fed-cut bets re-priced” signal of 2026: April FOMC minutes confirmed a majority ready to hike, Governor Waller explicitly dropped the easing bias on Warsh’s swearing-in day, and Polymarket hike odds surged to 43% by Friday — a week that began with 33% cut odds and ended with those expectations comprehensively dismantled. The data supported the hawkish pivot without ambiguity: Flash PMI manufacturing hit a 4-year high (55.3) while input prices exploded to their fastest pace since the 2022 energy shock (64.0); GDPNow tracked Q2 at 4.3%. Against this, UMich final sentiment printed 44.8 — the lowest reading in the survey’s 74-year history — with 5-year inflation expectations surging 40 bps to 3.9% in a single month, the de-anchoring signal that most constrains the Fed’s ability to look the other way. Markets reacted appropriately: the 2Y rose 4.8 bps on the week (see Vol & Treasuries table, Section B); Polymarket cut odds collapsed from 33% to well below that level. Thursday’s Core PCE release (+0.3% expected, May 28) is the defining data gate before the June 16–17 FOMC — the first meeting under Chair Warsh — at which formal easing-bias removal and explicit rate-hike signaling are now the base case.
POLYMARKET ODDS — WEEK-ON-WEEK SHIFT:
| Market | Last Friday | This Friday | Δ |
|---|---|---|---|
| US Recession by end-2026 | N/A | N/A | — |
| Fed rate hike in 2026 | ~34% (Thu) | 43% | +9 pp |
| Fed rate cuts ≥1 in 2026 | 33% | N/A | — |
Note: Hike odds last-Friday estimated from Thursday May 21 Polymarket level (+9 pp jump confirmed on Friday May 22 per MIB). Recession odds and this-Friday cut odds not explicitly stated in any daily this week; market context implies cuts odds fell sharply from the 33% May 15 baseline given Waller’s Friday easing-bias removal.
BEARISH
April FOMC Minutes: Majority Favors Hike If Inflation Persists; Waller Drops Easing Bias; Warsh Sworn In — Most Hawkish Sequential Fed Signal Since 2022 (Federal Reserve, May 20–22)
What they’re saying:Wednesday May 20: April FOMC minutes released — a majority of participants indicated “additional policy firming would likely become appropriate” if inflation remains persistently above 2%; officials upgraded inflation characterization from “somewhat elevated” to “elevated”; many participants wanted to remove the easing bias from the policy statement; historic 4-way dissent (most since 1992) documented. Friday May 22: Fed Governor Waller explicitly stated inflation is “not headed in the right direction” and that rate cuts are “crazy”; he supports removing the easing bias and cannot rule out voting for a rate hike. Kevin Warsh sworn in as 17th Fed Chair (54–45, narrowest modern confirmation). Polymarket rate-hike odds jumped 9 pp to 43%.
The context:The week’s sequential Fed signal is the most hawkish since 2022: FOMC minutes confirmed a rate-hike majority → Barkin publicly questioned the “look through” doctrine (Thursday) → Waller explicitly dropped the easing bias (Friday) → Warsh installed as the new Chair, inheriting this record. Polymarket cut odds fell from 33% (May 15) while hike odds rose to 43%; the 2Y Treasury rose 4.8 bps WoW (see Vol & Treasuries table, Section B). The rate-cut cycle that opened 2026 as the consensus expectation is now definitively closed — replaced by a rate-hike scenario as the live central case for H2 2026.
What to watch:June 16–17 FOMC — Warsh’s first meeting — for formal easing-bias removal; May 28 Core PCE as the inflation data gate before June; any Warsh public statements before the June blackout period for the new Chair’s first framing.
BEARISH
Michigan Consumer Sentiment Final 44.8 — All-Time Record Low Since 1952; 5-Year Inflation Expectations Jump 40 bps to 3.9% (University of Michigan, May 22)
What they’re saying:Final May 2026 Consumer Sentiment: 44.8 (vs. 48.2 preliminary, vs. 49.8 April) — the lowest reading since the survey began in 1952, worse than the 1970s oil crisis, the Great Recession, and COVID. Current Conditions: 45.8 (record low). Consumer Expectations: 44.1 (record low). Year-ahead inflation expectations: 4.8% (vs. 4.5% expected). Five-year inflation expectations: 3.9% (vs. 3.4% expected) — the sharpest monthly surge in long-run expectations in recent history. 57% of consumers spontaneously cited high prices as eroding personal finances; lower-income households showed the steepest declines.
The context:The 5-year inflation expectations surge to 3.9% is analytically more consequential than the headline sentiment number. Long-run de-anchoring of inflation expectations is the specific scenario the Fed fears most — once the public stops believing inflation will return to 2%, more aggressive tightening becomes the only credible policy response. The divergence between record-low sentiment (44.8) and near-record-high equity markets (Dow at 50,579) is the widest since the 2022 inflation shock; this gap historically closes through equity compression rather than sentiment recovery. The 40-bps monthly surge in 5-year expectations — the largest one-month jump in the measure’s recent history — directly informs Waller’s Friday hawkish signal and Warsh’s June FOMC agenda.
What to watch:May 28 Core PCE for whether hard inflation data validates the expectations surge; June UMich preliminary reading (mid-June) for trend confirmation; CB Consumer Confidence (Tue May 26, prior 92.8) as the immediate cross-validation.
UNCERTAIN
Flash PMI Manufacturing 55.3 (4-Year High) But Input Prices Hit 64.0 (Fastest Since 2022 Energy Shock); Philly Fed Collapses 27 Points to –0.4 Simultaneously (S&P Global / Philadelphia Fed, May 21)
What they’re saying:S&P Global Flash Manufacturing PMI: 55.3 for May (highest since May 2022, above 53.8 est., up from 54.5 prior). Input price index: 64.0 (highest since November 2022; fastest one-month acceleration since the 2022 energy shock). Supplier delivery times: longest since August 2022. Services PMI: 50.9 (slipped from 51.1). Composite PMI: 51.7. S&P Global projects Q2 GDP at ~1% annualized from composite PMI. Simultaneously: Philadelphia Fed Manufacturing Index collapsed to –0.4 (vs. +18.0 consensus, down 27 points from +26.7) — one of the largest single-month drops on record; new orders plunged 35 points to –1.7 (lowest since April 2025); future general activity 53.2 (highest since June 2021).
The context:The national vs. regional divergence (national PMI booming, Philadelphia cratering) leaves the Fed interpreting two irreconcilable manufacturing signals simultaneously — the most analytically challenging data configuration of the week. The PMI input price surge to 64.0 provides the hawkish data ammunition the FOMC hawks needed: it validates Barkin’s “look through” challenge and Waller’s easing-bias abandonment with hard numbers. For the Philly Fed collapse: new orders at –1.7 are a 2–3 month leading indicator for manufacturing employment — historically, sub-zero new orders precede regional jobless claim increases. The futures-vs-current gap (future +53.2 vs. current –0.4) suggests firms view the weakness as temporary and tied to Iran/energy uncertainty resolution.
What to watch:ISM Manufacturing (June 2) for national-level confirmation or divergence; June Philly Fed for whether the 27-point collapse reverses (as firms’ optimistic future outlook implies); May CPI (June 10) for whether PMI input price acceleration transmits into realized consumer inflation.
BULLISH
GDPNow Q2 Upgraded to 4.3% + ADP Private Hiring Strengthens to 42,250/Week + LEI Beats; Hard Activity Data Defies Consumer Survey Pessimism (Atlanta Fed / ADP / Conference Board, May 19–22)
What they’re saying:Atlanta Fed GDPNow upgraded Q2 2026 GDP to 4.3% SAAR (from 4.0%), driven by personal consumption tracking +2.9% and gross private domestic investment +11.4%. ADP NER Pulse for the four weeks ending May 2: private employers added 42,250 jobs/week (up from 33,000 prior, second consecutive weekly strengthening). Conference Board Leading Economic Index for April: +0.1% MoM (beat –0.2% estimate, first positive reading since November 2025) — driven by rebounding equity prices and stronger building permits; 6-month growth rate remains negative at –0.7%. Initial jobless claims week of May 16: 209K (below 210K expected). Continuing claims: 1,782K (below expectations).
The context:A 4.3% GDPNow alongside an all-time-low consumer sentiment (44.8) represents the most extreme divergence between hard activity data and survey-based signals in the current cycle. The GDPNow strength is real but concentrated — investment in AI infrastructure, data centers, and energy production drives the majority of the +11.4% investment component. The labor market holds: claims below 210K confirms no mass-layoff environment despite multiple macro headwinds. For the Fed, this growth data eliminates the cyclical slack argument that would otherwise justify looking through inflation: a strong economy combined with de-anchoring inflation expectations provides the cleanest case for a rate hike since 2023. The LEI’s first positive monthly reading since November 2025 provides a green shoot, though the 6-month trend remaining negative at –0.7% keeps recession risk on the table.
What to watch:May 28 GDPNow update (incorporating April Durable Goods and Q1 GDP 2nd estimate); Q1 GDP 2nd estimate (May 28, exp. +2.0%) as the backward-looking anchor; June ADP monthly employment change as the monthly-frequency labor market read.
BEARISH
Recession-Risk Cluster: Redbook Retail Deceleration + West Marine Chapter 11 (16-Year Bankruptcy High) + Housing Starts –2.8% MoM + Philly Fed New Orders Contract (May 18–22)
What they’re saying:Tuesday: Redbook same-store sales decelerated from 9.6% to 8.1% YoY — the sharpest weekly drop of 2026, citing $4.50+/gallon gasoline. Monday: West Marine (∼250 stores nationally) filed Chapter 11 with $500M–$1B in liabilities — LBO-era debt load colliding with high-rate/energy-cost consumer environment. S&P Global had flagged 2026 large-company bankruptcies tracking at a 16-year high. Thursday: April housing starts 1.465M (beat consensus but –2.8% MoM); single-family starts –9% MoM; building permits +5.8% (beat). Philadelphia Fed new orders –1.7 (lowest since April 2025), a 2–3 month leading indicator for manufacturing employment. Pending home sales for April: +1.4% MoM (first YoY positive since 2024) — the one constructive housing data point of the week.
The context:These signals cluster around a common theme: the tariff-and-energy-cost dual squeeze is translating from abstract macro concern into observable behavioral changes. The Redbook 150-basis-point weekly deceleration is early-stage; West Marine’s bankruptcy represents the LBO-era debt reckoning accelerating (S&P tracking bankruptcies at a 16-year high confirms this is a structural wave, not isolated). Housing Starts’ single-family –9% MoM despite a permits beat signals the build pipeline is rebuilding supply while near-term demand is constrained by 30-year mortgage rates near nine-month highs. The Philly Fed new orders turning negative is the most concerning forward indicator: sub-zero new orders historically lead manufacturing employment cuts by 2–3 months, suggesting Q3 regional labor market weakness is possible if Iran/energy headwinds persist.
What to watch:May retail sales data (released mid-June) as the monthly confirmation of Redbook’s weekly deceleration; June Philly Fed for whether new orders remain in contraction; Q2 2026 corporate bankruptcy filings pace vs. the 16-year-high tracking; Existing Home Sales April (May 22 release) for demand-side housing read.
— Know the probability before the market prices in the risk. Apply for membership at join.recessionalert.comE. WEEK IN EARNINGS -> TOP
TOP EARNINGS OF THE WEEK
UNCERTAIN
1. NVIDIA (NVDA): –4.43% WoW | Record Q1 +85% Revenue — But Fourth Consecutive Post-Earnings Decline as Guidance Missed Upper-Range Estimates
The Numbers:Q1 FY2027 Revenue: $81.62B vs. $78.91B est. (+3.44% beat); +85% YoY. Non-GAAP EPS: $1.87 vs. $1.75 est. (+6.86%). Data Center: $75.2B vs. $73.47B est. Gaming: record $3.76B (+42% YoY). China H20 revenue: $0 (full headwind absorbed vs. $4.6B prior year). Q2 FY2027 guidance: ~$89–93B (above $87.36B consensus but below upper-range analyst estimates). $80B share repurchase announced. Released AMC May 20.
The Problem/Win:The fundamental WIN is unambiguous: absorbing a full China H20 headwind (~$4.6B lost vs. prior year) while posting a 5%+ revenue beat removes the demand-saturation bear thesis and confirms Blackwell GPU order books are full independent of the China market. The $80B buyback signals management conviction in sustained cash generation at multi-hundred-billion revenue run rates. The PROBLEM: Q2 guidance midpoint (~$91B) was above consensus but below the upper end of analyst estimates — triggering the fourth consecutive post-earnings stock decline. This is a market structure observation: NVDA’s valuation now demands beat-and-exceed-every-estimate to generate a positive session. This is different from a fundamental deterioration; it is expectation compression at peak valuation.
The Ripple:AMD surged +8.1% on Wednesday (AI capex validation halo) and ended the week up +10.24% WoW. LRCX +6.84% Wednesday, +3.47% Thursday. SanDisk +10.75% Thursday on its own blowout results (60% EPS beat, $42B hyperscaler NAND agreements). The NVDA earnings validated the AI infrastructure supply chain broadly — despite NVDA itself trading lower. The one exception: NVDA’s stock —4.43% WoW became the dominant single-name drag on the Technology sector’s weekly performance (+1.85% WoW despite having four 10%+ gainers).
What It Means:NVDA is executing at an unprecedented scale, but the stock is in a new phase: from momentum trade to fundamentals valuation. The AI infrastructure supercycle is real and confirmed — but the pure-play GPU trade may have lower forward return potential than the AI supply chain names (AMD, INTC, LRCX, MU) that benefit from the same buildout at lower valuations and with fresh earnings-upgrade cycles ahead.
What to watch:Q3 FY2028 guidance relative to upper-range analyst estimates at the next quarterly call — the test of whether expectation compression is structural; MRVL results (AMC May 27) for custom AI silicon demand confirmation; hyperscaler Q2 earnings for AI ROI framing vs. capex commitments.
BEARISH
2. Walmart (WMT): –7.27% | Q1 Revenue Beat But Q2/FY Guidance Miss — Financial Print Details Behind the Consumer Stress Narrative
The Numbers:Q1 FY2027 Revenue: $177.75B vs. $174.84B est. (+1.66% beat; +7.3% YoY). EPS: $0.66 vs. $0.66 est. (inline). US comparable sales: +4.1% (transactions +3.0%, average ticket +1.1%). eCommerce: +26% YoY. Fuel and distribution costs: +$175M above prior year in Q1. Q2 FY2027 revenue guidance: ~$185.4B midpoint vs. $186.4B consensus (–$1B shortfall). Full-year EPS guidance: $2.75–$2.85 vs. $2.92 consensus. Sam’s Club US comparable sales: +9.0% (accelerating). Released BMO May 21.
The Problem/Win:The Q1 revenue beat and +4.1% US comp confirm Walmart continues taking market share — including from dollar stores and mass-market peers. Sam’s Club at +9.0% comp is an acceleration, not a miss. The problem lies in what the guidance miss reveals about forward demand: the $175M fuel/distribution cost overrun in a single quarter is an itemized transmission of the Hormuz oil shock into Walmart’s P&L. Management is explicitly guiding lower and attributing it to policy (tariffs) and energy (fuel) — a precise separation of macro headwinds from company execution. The full-year EPS miss is more significant than the Q2 revenue miss: it implies margin compression from tariff pass-through costs is structural, not one-quarter transitory.
The Ripple:Costco (COST) fell —2.19% in sympathy Thursday; Consumer Defensive sector —1.24% WoW. Target (TGT) and Dollar General (DG) both face scrutiny as the next large-format consumer health read-throughs. RBC cut its WMT price target from $140 to $137. [For the week’s consumer stress narrative and the broader macro significance of this print — UMich record low, sub-10 gallon fuel fills, C-suite departures — see Section C story #3.]
What It Means:The financial print details tell a more nuanced story than the headline miss: WMT’s Q1 operations were fundamentally strong (share gains, eCommerce momentum, Sam’s accelerating); the guidance miss is a forward projection of a policy-driven cost environment, not current demand collapse. The market’s —7.27% reaction correctly sized the magnitude of the guidance miss relative to WMT’s conservative guidance history — the company does not guide lower without high conviction.
What to watch:WMT Q2 actual revenue vs. the $185.4B guidance midpoint as the definitive tariff-demand-destruction test; Target Q2 earnings as the next large-format consumer read; June retail sales for national-scope validation of WMT’s demand conservatism.
BULLISH
3. TJX Companies (TJX): +5.66% | EPS +16.82% Above Estimate — Off-Price Consumer Trade-Down Accelerating as Gasoline and Housing Pressure Discretionary Spending
The Numbers:Q1 FY2027 Revenue: $14.32B vs. $14.02B est. (+2.20% beat). Adj. EPS: $1.19 vs. $1.02 est. (+16.82% beat). Comparable store sales and customer transaction counts ahead of plan. Full guidance reaffirmed. Released BMO May 20.
The Problem/Win:TJX delivered the week’s cleanest earnings beat by margin: +16.82% EPS above estimate with no guidance reduction. The business model is structurally positioned as the beneficiary of exactly the consumer stress the rest of the week documented — gasoline at $4.50+/gallon, University of Michigan sentiment at a record low (48.2 preliminary, 44.8 final), and deferred home improvement projects (per Home Depot CEO commentary). TJ Maxx, Marshalls, and HomeGoods become destination retailers as full-price discretionary spending softens; the operating leverage from higher traffic and transaction volumes converts consumer caution into TJX outperformance. The +16.82% EPS beat reflects both revenue upside and margin leverage from increased traffic — the highest magnitude EPS beat in the week’s earnings slate.
The Ripple:The TJX result confirms the consumer bifurcation: off-price accelerating while full-price decelerates (Home Depot’s customer transaction count —1.3% reported Tuesday; WMT inline on EPS Thursday). Ross Stores (ROST) and Burlington Coat Factory (BURL) are the most direct peer read-throughs. Full-price specialty retailers face continued share loss to value channels in this environment — apparel, electronics, home goods all at risk.
What It Means:TJX is one of the few large-cap equities that benefits structurally from the inflation/consumer-stress environment — higher energy and tariff costs that pressure most consumer companies channel incremental spending toward off-price value. This is the consumer bifurcation thesis confirmed in financial results, not just theory.
What to watch:Ross Stores’ next earnings for same-store sales confirmation of off-price acceleration; monthly retail sales data for acceleration in discount/off-price vs. deceleration in full-price channels; TJX Q2 guidance update as the forward read on whether the off-price trade-down trend is building.
WEEK AHEAD PREVIEW:
Q1 2026 earnings season is functionally complete (~92% of S&P 500 reported). US markets are closed Monday, May 25 (Memorial Day) — four-session trading week. Three mega-cap technology names report Wednesday, May 27 after market close.
Marvell Technology (MRVL) — AMC Wednesday, May 27 — Key focus: custom AI XPU (accelerator) demand from hyperscaler clients (Google, Amazon, Microsoft); validation of NVIDIA’s $2B strategic investment and NVLink Fusion partnership economics; 800G/1.6T optical transceiver ramp cadence; Q1 FY2027 revenue guidance vs. ~$2B consensus. MRVL is the primary custom AI silicon beneficiary after NVDA and AMD — its results will be read as a forward demand indicator for the entire AI infrastructure buildout.
Salesforce (CRM) — AMC Wednesday, May 27 — Key focus: Agentforce AI agent platform adoption metrics and enterprise deal count; Q2 revenue guidance vs. consensus; enterprise software spending durability amid macro uncertainty; any AI monetization timeline update. CRM is the bellwether for enterprise software demand and the first major SaaS company to report Q1 following the tariff/macro disruption.
Synopsys (SNPS) — AMC Wednesday, May 27 — Key focus: Ansys ($35B acquisition) integration progress and “Silicon-to-Systems” revenue synergy realization; EDA software demand from advanced-node semiconductor clients; $9.61B full-year revenue guidance confirmation. No other companies with >$100B US market cap are confirmed for the May 26–29 window. Q2 2026 earnings season begins mid-July.
— US market commentary trusted by family offices and institutions. Apply for membership at join.recessionalert.comF. NEXT WEEK SETUP -> TOP
UPCOMING RELEASES:
| Date | Event | Why It Matters |
|---|---|---|
| Mon, May 25 | US Markets Closed (Memorial Day) | Four-session trading week; reduced liquidity may amplify moves in any Iran/oil headline over the long weekend. |
| Tue, May 26 | Chicago Fed National Activity Index (prior: –0.20) | Concurrent activity breadth gauge; a second consecutive negative reading would confirm below-trend growth despite GDPNow’s 4.3% Q2 tracking — key test of whether hard activity data is beginning to reflect the Iran-driven headwinds visible in sentiment surveys. |
| Tue, May 26 | CB Consumer Confidence (prior: 92.8) | First post-UMich all-time-low cross-validation: if CB Confidence accelerates the sentiment collapse, it confirms breadth of consumer pessimism beyond the Michigan survey cohort; a stabilization supports the soft-landing divergence thesis between hard and survey data. |
| Tue, May 26 | Dallas Fed Manufacturing Index (prior: –2.3) | Regional manufacturing barometer for the energy-exposed Texas economy; a further deterioration would signal the Iran-driven cost shock is compressing industrial margins even in production-side, energy-producing regions — cross-validation of the Philly Fed’s 27-point collapse. |
| Wed, May 27 | ADP Employment Change (prior: 42.25K/week) | Private payroll early read ahead of the June jobs report; a soft print would complicate Waller’s hawkish framing by introducing labor market softness into the inflation calculus — the Fed cannot easily hike into a deteriorating jobs market; a strong print removes the final cyclical argument against June tightening. |
| Wed, May 27 | Fed Speeches: Logan, Cook, Jefferson | Three Board-level voices on the same day Waller’s hawkish framing and Warsh’s swearing-in reset the policy baseline; market will parse for alignment with or resistance to easing-bias removal and October hike pricing — any dovish dissent would compress 2Y yields and create confusion about June FOMC direction. |
| Thu, May 28 | Core PCE Price Index MoM — Apr (expected: +0.3%) | The Fed’s preferred inflation gauge and the single most market-moving data point of the week: a +0.3% or above print alongside UMich 5-year expectations at 3.9% constitutes the clearest case for the June FOMC to formally drop the easing bias; a surprise +0.4% would likely push the 10-year above 4.75% and force immediate repricing of rate-sensitive equities. |
| Thu, May 28 | GDP Growth Rate Q1 2nd Estimate (expected: +2.0% SAAR) | Backward-looking anchor for the growth vs. inflation tradeoff: a downward revision below +2.0% provides cyclical cushion for Waller’s hike urgency to moderate; an upward revision reinforces the strong-economy + rising-inflation combination that is the cleanest justification for a rate hike since 2023. |
| Thu, May 28 | Durable Goods Orders MoM — Apr | Forward-looking investment gauge testing whether GDPNow’s +11.4% gross private investment tracking is grounded in hard order data; a miss would suggest the investment surge is AI/energy capex concentrated, not broad-based. |
| Thu, May 28 | Initial Jobless Claims (week ending May 23) | Weekly labor market pulse; claims trending above 240K would signal labor market softening — a Fed-constraining data point that complicates the hawkish consensus forming around Waller’s easing-bias removal. |
| Thu, May 28 | Building Permits Final — Apr (expected: 1.442M) | Housing activity gauge sensitive to rate environment; 30-year mortgage rates at nine-month highs make any deterioration a leading indicator of housing sector stress — direct transmission of Warsh’s hawkish posture into the real economy. |
WHAT TO WATCH NEXT WEEK:
1. Does Thursday’s Core PCE (+0.3% expected) validate the UMich 5-year inflation expectations surge to 3.9% — and at what level does Warsh’s June 16–17 FOMC debut formally remove the easing bias and begin signaling a rate hike path, closing the gap between bond market caution (2Y at 4.12%) and equity market complacency (Dow at 50,579)?
2. Do the Iran uranium-retention demand and Hormuz toll dispute prove to be opening negotiating positions or hard red lines — and does any deal signal before the July–August IEA “red zone” supply deficit deadline materially change the June–July CPI trajectory and the Fed’s rate-hike calculus?
3. Can MRVL and CRM (both reporting AMC Wednesday) confirm the AI capex cycle is broadening into custom silicon and enterprise software — or does the market’s treatment of NVDA’s record earnings (—4.43% WoW) signal that AI-trade expectation compression will extend to the next tier of reporters regardless of the print?
4. With the CB Consumer Confidence, Dallas Fed, and Chicago CFNAI all releasing Tuesday, does the post-UMich data avalanche confirm the hard-vs-survey divergence (GDPNow 4.3% vs. Sentiment 44.8) as the defining macro tension — and which direction does it close: activity slowing toward survey pessimism, or sentiment recovering toward activity strength?
— US market commentary trusted by family offices and institutions. Apply for membership at join.recessionalert.comG. CHART OF THE WEEK -> TOP
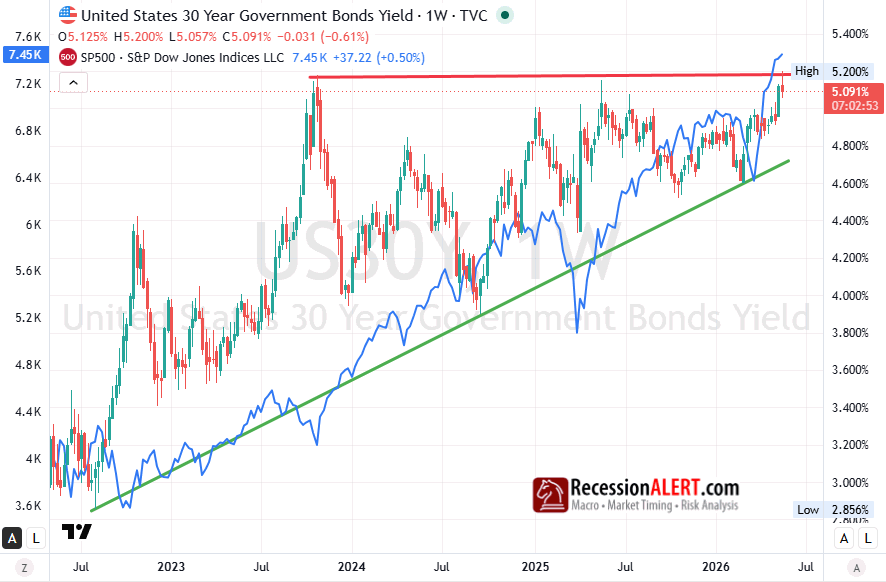
Chart of the Week: The 30-year Treasury yield’s return to 5.20% this week unifies what looks like five separate stories — Iran oil shock, Moody’s Aa1 downgrade, Waller dropping the easing bias, UMich sentiment at an all-time record low, and the weak 20-year auction — into one: the US cost of permanent capital is being structurally repriced higher, not temporarily elevated. The equity market at a record 50,000 Dow and the bond market at a 19-year yield high are not contradicting each other; the equity market is pricing strong growth (NVDA +85%, GDPNow 4.3%), while the bond market is pricing the fiscal and monetary cost of achieving that growth. These are consistent readings — for now. The moment they stop being consistent is when the 30-year closes above 5.20% with duration, households begin repricing their 30-year mortgages, and the equity risk premium collapses. That moment has not arrived; this week confirmed it is getting closer.
MIB Weekly Digest Ver. 1.63
For professional investors only. Not investment advice.
© 2026 RecessionALERT.com

Comments are closed.