
MIB WEEKLY DIGEST
Week of Aug 24–28, 2026
Fed Chair Kevin Warsh used his first Jackson Hole keynote to say the central bank has “more work to do” on inflation, and the two-year Treasury yield ended the week 12.2 basis points higher at 4.354% — September is now a live hike meeting, with Polymarket’s 2026 hike contract up twelve points to 68%. The damage landed on gold (−3.50%) and the Russell 2000 (−1.51%), not the S&P 500 (+0.49%). Nvidia’s $96.22bn quarter and $279bn of supply commitments carried Thursday’s tape before Friday’s rate move took semiconductor equipment down 4–5%. Salesforce (+22.39%) and CrowdStrike (+13.78%) led all mega-caps; Canada’s C$27.6bn counter-tariffs land September 8.
TABLE OF CONTENTS
A. WEEK AT A GLANCE
B. WEEK IN MARKETS
C. WEEK’S TOP STORIES (10)
D. WEEK IN THE ECONOMY (5)
E. WEEK IN EARNINGS (3)
F. NEXT WEEK SETUP
G. CHART OF THE WEEK
A. WEEK AT A GLANCE -> TOP
The S&P 500 rose 0.49% on the week and the number is close to meaningless: three of eleven sectors advanced, the broad NYSE Composite fell 0.58%, and small caps lost 1.51%. The dominant driver arrived in the last few hours of trading, when Kevin Warsh’s first Jackson Hole keynote as Fed Chair moved September from a hold to a live hike meeting and repriced the two-year 12.2 basis points while the ten-year finished the week unchanged. That leaves markets carrying a tightening path into a week in which a leading manufacturing gauge fell into contraction and a payroll benchmark revision landed roughly 262,000 jobs below consensus — policy and data no longer pointing the same way.
• Warsh made September a live hike meeting. The two-year closed +12.2 bps at 4.354%, its largest single-day rise since June 17, and Polymarket’s 2026 hike contract jumped twelve points on the week to 68% while at-least-one-cut odds fell to 11.2%.
• The week’s two biggest mega-cap moves were both earnings and both landed Thursday. Salesforce (CRM) +22.39% and CrowdStrike (CRWD) +13.78% led all mega-caps, against SanDisk (SNDK) −6.96% and Eli Lilly (LLY) −6.44% at the other end.
• Nvidia delivered $96.22bn and committed $279bn. A 4.28% revenue beat, a $108bn Q3 guide and supply commitments more than doubling carried Technology +3.09% on Thursday — and still left NVDA up only 1.32% on the week once Friday’s rate move took 4.56% back.
• Gold had its worst session since June 10. Down 3.34% on Friday and 3.50% on the week to $4,508.44, with silver −4.02% and the dollar +0.84%. In a week that put a rate hike on the table, no safe-haven bid appeared anywhere.
• Crude fell through four separate supply shocks. Brent −5.99% and WTI −3.70% despite new Iran sanctions, a stalled Hormuz corridor and roughly 17% of Russian refining capacity offline — while pump prices set a record for the calendar date and diesel ran 52% above a year ago.
• Chicago PMI collapsed 10.5 points to 47.1. The steepest monthly fall since the COVID shock, against a 58.3 consensus — and it landed on the same morning the Fed Chair said the central bank still has work to do on inflation.
1. The index stopped describing the market — the S&P rose 0.49% while the broad NYSE Composite fell 0.58% and only three of eleven sectors advanced, and Technology finished +1.22% while supplying seven of the ten largest weekly mega-cap gainers and four of the ten largest decliners.
2. The whole curve now prices off one person — three Fed officials warned on inflation on Thursday, one a sitting voter calling for an immediate hike, and the two-year moved eight tenths of a basis point; the Chair spoke on Friday and it moved 12.2, in a speech that also retired forward guidance as standing practice.
3. One economy running at two speeds, averaged into a statistic that describes neither — the Atlanta Fed’s Q3 nowcast turned back up to 4.6% on an investment component growing 14.5% that is overwhelmingly AI capital expenditure, in the same week Chicago manufacturing fell to 47.1 and July’s goods trade gap widened roughly $20bn past consensus on record capital-goods imports.
4. The market began charging for the composition of AI growth, not just its rate — Marvell grew revenue 37%, raised two fiscal years of outlook and lost 10.28% on a 90 basis-point gross-margin guide; Alibaba paid an 8.4% discount to raise $10.2bn for AI; SoftBank paid SOFR+275 with a step-up if OpenAI has not listed within a year.
 — Leading economic indicators. Accurate market forecasts. Apply for membership at join.recessionalert.com
B. WEEK IN MARKETS -> TOP
The week’s dominant catalyst was a speech: Kevin Warsh’s first Jackson Hole keynote as Fed Chair, in which he said the summer’s better inflation prints “do not tell me that underlying trends have meaningfully improved” and that the Fed has more work to do. September became a live hike meeting in one morning, and the front end repriced 12.2 basis points while the ten-year finished the week unchanged. What makes the week worth reading twice is where the damage went. The S&P 500 rose 0.49% and the index-level story is almost entirely uninformative: gold fell 3.50%, small caps 1.51%, and the broad NYSE Composite finished lower than it started. The second catalyst, Nvidia’s $96.22bn quarter and $279bn of supply commitments, produced Thursday’s one-sector melt-up and then met Friday’s rate move — which is how a semiconductor-equipment complex loses 4–5% on a day the index barely moves.
FRIDAY CLOSE & WEEK-ON-WEEK CHANGE — Fri, Aug 28, 2026:
MAJOR INDICES
Three of these six indices rose on the week and three fell, and the split runs along breadth rather than style: S&P, Dow and Nasdaq 100 up; transports, small caps and the NYSE Composite down. Thursday compressed the pattern into a single session, the S&P gaining 0.72% while the broad-market gauge fell 0.38%. No formal history signal crossed threshold — the large-cap-over-small-cap gap stopped just inside the silence band, at 1.99 points.
| Index | Fri Close | WoW Change | WoW % | Why It Moved (Week) |
|---|---|---|---|---|
| S&P 500 | 7,711.76 | +37.39 | +0.49% | Four sessions of drift resolved into Thursday’s Nvidia-led 0.72% jump, then gave a third of it back on Friday’s rate move. The net gain conceals a week in which only three of eleven sectors rose. |
| Dow Jones | 53,559.99 | +282.98 | +0.53% | The week’s most resilient index because it carries the least duration — banks bid on Friday’s hike odds offset what the semiconductor complex lost. |
| DJ Transportation | 21,378.75 | −191.51 | −0.89% | Fell in four of five sessions with no discrete catalyst on any of them. Its one green day, Wednesday, was the only session the Dow itself declined. |
| Nasdaq 100 | 29,433.43 | +124.57 | +0.43% | A full round trip: −0.97% Monday on the Samsung memory shock, +1.43% Thursday on Nvidia’s print, then Friday’s repricing erased most of the difference. |
| Russell 2000 | 2,972.37 | −45.50 | −1.51% | The week’s worst major index and the cleanest read on the rate story — Friday’s 1.39% drop on Warsh accounted for nearly the whole move. |
| NYSE Composite | 24,585.18 | −143.41 | −0.58% | The broad tape fell while the S&P rose. It was red in four of five sessions, including Thursday’s melt-up, when 8 of 11 sectors declined. |
VOLATILITY & TREASURIES
The whole week’s move in rates happened in one direction on one morning: the two-year added 12.2 basis points while the ten-year finished unchanged, flattening 2s10s from 49.9 to 37.5. That is the market pricing tighter near-term policy without conceding anything to long-run growth — and Warsh’s Jackson Hole keynote, not any data print, is the catalyst that produced it. The VIX is the dissent: it fell in four straight sessions to 14.42, so equity options are not yet pricing what the front end just did.
| Instrument | Fri Level | WoW Change | Why It Moved (Week) |
|---|---|---|---|
| VIX | 14.42 | −0.71 (−4.69%) | Rose Monday, then fell four straight sessions as event risk cleared — Nvidia Wednesday, Jackson Hole Friday. It did not rebuild after Warsh, which is the week’s clearest non-confirmation. |
| 10-Year Treasury Yield | 4.729% | −0.2 bps | Unchanged on the week to within a fifth of a basis point, having fallen 7.9 bps Tuesday and regained it Friday. The long end refused to price what the front end did. |
| 2-Year Treasury Yield | 4.354% | +12.2 bps | Every basis point arrived Friday. The front end had drifted lower through Thursday on soft data, then repriced the entire week in one session on Warsh’s keynote. |
| US Dollar Index (DXY) | 99.67 | +0.83 (+0.84%) | Gained on the rate differential, with more than half the move on Friday alone. The dollar was the mirror image of gold every session of the week. |
COMMODITIES
Precious metals lost more on Friday alone than they had gained in the four sessions before it, and the mechanism was the dollar rather than fear: DXY +0.84% on the week, gold −3.50%, silver −4.02%. The tell sits mid-week. On Thursday silver rose 1.76% while gold was flat and copper actually fell — an industrial bid arriving with no haven bid behind it. A week that put a rate hike on the table generated no safe-haven demand for the asset that normally receives it.
| Asset | Fri Price | WoW Change | WoW % | Why It Moved (Week) |
|---|---|---|---|---|
| Gold | $4,508.44/oz | −$163.62 | −3.50% | Held above $4,700 through Tuesday, then fell every remaining session — 3.34% on Friday alone, its steepest since June 10 — as real yields repriced. |
| Silver | $66.44/oz | −$2.782 | −4.02% | Outpaced gold’s decline on the industrial leg: it rose 1.76% on Thursday’s AI tape, then lost 4.31% on Friday. Two demand stories inside one week. |
| Copper | $6.54/lb | −$0.0418 | −0.64% | Barely moved on the week and slipped on Thursday’s risk-on session — the one metal levered to real activity declined to confirm the AI rally. |
| Platinum | $1,832.85/oz | −$58.85 | −3.11% | Tracked the precious complex lower without gold’s velocity; the smaller loss is the industrial component doing its job. |
| Bitcoin | $77,488.00 | −$34.00 | −0.04% | Flat to four decimal places after a $1,307 gain on Monday and a $2,583 loss on Friday. It traded its own narrative early in the week and equity risk appetite late. |
ENERGY
Crude spent the week discounting Middle East risk and ignoring everything else. WTI and Brent fell on the Iran sanctions package that was supposed to raise them, declined again as Oman and then Qatar brokered a Hormuz corridor, and closed Friday flat against three Russian refineries hit in a single night. Brent led the fall in both dollars and percent, compressing the transatlantic spread from $7.23 to $4.81. Henry Hub was the only contract here to rise, gaining on domestic balance without once tracking crude.
| Asset | Fri Price | WoW Change | WoW % | Why It Moved (Week) |
|---|---|---|---|---|
| Crude Oil (WTI) | $83.48/bbl | −$3.21 | −3.70% | Sanctions that landed soft did the work: −2.39% Monday on the announcement, −4.92% Tuesday as the country-by-country wind-down structure emerged, then a partial rebound Thursday. |
| Crude Oil (Brent) | $88.29/bbl | −$5.63 | −5.99% | Carried the whole Iran de-escalation trade, falling further than WTI in both dollars and percent and compressing the transatlantic spread from $7.23 to $4.81. |
| Natural Gas (Henry Hub) | $2.875/MMBtu | +$0.128 | +4.66% | The only energy contract higher on the week, with the bulk of it on Wednesday’s 2.94% jump on domestic supply and demand. It never once moved with crude. |
| Natural Gas (Dutch TTF) | $22.60/MMBtu | −$0.123 | −0.54% | A 3.98% Monday jump and a 3.53% Wednesday drop netted to nothing — European gas spent the week trading its own supply picture. |
S&P 500 SECTORS — WEEKLY ROTATION
The week’s two worst sectors are the year’s two best: Energy is still +35.89% year to date and Healthcare +23.77% over twelve months, and both gave back roughly two points. That is leadership pausing, not breaking. The single-name check makes it concrete — Eli Lilly (−6.44%) and AbbVie (−3.58%) are two of the ten worst weekly mega-caps and both sit in Healthcare, with ExxonMobil (−5.09%) supplying the third. Technology’s +1.22% is the more remarkable number, because it nets seven of the week’s ten largest mega-cap gainers against four of its ten largest decliners — a sector at war with itself.
| Sector | 1-Week | 1-Month | 3-Month | 6-Month | YTD | 12-Month |
|---|---|---|---|---|---|---|
| Communication Services | +1.26% | +4.01% | −7.18% | +0.45% | −0.50% | +11.32% |
| Technology | +1.22% | +5.67% | −1.11% | +27.71% | +23.81% | +32.21% |
| Financial | +0.95% | +1.18% | +11.25% | +12.17% | +8.42% | +13.20% |
| Utilities | −0.27% | −4.60% | −5.18% | −11.02% | −0.95% | +1.04% |
| Consumer Defensive | −0.33% | −1.72% | +1.18% | −7.28% | +6.96% | +5.11% |
| Consumer Cyclical | −0.62% | +4.96% | −2.98% | +0.81% | −2.74% | −0.39% |
| Basic Materials | −1.24% | +10.93% | +3.23% | −3.95% | +21.25% | +36.81% |
| Real Estate | −1.33% | −2.21% | +1.68% | +1.44% | +9.35% | +4.66% |
| Industrials | −1.49% | +1.16% | −3.28% | −3.23% | +11.26% | +13.91% |
| Energy | −2.12% | +2.95% | +7.77% | +10.56% | +35.89% | +37.87% |
| Healthcare | −2.18% | +3.58% | +12.35% | +6.31% | +9.90% | +23.77% |
TOP WEEKLY MOVERS:
Four of the five weekly gainers are software names and the fifth is Meta — a leaderboard far more concentrated than the sector rotation table above, where Technology and Communication Services led by barely a point each. The underlying horizon stack separates two trades that look identical: Salesforce’s 22.39% week leaves it −3.36% year to date and +0.58% over twelve months, a snap-back inside a flat year, while CrowdStrike’s 13.78% extends a run of +134.9% over six months and +97.65% on the year. Same catalyst evening, opposite positions. On the other side, SanDisk’s 6.96% loss is noise against +525.57% year to date; the decliners that matter are Lilly, AbbVie and Exxon — the two sectors that led 2026, pausing together.
TOP 5 WEEKLY GAINERS
| Ticker | Week | YTD | Year | Why It Moved |
|---|---|---|---|---|
| CRM | +22.39% | −3.36% | +0.58% | Fiscal Q2 results on Wednesday evening beat on revenue and raised full-year guidance, with combined Agentforce and Data Cloud ARR near $3.9bn and growing above 210%. The stock added 22.58% on Thursday. Ten brokers raised targets, and the same evening brought Claudeforce, an integration placing Salesforce’s sales stack inside Anthropic’s Claude. |
| CRWD | +13.78% | +86.36% | +97.65% | Reported record fiscal Q2 net new ARR of $333m, accelerating to 51% year-over-year growth, and raised full-year net-new-ARR guidance by 630 basis points. Shares rose 20.50% Thursday before profit-taking clipped 4.19% on Friday. |
| MSFT | +6.27% | +6.18% | +0.76% | No discrete company catalyst. Participation in the Nvidia-led AI bid, with the only company-specific event of the week an appearance at the Deutsche Bank technology conference on August 27 describing a shift in AI strategy. |
| META | +5.11% | −12.43% | −23.04% | The $16.7bn settlement with 29 state attorneys general, disclosed mid-trial on Wednesday, was read as removing an open-ended legal overhang rather than as a cost. Meta separately narrowed 2026 capital spending guidance to $130–145bn from $125–145bn. |
| PANW | +3.83% | +101.73% | +94.53% | Added 12.83% on Thursday on reports it is circling Cribl and ClickHouse, plus read-through from CrowdStrike’s results, then gave back 2.93% on Friday as investors de-risked ahead of its own September 1 report. JPMorgan, UBS and Cantor Fitzgerald all raised targets during the week. |
TOP 5 WEEKLY DECLINERS
| Ticker | Week | YTD | Year | Why It Moved |
|---|---|---|---|---|
| SNDK | −6.96% | +525.57% | +2,819.17% | Fell 6.49% on Monday alone when Samsung’s record KRW 90–110trn shareholder-return plan still disappointed and dragged the memory complex with it, compounded by reports Apple may qualify Chinese DRAM and NAND suppliers. The stock broke its 80-day moving average for the first time since August 13. |
| LLY | −6.44% | +9.30% | +60.47% | Fell 3.59% on Wednesday on employer coverage rollbacks for obesity treatments at PepsiCo and Starbucks, alongside disclosures that Q2 outperformance was aided by non-recurring US rebate and discount adjustments. Deutsche Bank’s Thursday downgrade of Novo Nordisk on the 2032 patent cliff extended the pressure across the GLP-1 complex. |
| XOM | −5.09% | +30.22% | +38.25% | Tracked Brent’s 5.99% weekly decline as the Iran sanctions package landed softer than positioned for, with Energy the second-worst sector on the week. The only company-specific disclosure was a Friday SEC filing to fully redeem XTO Energy senior notes due 2036, 2037 and 2038, which does not explain the magnitude. |
| GEV | −4.69% | +39.53% | +43.91% | A planned CFO transition — Kenneth Parks retiring, Claire McDonough incoming — kept a multi-session decline running, with a 4.39% drop on Friday. The Korean HVDC joint venture with LS Electric announced Wednesday lifted the stock 2.84% that day but did not hold. |
| KLAC | −4.59% | +44.47% | +96.35% | No single catalyst — a semiconductor-equipment positioning unwind that ran on Monday (−3.84%) and again on Friday (−4.48%), when Lam Research, Applied Materials and Nvidia all fell 4–5% together on the rate repricing. |
— Institutional-grade intelligence for serious investors. Apply for membership at join.recessionalert.comC. WEEK’S TOP STORIES -> TOP
Four threads, and three of them end in September. The Fed thread (#1, #6) is one speech doing two separate jobs — a rate path turned hawkish and a communication regime retired. The AI thread (#2, #5, #10) is a single buildout examined at three layers: the silicon, the software sold on top of it, and the debt underwriting both. The external-cost thread (#3, #4) is priced by governments rather than markets, one with a published date and one without. The remainder (#7, #8, #9) are unrelated repricings that share a calendar and nothing else.
BEARISH
1. Warsh’s Jackson Hole Debut Turns September Into a Live Hike Meeting — a Four-Day Hawkish Build That Detonated in One Friday Morning
The core facts:The week built the case in four instalments before the Chair delivered it. Tuesday, the Board published its July discount-rate minutes: on July 20 two Reserve Bank boards sought 4.00%; nine days later four did, Kansas City and Dallas having joined Cleveland and Minneapolis — one district wider than the 9–3 FOMC dissent disclosed. Wednesday, July PCE printed 3.7% year-over-year against a 3.6% consensus, with core in line at 3.3%. Thursday from Jackson Hole, Cleveland’s Beth Hammack said “now is the time to act,” Kansas City’s Jeff Schmid said he did not see current policy as restricting anything, and Chicago’s Austan Goolsbee said “everybody should be on edge.” Friday at 10:00 ET, Kevin Warsh said the Fed “must be confident that underlying inflation is moving to our objective… Otherwise, we have work to do,” and that the summer’s better readings “do not tell me that underlying trends have meaningfully improved.” The two-year closed at 4.354%, up 12.2 basis points, its largest single-day rise since June 17. CME FedWatch September hike odds moved from roughly 35% to between 46% and 57%; Polymarket’s 2026 hike contract jumped eleven points on the day and twelve on the week, to 68%. The target range is unchanged at 3.50%–3.75%.
Why it matters:The week’s real information is not that the Fed turned hawkish — four district boards and three dissenters had already said so. It is that the market ignored every one of them and then repriced the entire week in ninety minutes. Hammack is a sitting voter who called publicly for immediate action on Thursday and the two-year moved eight tenths of a basis point; the Chair spoke on Friday and it moved 12.2. A market that prices only the Chair is a specific and newly dangerous configuration, because the Chair has just told it he intends to say less (see #6). The transmission was clean and highly selective: gold −3.50% on the week, the Russell 2000 −1.51%, and banks bid on margin expectations, with Financials the third-best sector at +0.95% — see the sector rotation table in Section B. The curve did the rest of the talking, flattening from 49.9 to 37.5 basis points as the front end moved and the ten-year finished the week unchanged. That is tightening priced without any corresponding lift to long-run growth, which is the shape of a policy error being contemplated rather than a recovery being financed.
What to watch:The September 15–16 FOMC, which carries a Summary of Economic Projections, and the August employment report on Friday, September 4 (consensus +45K, unemployment 4.2%). One complication is unpriced: Governor Lisa Cook’s counsel wrote to the White House on Wednesday that there is “no legally cognizable cause” for her removal, so the September vote count is not yet settled.
UNCERTAIN
2. The AI Trade Ran a Full Cycle in Five Sessions — Chip Bear Market Monday, One-Sector Melt-Up Thursday, Duration Unwind Friday
The core facts:Monday, Samsung’s record KRW 90–110trn shareholder-return plan still disappointed and took the US memory complex with it — SanDisk −6.49%, Micron −5.85% — with the Philadelphia Semiconductor Index down about 3.5% and roughly 23% below its 52-week high, compounded by reports the administration may let Apple source DRAM and NAND from Chinese suppliers. Tuesday it round-tripped: AMD +4.91% on a Raymond James upgrade to Strong Buy at a $641 target, Marvell +4.84%, while Mizuho quietly cut four memory and equipment targets with every rating maintained. Wednesday, Nvidia reported $96.22bn of revenue against $92.27bn expected, guided Q3 to $108bn against $104.2bn, and disclosed supply commitments more than doubling to $279bn from $119bn — then traded down 1.3% after hours. Thursday it reversed to +8.74%, Technology gained 3.09% and supplied effectively the entire S&P 500 advance of 0.72%, while the NYSE Composite fell 0.38% and eight of eleven sectors closed red. Friday, four of the five largest mega-cap declines came from one group: Lam Research −5.24%, Nvidia −4.56%, KLA −4.48%, Applied Materials −4.34%. Marvell fell 10.28% having beaten on both lines and raised two fiscal years of outlook, on a gross-margin guide of 57.5%–58.5%.
Why it matters:The discovery this week was not that AI capital expenditure is slowing. Nvidia’s $279bn supply commitment is management’s own balance sheet betting the opposite, and it converts forward revenue from a demand forecast into a procurement schedule. The discovery is that AI equities carry a rates beta nobody had been charging for. A 12.2 basis-point move in the two-year transmitted into a 4–5% loss across semiconductor capital equipment on a day the S&P fell 0.25% — the longest-duration cash flows in the index, sold first and hardest. Marvell supplies the second half of the same lesson from a different direction: it grew revenue 37%, raised fiscal 2027 and 2028, and lost a tenth of its value because 90 basis points of gross margin went to custom-silicon mix. Against Nvidia’s 75.0% margin, that gap is the price of building to a hyperscaler’s specification. The market has begun charging for the composition of AI growth, not merely its rate. Note what the weekly closes conceal: Technology finished +1.22% and the Nasdaq 100 +0.43% — see the sector rotation table in Section B — which describes none of the week that actually happened.
What to watch:Broadcom’s fiscal Q3 after the close on Wednesday, September 2, at roughly a $1.75trn market capitalisation — the definitive test of whether custom-silicon margin dilution is a Marvell problem or a category problem. Separately, Politico reported Thursday, citing eight people, that the administration is weighing extending semiconductor duties to laptops, data-center servers and gaming hardware, with January’s data-center exemption possibly scrapped. No rate, no legal authority and no instrument exists yet, which is a reason to size the risk rather than dismiss it.
BEARISH
3. The US–Canada Tariff Wall Becomes Two-Way and Dated — C$27.6 Billion of Counter-Duties From September 8
The core facts:Monday, President Trump posted that from January 1, 2027 tariffs on all cars, trucks, automotive parts and steel “will be increased to 50%”; Ford fell about 4%, Stellantis about 4%, General Motors about 2%, and Tesla 3.81% on a stacked recall catalyst. No proclamation or Federal Register action accompanied it. The same morning USTR Jamieson Greer disclosed that the collapsed bilateral package would have “cut tariffs in half on steel, on aluminum” — and US steel equities rallied precisely because that cut was now off the table, Cleveland-Cliffs up roughly 7% and Nucor and Steel Dynamics roughly 4% each. Tuesday, Finance Minister François-Philippe Champagne announced Canada will match “dollar for dollar, rate for rate”: duties of 15%, 25% and 50% across roughly 700 tariff lines covering C$27.6 billion of US imports, effective September 8, with steel and aluminium doubled to 50%, alongside a C$7.5 billion relief package on top of nearly C$25 billion already provided. That answers the 50% US duties on roughly C$28 billion of Canadian goods that took effect August 22. Separately, Bloomberg reported a 7.5% China overcapacity tariff being prepared ahead of the September 24 Xi–Trump summit, which Reuters explicitly could not verify.
Why it matters:Monday was rhetoric aimed at 2027. Tuesday was a foreign government’s signed instrument with a published line schedule taking effect in fourteen days, and the difference between the two is the entire story. What the week then established is how little of it is in the price. Equities rose 0.32% the day Ottawa published the schedule; Industrials closed flat that session and ended the week down 1.49% for reasons that had nothing to do with trade. The only participants visibly marking the cost are the Canadian banks: Royal Bank raised its provision for credit losses 13.5% year over year to C$1.00bn in a quarter earnings rose 11%, and the stock fell 1.29% on a beat. That is a lender provisioning ahead of September 8 rather than after it, and it is the single cleanest evidence anyone has actually priced a two-way 50% wall between the world’s two largest trading partners. Note also the inversion Greer’s disclosure created: US steel now trades as a short position on a US–Canada deal, so every constructive negotiating headline from here is a headwind for the sector rather than a tailwind.
What to watch:September 8, and any CBP implementation guidance in the interim — exclusions, quotas and de minimis carve-outs are the mechanism by which a headline rate becomes an actual cost. Also whether the Section 301 excess-capacity report on China publishes before the September 24 summit, which would convert a single-outlet report into a rule.
UNCERTAIN
4. Every Bullish Catalyst Crude Could Get, and Brent Still Fell 5.99% — the Constraint Moved From Barrels to Refining
The core facts:Monday, Treasury launched “Operation Economic Outcast” — five OFAC sectoral determinations, roughly 25 individuals and more than 60 entities and vessels — while designating no major Chinese bank and penalising no third country; Bessent called it a “warning shot.” WTI fell 2.39%. Iran’s new Persian Gulf Strait Authority blacklisted 45 tankers including ADNOC and Bahri vessels, and a Houthi missile set the Bahri VLCC Amzan alight off Yanbu. Tuesday, WTI fell 4.92% and Brent 5.26% as Oman brokered a phased Hormuz corridor framework in Tehran; Ukrainian drones took roughly 290,000 b/d of Russian refining offline overnight. Wednesday, Iran confirmed a temporary seven-mile corridor agreed with Muscat, crude broke 3% lower, then round-tripped the entire move on a Bloomberg report that Moscow is weighing intensified strikes on Kyiv; Kpler counted five Hormuz transits against a ten-day average of fifteen. Thursday, Qatar entered as a third mediator and crude rose 1.61% anyway. Friday, three refineries were hit in one night — Rosneft’s Kuibyshev, Afipsky and Slavneft-YANOS — taking Reuters’ cumulative estimate to at least 17% of Russian refining capacity, with Bloomberg counting 21 strikes in August alone. WTI closed the session down 0.06%. Meanwhile the EIA put the national gasoline average at $4.085 on August 24 and on-highway diesel at $5.652, up 52% on the year, with distillate stocks 13–14% below the five-year seasonal average and refineries running at 97.4% of capacity.
Why it matters:Run four separate supply shocks through a market in five sessions and watch the price fall 4–6%, and the market has told you where the binding constraint is not. Two independent facts explain it. Goldman put Persian Gulf crude and product exports back at 15–16 million b/d, roughly two-thirds of pre-war levels and far above March’s trough, partly through dark crossings and ship-to-ship transfers — which caps flat price even while disruption persists. And drone strikes destroy conversion capacity rather than production, leaving more crude looking for a buyer and less refined product reaching one. The dislocation has migrated to the two places flat price cannot show it: freight, where Saudi-to-China supertanker earnings ran near $647,000 a day against roughly a tenth of that a year ago, and products, where diesel is 52% higher year over year with the US refining system already at 97.4% utilisation and no slack to absorb an outage of its own. For a US portfolio that is the uncomfortable configuration — a headline oil price that flatters the inflation print while the fuel that actually moves freight, agriculture and industry keeps rising. Energy was the second-worst sector on the week at −2.12% and ExxonMobil the third-largest weekly mega-cap decline at −5.09%; see the sector rotation and weekly movers tables in Section B.
What to watch:Diesel and gasoline crack spreads rather than crude flat price — that is where a 17% refining outage transmits. The EIA weekly status report on Wednesday for another distillate draw from an already depleted 103.4 million barrels, and Kpler’s Hormuz transit count against the fifteen-vessel baseline, which is what would validate the corridor as more than paper.
BULLISH
5. The Software Disintermediation Question Got Answered Both Ways in 48 Hours — and the Answer Sorted by Who Owns the System of Record
The core facts:Tuesday evening Intuit beat fiscal Q4 EPS by roughly 13% and then guided fiscal 2027 revenue to $23.28–23.51bn against consensus near $23.72bn — 9–10% growth against the 14% delivered in fiscal 2026 — with TurboTax guided to 2–3% against 7%. Wednesday it fell 3.24% and drew eleven price-target cuts in a morning, JPMorgan downgrading and taking its target from $605 to $331. The same day UBS cut SAP from Buy to Neutral while raising its target 23% to EUR 201, on 17 AI agents generally available and 15 ramping against a stated goal of 200 by year-end; the ADR fell 2.42%. Also Wednesday, Salesforce launched Claudeforce, embedding 37 pre-built sales skills directly inside Anthropic’s Claude — the first time it has applied its own suffix to another company’s product. Wednesday evening Salesforce and CrowdStrike both reported. Thursday, Salesforce rose 22.58%, CrowdStrike 20.50%, and Palo Alto Networks 12.83% on the read-through plus reported approaches to Cribl and ClickHouse.
Why it matters:The week ran a controlled experiment on the thesis that conversational AI collapses the value of application front-ends, and the results sorted with unusual cleanliness. What got marked down was software whose value sits in a workflow a model can reproduce — tax preparation, a configuration layer, an agent count that is 16% delivered with four months to run. What got re-rated was software that owns a system of record or a control point: Salesforce’s data, workflow and governance layer, and CrowdStrike’s Falcon Flex consumption vehicle at $2.29bn of ARR growing 101%. Claudeforce is the strategy stated out loud, and read carefully it is a concession as much as a product: Salesforce is not putting Claude into Salesforce, it is putting Salesforce into Claude, accepting that the seat a salesperson occupies may belong to Anthropic and defending the layer beneath it instead. That is a coherent answer to the question and an admission that the question is real. The weekly leaderboard is the receipt — four of the five largest weekly mega-cap gainers are software names, and Technology and Communication Services were the only two sectors to gain more than a point; see the sector rotation and weekly movers tables in Section B.
What to watch:Palo Alto Networks on Tuesday, September 1 and Snowflake on Wednesday, September 2 — the first tests of whether Thursday’s re-rating extends beyond the two companies that reported it. Also whether Microsoft, Workday or ServiceNow announce comparable stack-inside-someone-else’s-assistant integrations, which would make interface concession the sector’s default posture rather than one company’s bet.
UNCERTAIN
6. Warsh Retires Forward Guidance as Standing Fed Practice: “It Has Overstayed Its Welcome”
The core facts:In the same Friday keynote, and separately from the inflation message, Warsh announced a change to how the Federal Reserve communicates. Forward guidance “as a regular practice,” he said, “has overstayed its welcome.” He added that “transparency in communications about future policy decisions is not a virtue unto itself,” that “oversharing policy deliberations and overcommitting to future decisions can lead markets, businesses, and households astray,” and that in normal times its role “should be limited and circumscribed.” He declined to name a replacement: “you can call it an outline… you can call it a trail map… just don’t call it forward guidance.” He also rejected mechanical reaction functions, saying he wished the economy were understood precisely enough that a Taylor rule could be relied upon, and reasserted that “money matters” and that central banks should monitor monetary aggregates. The Board’s own 2026 archive contains exactly one Board of Governors speech in all of August — this one — after six clustered between July 13 and July 16.
Why it matters:This outlives the rate decision it shared a podium with. Forward guidance has been a core Fed instrument since 2008, and retiring it as standing practice removes the mechanism through which the committee has smoothed policy surprises for the better part of two decades. The mechanical consequence is that more of the information content of policy now arrives on decision days: realised volatility should rise around FOMC dates and fall between them, which is a specific and tradeable change in the term structure of rate and equity volatility rather than a rhetorical one. The week supplied the demonstration before the announcement explained it — three Fed officials warned on inflation on Thursday, one of them a sitting voter calling for immediate action, and the front end moved eight tenths of a basis point; the Chair spoke on Friday and it moved 12.2. Fewer, larger repricings is the regime that follows. It is graded uncertain rather than bearish because the trade cuts both ways: a committee that commits less can also change course faster without paying a credibility cost, which is precisely the flexibility Warsh claimed. The detail worth holding is the August speech drought — the practice changed six weeks before the speech that named it, so the market has already been operating in this regime without labelling it.
What to watch:The September 16 statement and press conference — specifically whether the forward-looking language is shortened or dropped, and whether the SEP dot plot survives in its current form. Option pricing around the meeting date is where this gets expressed before it gets confirmed.
BEARISH
7. Healthcare Was the Week’s Worst Sector, and Four Separate Attacks Each Hit a Different Leg of the Same Valuation
The core facts:Healthcare closed the week down 2.18%, the worst of eleven sectors, against +12.35% over three months and +23.77% over twelve. Wednesday, Eli Lilly fell 3.59% on employer coverage rollbacks for obesity treatments at PepsiCo and Starbucks, compounded by disclosures indicating Q2 outperformance was aided by non-recurring US rebate and discount adjustments; Merck fell 2.14% on the same session despite a Merck–Moderna Phase 3 melanoma win and an FDA sBLA acceptance for ENFLONSIA, and Moderna fell 5.46%. Thursday, Deutsche Bank cut Novo Nordisk from Hold to Sell citing the 2032 US patent cliff on Ozempic and Wegovy, with no price target disclosed, and Moderna launched a $2bn zero-coupon convertible — later upsized to $2.6bn — falling 4.60%. Friday, BioNTech dropped 8.37% after the Genentech-partnered adjuvant colorectal arm of autogene cevumeran was stopped for futility on a numerical overall-survival imbalance; the European Society of Cardiology’s rewritten guidelines gave semaglutide and tirzepatide a Class IIa recommendation in preserved-ejection-fraction heart failure with obesity, and not one affected name moved on it. Eli Lilly finished the week −6.44% and AbbVie −3.58%, two of the ten largest weekly mega-cap declines.
Why it matters:No single item here was large enough to move a sector, and the sector moved anyway — which means the connection is worth naming. Each development attacked a different leg of the same valuation. Employer coverage rollbacks reduce covered lives. A rebate and discount true-up reduces realised net price per script, and does so retrospectively, which lowers the earnings power the last print implied. The Novo downgrade attacks terminal value by putting a date on exclusivity. The BioNTech futility stop attacks the platform premium every mRNA name carries, and it does so on the harder signal — a survival imbalance rather than a simple efficacy miss. Shrinking covered lives and lower net price compound rather than offset. Merck is the diagnostic: a company that delivered a Phase 3 win and a regulatory acceptance on the same day still fell, and when good news cannot lift a name the marginal seller is positioning, not fundamentals. The ESC guideline moving nothing at all confirms it from the other direction. This reads as a crowded trade unwinding at the edges after a strong twelve months, not as a thesis breaking — see the sector rotation table in Section B for the horizon context.
What to watch:The pivotal ESMO presentation on October 23–27 in Madrid, where the Merck–Moderna melanoma data gets full peer scrutiny; further employer or PBM announcements withdrawing GLP-1 coverage; and Lilly’s next disclosure of net price realisation against volume growth in the incretin franchise, which is where the rebate question is settled.
UNCERTAIN
8. Meta Pays $16.7 Billion to 29 States and Accepts a Decade-Long Two-Hour Cap on Teen Accounts — and Finishes the Week Up 5.11%
The core facts:Disclosed in a court filing mid-trial on Wednesday. Meta will pay $16.7 billion to resolve claims by 29 state attorneys general that it designed Facebook and Instagram to addict minors, improperly captured data from children and misled the public about platform safety; reporting places aggregate exposure across related matters nearer $18 billion. The case was co-led by California’s Rob Bonta alongside Colorado, New Jersey and Kentucky, and Meta admitted no wrongdoing. The non-monetary terms are the substantive half and run for ten years: teen use of Facebook and Instagram restricted to two hours per day, access blocked entirely from midnight, expanded parental controls and raised age-verification standards. Shares traded a 6.5% intraday range on Wednesday — a $561.95 low against a $598.37 high — on 22.5 million shares against a 14.8 million average, and finished the week up 5.11%, the fourth-largest weekly mega-cap gain. Meta separately narrowed its 2026 capital spending outlook to $130–145 billion from $125–145 billion, with $10.8 billion reclassified into escrow under multi-year infrastructure purchase agreements not releasing until 2028–2030.
Why it matters:The cash is roughly a quarter’s free cash flow and close to beside the point. The decade-long engagement cap is not. A two-hour ceiling and a midnight blackout on the teen cohort is a permanent, court-supervised constraint on impressions in the demographic that seeds every subsequent cohort of users, and it is being imposed on the exact product surface Meta spent three years defending as a First Amendment and Section 230 matter. That defence has now been traded for finality. The market’s week-long verdict was that removing an uncapped legal tail is worth more than the constraint costs — but read the base before reading the reaction: Meta is −12.43% year to date and −23.04% over twelve months, so a 5.11% week is a discounted stock relieved of an overhang rather than a franchise being re-rated. The durable consequence is the template. Twenty-nine states have now established quantified time limits in a signed instrument, and TikTok, Snap and YouTube face substantially the same claims from substantially the same plaintiffs, which converts a company-specific settlement into an industry-wide design constraint with a known price.
What to watch:Whether Snap, Pinterest or Alphabet disclose settlement discussions with the same attorney-general coalition, and Meta’s next 10-Q for the first disclosed estimate of the revenue impact from the teen time limits — the number nobody currently has.
BEARISH
9. Advent and Stripe Walk From a $53 Billion PayPal Buyout — and the Stock Falls 12.71% From Above the Rejected Offer
The core facts:Bloomberg reported Friday, with Axios confirming, that the Advent International and Stripe consortium has abandoned its pursuit of PayPal. The offer was $60.50 per share, valuing the company at more than $53 billion. It was made in July, when PayPal traded near historic lows at roughly a $40 billion market capitalisation, and the board rejected it as undervaluing the company without sending a formal reply. PYPL closed at $53.66, down 12.71%, at a $45.90 billion market capitalisation and the session’s worst large-cap decline, having traded as much as 16% lower pre-market. The decisive number sits in the prior session: PayPal closed Thursday at $61.47 — above the offer it had turned down. Three brokers published the same day, all reacting to the collapse: Loop Capital cut its target to $50 from $62 and Mizuho to $51 from $60, both at Hold, while KBW maintained a Buy at $70. Mizuho’s Dan Dolev cited branded-checkout commoditisation, German market share loss and competition from X-Money. Bloomberg reported the buyers could return if circumstances change.
Why it matters:The board was vindicated on price and punished on outcome, and the distance between those two things is the lesson worth carrying. PayPal traded above the rejected offer on Thursday, so on the market’s own evidence the valuation judgement was correct — and the stock lost an eighth of its value the moment the bid disappeared, because what had been supporting the price was the bid rather than the business. Anyone holding a rumoured target should price that distinction explicitly. For the wider payments complex the read is unambiguous and negative: the most credible strategic and financial buyers in the sector examined a $53 billion take-private of the incumbent, and walked, at a moment when leveraged finance was demonstrably wide open — SoftBank launched a $10 billion term facility the same day (see #10). The constraint was not funding. It was the asset.
What to watch:Whether a revised approach materialises at a lower price now that the standalone case has been repriced, and whether PayPal announces a capital-return or strategic response before its next quarterly report.
UNCERTAIN
10. The Cost of AI Capital Gets Quoted Twice in One Week — Alibaba Pays an 8.4% Discount, SoftBank Pays SOFR+275
The core facts:Priced into Monday’s session, Alibaba sold 710 million new shares at HK$112.70, raising HK$80 billion (about $10.2 billion) — the largest primary follow-on ever by a Hong Kong-listed issuer and the third-largest globally in 2026 — at an 8.4% discount to the prior close, with 100% of net proceeds earmarked for “full stack” AI: chips, infrastructure, model development and deployment. The Hong Kong line closed down 9.67%, and Michael Burry disclosed in a Sunday Substack post that he had exited entirely on a return-on-invested-capital argument. The same session, SoftBank set out a ¥1 trillion (about $6.3 billion) seven-year retail bond, the largest ever by a Japanese issuer, with an indicative coupon of 4.3%–4.9% and pricing on September 4. Then on Friday SoftBank launched a $10 billion two-year recourse term facility at 275 basis points over SOFR, stepping up 25 basis points if OpenAI has not completed an IPO within twelve months, carrying a parent guarantee and a cash-collateral account with mandatory prepayment tied to the OpenAI valuation; Apollo and Sumitomo Mitsui joined Goldman Sachs, JP Morgan and Mizuho as arrangers. IFR describes it as the first substantial takeout of the $40 billion bridge maturing March 2027.
Why it matters:Two of the largest AI spenders outside the US mega-caps funded themselves inside one week, at opposite ends of the capital structure, and both prices carry information a portfolio can use. Alibaba generates cash and could have issued debt; it chose dilution and the market charged nearly 10% for it, which is the clearest available quotation on what the AI build-out costs an existing shareholder. SoftBank’s terms run the other way and are notably conservative for AI-adjacent paper — full recourse, a parent guarantee, cash collateral, and an IPO step-up that converts a private-company milestone into a contractual cash-flow trigger. Lenders there are financing SoftBank’s balance sheet, not OpenAI’s equity story, and they priced the exit explicitly. Set both against Nvidia’s $279 billion of supply commitments in the same week (see #2) and the pattern is a build-out whose demand side keeps expanding while its funding side becomes visibly more structured and more expensive. Neither transaction is distress. Both mark the end of the cheap-capital phase, and Burry’s reasoning is the part that generalises — a returns-on-capital argument travels across the sector in a way a price target does not.
What to watch:Final pricing on SoftBank’s retail bond on September 4 and where in the 4.3%–4.9% range the coupon lands — the top of the range would say retail demand is thinner than the record size implies. Also whether the remaining roughly $30 billion of the bridge refinances on comparable terms before March 2027, and whether the next large AI-capex equity raise is forced to repeat Alibaba’s discount.
— Separating signal from noise since 2007. Apply for membership at join.recessionalert.comD. WEEK IN THE ECONOMY -> TOP
The week delivered a stagflation pulse in its textbook form: headline PCE printed 3.7% against a 3.6% consensus on Wednesday, and on Friday the Chicago Business Barometer collapsed 10.5 points to 47.1 — its steepest monthly fall since the COVID shock and more than ten points below expectations — while the preliminary payroll benchmark revision came in some 262,000 jobs worse than consensus called for. What separates this week from an ordinary stagflation scare is that the Fed chose a side, which is the second tension: policy-vs-data divergence, resolved in favour of inflation. Markets ratified it without hesitation. The two-year added 12.2 basis points on the week while the ten-year finished unchanged, Polymarket’s 2026 hike odds rose twelve points to 68% and at-least-one-cut odds fell 3.3 to 11.2%, and gold lost 3.50%. Tuesday’s ISM Manufacturing print, consensus 55.3, decides whether Chicago was a regional accident or a national lead.
POLYMARKET ODDS — WEEK-ON-WEEK SHIFT:
| Market | Last Friday | This Friday | Δ |
|---|---|---|---|
| US Recession by end-2026 | 8.0% | 8.0% | 0.0 pp |
| Fed rate hike in 2026 | 56.0% | 68.0% | +12.0 pp |
| Fed rate cuts ≥1 in 2026 | 14.5% | 11.2% | −3.3 pp |
UNCERTAIN
1. Headline PCE Accelerates to 3.7% While Core Holds In Line at 3.3%, and Q2 GDP Is Confirmed at 1.5% (BEA, Wed Aug 26)
What they’re saying:Real GDP grew at a 1.5% annualised rate in Q2’s second estimate, unchanged from the advance reading and down from 2.1% in Q1. The PCE price index rose 0.2% in July, lifting the year-over-year rate to 3.7% — a tenth above the 3.6% consensus — while core PCE held in line at 3.3%. Personal income (+0.4%) and spending (+0.2%) both beat estimates, and Q2 corporate profits jumped 8.2%.
The context:The print moved almost nothing on the day — the S&P closed −0.02%, the ten-year added a single basis point and the VIX actually fell 1.55%. That non-reaction was not calm; it was a market that had stopped trading releases directionally and was waiting for the person who decides. Two days later Warsh cited these exact readings as failing to show that underlying trends had meaningfully improved, and the two-year moved 12.2 basis points — see the Volatility & Treasuries table in Section B. The week’s lesson is that the data was necessary and not sufficient: headline inflation at nearly double target supplied the Chair his premise, and core landing in line supplied the market its excuse to ignore him for forty-eight hours.
What to watch:The August core PCE print in late September, against the Cleveland Fed’s 3.40% nowcast. A confirmed acceleration above July’s 3.3% would put the September hike beyond argument.
BEARISH
2. Chicago Business Barometer Craters to 47.1, the Steepest Monthly Drop Since COVID (MNI, Fri Aug 28)
What they’re saying:The MNI Chicago Business Barometer plunged to 47.1 in August from 57.6 in July, badly missing the 58.3 consensus — a 10.5-point month-over-month collapse, the largest single-month drop since the COVID shock and the lowest reading of 2026. A sub-50 print signals outright contraction in Chicago-area manufacturing and business activity.
The context:It landed on the same morning as the Jackson Hole keynote, and every instrument that repriced on Friday repriced for a tighter Fed rather than a weaker economy: the two-year rose 12.2 basis points, the dollar gained 0.51%, gold fell 3.34% and September hike odds went up. A market pricing a manufacturing contraction produces the opposite of all four. The only readings consistent with a growth scare — the Russell 2000’s 1.39% decline and Utilities falling 1.12% despite their defensive character — are equally well explained by the rate move itself. Chicago leads the national ISM, and the size of the miss is what makes the conflict live rather than academic: the Fed signalled tightening in the same week a leading manufacturing gauge went into contraction.
What to watch:ISM Manufacturing PMI on Tuesday, September 1, consensus 55.3. A confirming print anywhere near 50 would put the Fed’s hawkish turn and the manufacturing cycle into open conflict for the first time this cycle.
BEARISH
3. Two Consumer Surveys, One Direction — Expectations at 68.2 Below the Conference Board’s Own Recession Line, Michigan at 51.7 (Conference Board, Tue Aug 25 / University of Michigan, Fri Aug 28)
What they’re saying:Conference Board Consumer Confidence fell to 89.4 in August from a downwardly revised 90.2, missing the 90.2 consensus and marking a second straight monthly decline to a seven-month low. The forward-looking Expectations Index dropped 5.8 points to 68.2 — below the level of 80 the Conference Board itself flags as historically preceding a recession within twelve months — while Present Situation rose 6.8 points to 121.2. On Friday the University of Michigan’s final August sentiment index came in at 51.7, above the 51.0 consensus but down from July’s 55.2: a roughly 6% monthly fall and an 11% drop from a year ago, which survey director Joanne Hsu attributed to persistent worries that inflation will stay elevated.
The context:Both surveys beat or missed on the headline in confusing ways and agree completely on the trend, which is the useful reading. A Present Situation gain against an Expectations collapse describes households who are managing now and expect not to be; Michigan’s beat-against-a-6%-monthly-fall says the same thing with different arithmetic. Corporate confirmation arrived inside the same week: Dick’s Sporting Goods cut every line of full-year guidance on its Foot Locker unit and fell 30.68%, dragging Nike down 3% and Lululemon 4% on no news of their own, and July new home sales fell 10.5% to a 607,000 pace, the weakest since January. What the market did with all of it is the tell — Consumer Cyclical closed the week −0.62% and Consumer Defensive −0.33%, neither a rout, and see the sector rotation table in Section B for how ordinary that ranks.
What to watch:Michigan’s September preliminary reading and its year-ahead inflation expectations, which feed directly into Fed deliberations, plus August retail sales for the first hard confirmation of what both surveys are forecasting.
UNCERTAIN
4. The Labour Market’s Two Faces: Claims Fall to 203K, Then the Benchmark Revision Misses Consensus by Roughly 262,000 Jobs (Dept. of Labor, Thu Aug 27 / BLS, Fri Aug 28)
What they’re saying:Initial jobless claims fell to 203,000 for the week ended August 22, below the 208,000 expected and down from a revised 207,000, extending a run of historically low readings since mid-July’s 189,000; continuing claims eased to 1.778 million from 1.796 million. The next morning the BLS’s preliminary annual benchmark revision lowered the March 2026 nonfarm payroll count by 79,000 (−0.1%), with private-sector employment revised down a larger 178,000, against a Bloomberg consensus that had expected an upward revision of 183,000 — roughly a 262,000-job negative surprise. Last year’s revision subtracted about 911,000.
The context:A benchmark revision landing on the same morning as a hawkish Chair keynote is close to a natural experiment in what this market actually prices, and it returned an unusually clean answer: no rates instrument moved in the direction the data pointed. The two-year rose 12.2 basis points and September hike odds went up. For most of two years soft labour data reliably bid the front end; on Friday it did not move it at all, which says the employment leg of the dual mandate is not the binding constraint right now. That has a positioning consequence — labour disappointments are currently a weaker hedge against rate risk than they have been — and a measurement one. If the March level was overstated, every subsequent monthly print is being measured off a base that is too high, flattering the run rate at precisely the moment the Fed has stopped weighting it.
What to watch:The August employment report on Friday, September 4 — consensus roughly +45,000 payrolls with unemployment expected to rise to 4.2% — and specifically whether a miss moves the two-year at all, which is the direct test of whether Friday’s non-reaction was a one-off or the new regime.
UNCERTAIN
5. The Atlanta Fed’s Q3 Nowcast Turns Back Up to 4.6% Against a Confirmed Q2 of 1.5% — and Cleveland’s Says Inflation Is Re-Accelerating Too (Atlanta Fed / Cleveland Fed, Wed Aug 26)
What they’re saying:GDPNow lifted its Q3 2026 real GDP estimate to 4.6%, from 4.0% on August 18, with the Q3 nowcast for real personal consumption growth rising from 2.5% to 3.1% and real gross private domestic investment from 13.7% to 14.5%. The series had fallen all month — 6.2% on August 3, 5.9% on the 4th, 4.3% on the 14th, 4.0% on the 18th — and then turned. Separately, the Cleveland Fed’s inflation nowcast has August core PCE running at 3.40% year-over-year and CPI at 3.37%, both above the July core PCE of 3.3% that printed the same morning.
The context:Two Reserve Banks’ own models now point at growth and inflation re-accelerating into the September FOMC, which is the single configuration that makes a hike defensible rather than merely feared — and it flatly contradicts the consumer and manufacturing evidence in the boxes above. The gap between a confirmed 1.5% for Q2 and a 4.6% nowcast for Q3 is far too wide to be noise. The honest reading is that GDPNow is being driven by an investment component growing 14.5%, overwhelmingly AI capital expenditure: the same spending Nvidia sized at $279bn of supply commitments that same evening, and the same physical flow that widened July’s goods trade deficit to $118.8bn on an 11.3% jump in capital-goods imports including a 68.7% surge in Korean semiconductor shipments. That is one economy running at two speeds, averaged by a statistic that describes neither — and a portfolio manager should read 4.6% as a statement about datacentre construction rather than about the household.
What to watch:The next GDPNow update and whether 4.6% holds or resumes falling, and whether August capital-goods imports stay near record pace in the advance trade report due mid-September.
— Know the probability before the market prices in the risk. Apply for membership at join.recessionalert.comE. WEEK IN EARNINGS -> TOP
TOP EARNINGS OF THE WEEK
BULLISH
1. Salesforce (CRM): +22.39% on the week | Guidance Raised and Agentforce ARR Up 210% — With a $2.6 Billion Mark Inside the EPS Line
The Numbers:Fiscal Q2 2027, released after the close Wednesday, August 26. Revenue $11.35bn against $11.32bn expected, up 11% year over year, with subscription and support revenue $10.8bn, up 12%. Non-GAAP diluted EPS $5.90 against a $3.27 consensus and GAAP EPS $4.29 — both including a $2.6bn gain on strategic investments arising from the company’s Anthropic stake. Full-year FY27 revenue guidance raised to $46.1bn–$46.4bn from $45.9bn–$46.2bn, with fiscal Q3 guided to $11.42bn–$11.50bn. Combined Agentforce and Data Cloud ARR reached nearly $3.9bn, up more than 210% year over year.
The Problem/Win:Separate the two halves. The operating quarter is good rather than spectacular — 11% growth, a $30m revenue beat and a $200m raise to the full-year range — and the EPS headline should be read with the $2.6bn Anthropic mark stripped out, because a mark-to-market on a private position is not operating performance. The genuine win is $3.9bn of agent ARR growing above 210%, which is the first datapoint of real scale showing an incumbent converting AI product into recurring revenue rather than describing it.
The Ripple:Ten firms raised targets — Deutsche Bank to $275, Loop Capital $270, JP Morgan and Mizuho $265, BMO $260, UBS $240, Morgan Stanley $235, Citigroup $233, Wells Fargo $230, Bernstein $195. This was the largest weekly mega-cap gain on the board and the anchor of a software cohort re-rate that also carried CrowdStrike and Palo Alto Networks. Salesforce announced Claudeforce with Anthropic the same evening, with no commercial terms disclosed.
What It Means:An 11% revenue grower re-rating 22% in a week is the market repricing terminal growth rather than the quarter. Read the horizon stack before sizing it: the week leaves the shares still −3.36% year to date and +0.58% over twelve months, so this is a laggard restored to roughly flat, not a leader extending a run. The equity now rests on one disclosed number compounding from a $3.9bn base.
What to watch:Whether the next quarter separates Agentforce ARR from Data Cloud — the combined disclosure makes the growth rate impossible to attribute, and management will be asked — and how much of the fiscal Q3 guide assumes a Claudeforce contribution.
BULLISH
2. NVIDIA (NVDA): +1.32% on the week | A $96 Billion Quarter, a $108 Billion Guide, and Supply Commitments That More Than Doubled to $279 Billion
The Numbers:Fiscal Q2 2027, released after the close Wednesday, August 26. Revenue $96.22bn against $92.27bn expected, a 4.28% beat, up 18% sequentially and 106% year over year from $46.7bn. Adjusted EPS $2.22 versus $2.09; GAAP EPS $2.46 against $2.11. GAAP and non-GAAP gross margins both 75.0%. Data Center revenue $89.0bn, up 117% year over year and now 92% of total company revenue. Q3 guidance $108bn plus or minus 2%, against roughly $104.2bn consensus. Supply commitments more than doubled to $279bn from $119bn the prior quarter, primarily memory procurement. The shares fell about 1.3% in extended trade, rose 8.74% to $227.98 on Thursday, then lost 4.56% to $217.59 on Friday.
The Problem/Win:The line that matters is not on the income statement. A supply-commitment figure that doubles to $279bn is management putting its own balance sheet behind a demand curve it expects to keep bending upward, and it converts forward revenue from a forecast into a procurement schedule. The problem is where the bar now sits: a $3.9bn revenue beat and a $3.8bn guidance raise produced a negative after-hours print, which says expectations have caught up with delivery and the company must beat a trajectory set by itself rather than by analysts.
The Ripple:Thursday’s reversal carried the entire market: Technology closed +3.09% and supplied effectively the whole S&P 500 gain of 0.72%, with Broadcom +4.49% and Intel +4.36%. Twelve firms raised targets, Bernstein to $400 from $315 at the top. The $279bn memory commitment reads straight through to SK Hynix, Micron and Samsung, and a Q3 guide implying roughly $100bn of quarterly Data Center revenue flows into the grid and electrical complex behind it. It also puts a number on the investment component that lifted the Atlanta Fed’s Q3 nowcast to 4.6% — see Section D.
What It Means:Two sessions after the strongest print of the week the stock is up 1.32% on the week, and that is not a verdict on the quarter. It is Friday’s rate move taxing the longest-duration asset in the index. The quarter is unambiguous and the supply commitment is the most credible forward signal available on AI capital expenditure, precisely because it is the company’s own capital at risk against 2027 demand.
What to watch:Whether the 75.0% gross margin holds as the $279bn memory commitment converts into cost of goods, and Broadcom’s report on Wednesday, September 2 as the custom-XPU cross-check on the same demand.
BULLISH
3. CrowdStrike (CRWD): +13.78% on the week | Record Net New ARR of $333 Million, Accelerating to 51% Growth, and a 630 Basis-Point Guidance Raise
The Numbers:Fiscal Q2 2027, released after the close Wednesday, August 26. Revenue $1.47bn against $1.44bn expected, up 26% from $1.17bn a year earlier; adjusted EPS $0.31 versus $0.29. Annual recurring revenue $5.84bn at July 31, up 25% year over year. Net new ARR of $333m was a record and accelerated to 51% year-over-year growth. Operating cash flow $530.3m against $332.8m; free cash flow $377.4m against $283.6m. Falcon Flex ending ARR exceeded $2.29bn, up 101%. Full-year FY27 revenue guidance $5.99bn–$6.01bn against $5.94bn consensus, with FY27 net new ARR growth guidance raised 630 basis points to 34% at the midpoint. Shares rose 20.50% Thursday to $227.96 and gave back 4.19% on Friday.
The Problem/Win:Net new ARR governs this business and it accelerated rather than merely grew — 51% growth in the incremental number on a base already at $5.84bn, delivered alongside a 630 basis-point raise to the full-year growth guide. That is the strongest combination the company can produce. Falcon Flex is the delivery mechanism, and its ARR doubling to $2.29bn is what platform consolidation looks like when it works rather than when it is described.
The Ripple:Nine firms raised targets, Citigroup and RBC to $260 at the top. The read-through made this a sector event rather than a company one: Palo Alto Networks added 12.83% on Thursday partly on this print, and the whole cybersecurity cohort re-rated with it. It is also the week’s sharpest counterexample to the disintermediation case running through Intuit and SAP — security is a software category where AI adoption creates incremental demand instead of substituting for the vendor, and this quarter put a number on that at 101% growth in the flagship consumption vehicle.
What It Means:Unlike Salesforce, CrowdStrike’s week extends an existing run rather than repairing one — +86.36% year to date and +97.65% over twelve months, so 13.78% is momentum continuation, not a snap-back off a laggard. Two headline weeks of similar size, two entirely different positions, and anyone sizing them off the percentage alone will get it wrong.
What to watch:Palo Alto Networks on Tuesday, September 1 — the direct test of whether this is category growth or share taken from a competitor. Falcon Flex attach rates are the metric where the difference would show.
WEEK AHEAD PREVIEW:
Q2 2026 earnings season is effectively complete at 97% reported. The coming week is a short, concentrated tail: no company above $100 billion reports on Monday, Thursday or Friday, and every name below lands across Tuesday and Wednesday.
Palo Alto Networks (PANW) — AMC, Tuesday, September 1 — consensus $0.98 EPS on $3.35B revenue, $302.85B market cap. Key focus: platformisation attach rates and next-generation security ARR, and management’s posture on the reported approaches to Cribl and ClickHouse that added 12.83% to the stock on Thursday. Jefferies raised its target to $450 from $335 on Friday; shares closed -2.93% today.
Dell Technologies (DELL) — AMC, Tuesday, September 1 — consensus $4.91 EPS on $44.93B revenue, $295.77B market cap. Key focus: AI server backlog conversion and, more pointedly after Marvell, the gross margin earned on it — Dell’s AI systems mix has been the clearest case study in whether AI infrastructure revenue is profitable revenue.
Medtronic (MDT) — BMO, Tuesday, September 1 — consensus $1.39 EPS on $9.55B revenue, $116.77B market cap. Key focus: diabetes and cardiac rhythm segment growth, plus any commentary on the ESC’s rewritten heart failure guidelines, which upgraded durable mechanical circulatory support and left ICD indication expansion unsupported by Friday’s CMR GUIDE result. TD Cowen raised its target to $110 from $100 on Friday; shares closed +1.38% today.
Broadcom (AVGO) — AMC, Wednesday, September 2 — consensus $3.22 EPS on $29.24B revenue, $1,754.55B market cap. Key focus: custom AI accelerator (XPU) revenue and the gross margin attached to it, read directly against Marvell’s 57.5%-58.5% guide. At $1.75 trillion this is the single most consequential print of the week and the definitive test of the custom-silicon margin question.
Snowflake (SNOW) — AMC, Wednesday, September 2 — consensus $0.45 EPS on $1.48B revenue, $113.68B market cap. Key focus: product revenue growth, net revenue retention and consumption trends — the cleanest available read on whether enterprise AI workloads are translating into incremental data platform spend.
Q3 2026 earnings season begins mid-to-late October.
— US market commentary trusted by family offices and institutions. Apply for membership at join.recessionalert.comF. NEXT WEEK SETUP -> TOP
UPCOMING RELEASES:
| Date | Event | Why It Matters |
|---|---|---|
| Mon Aug 31 | Dallas Fed Manufacturing Index (prior 1.3) | The first regional read after Chicago collapsed 10.5 points into contraction, and the cheapest available check on whether that was a Chicago problem or a national one — a day before ISM answers it properly. |
| Tue Sep 1 | ISM Manufacturing Employment (prior 52.8) | A labour reading inside a manufacturing survey, three days before payrolls. If a factory slowdown is real, hiring intentions are where it shows before headcount does. |
| Tue Sep 1 | ISM Manufacturing PMI (expected 55.3) | The week’s decisive print. Chicago fell into contraction at 47.1 on Friday while consensus here sits more than five points above neutral — there is no scenario in which both surveys are describing the same economy, and the September FOMC has to choose. |
| Tue Sep 1 | JOLTs Job Openings (prior 7.359M) | The vacancy side of the low-hire, low-fire labour market that jobless claims at 203K describe from the firing side. A break below 7 million would be the first genuine crack in the story claims keep telling. |
| Tue Sep 1 | API Crude Oil Stock Change (prior 4.2M) | The private read that precedes Wednesday’s EIA. With crude falling through four separate supply shocks this week, the build says whether barrels are genuinely returning to market or the price is simply ignoring them. |
| Wed Sep 2 | MBA 30-Year Mortgage Rate (prior 6.78%) | The consumer-facing transmission of Friday’s 12.2 basis-point front-end move, and the variable that decides whether July’s 10.5% collapse in new home sales extends into August. |
| Wed Sep 2 | ADP Employment Change (prior 44K) | A private payroll read two days ahead of the BLS, off a prior of just 44K — and the first labour datapoint since the benchmark revision put the level everything is measured from in doubt. |
| Wed Sep 2 | Factory Orders MoM (prior −0.3%) | The follow-through on durable goods, where the 1.1% headline beat rested on an aircraft rebound while core capital-goods orders undershot at 0.2% against 0.9% expected. This is where that divergence resolves. |
| Wed Sep 2 | EIA Crude Oil Stocks Change (prior 0.095M) | Tests Goldman’s estimate that Persian Gulf crude and product exports have recovered to 15–16 million b/d — the single fact most responsible for capping flat price while the disruption headlines kept coming. |
| Wed Sep 2 | EIA Gasoline Stocks Change (prior −2.536M) | More consequential than the crude number this month. Stocks sit 6% below the five-year average with refineries already at 97.4% utilisation, and the national pump average has touched a record for the calendar date. |
| Thu Sep 3 | Balance of Trade (prior −$73.3B) | July’s advance goods gap widened to $118.8bn, nearly $20bn worse than consensus, on record capital-goods imports. The full report shows whether the AI build-out is still the whole explanation. |
| Thu Sep 3 | Exports (prior $314.7B) | A third consecutive monthly decline in July. With Canada’s C$27.6bn counter-tariffs effective September 8, this is the last clean pre-tariff baseline US exporters will get. |
| Thu Sep 3 | Imports (prior $388.0B) | The other half of the same arithmetic, and the precise flow the reported chip-tariff expansion would tax if January’s data-center exemption is scrapped. |
| Thu Sep 3 | Initial Jobless Claims (prior 203K) | The one series that has contradicted every soft survey of the past fortnight. A fourth straight low print keeps the labour leg of the mandate out of the September argument entirely. |
| Thu Sep 3 | ISM Services PMI (prior 54.1) | Services carried August’s 52-month-high composite while manufacturing cooled. If services softens too, the bifurcated read that has held all year stops working and the growth debate changes shape. |
| Fri Sep 4 | Average Hourly Earnings MoM (expected 0.2%) | The wage input to a Fed that has just declared inflation the binding constraint. A 0.2% consensus leaves no room for an upside surprise to be read as benign. |
| Fri Sep 4 | Average Hourly Earnings YoY (prior 3.2%) | Half a point below headline PCE at 3.7%, which means real wages are still shrinking — the arithmetic underneath Michigan sentiment being 11% lower than a year ago despite a headline beat. |
| Fri Sep 4 | Non Farm Payrolls (expected 45K) | The nearer test of Friday’s repricing. The question is not the number but whether a miss moves the two-year at all, after a 262,000-job benchmark surprise moved nothing. |
| Fri Sep 4 | Participation Rate (prior 61.4%) | A falling participation rate is what makes an unemployment rate look better than the hiring beneath it — and the benchmark revision has already put the underlying level in question. |
| Fri Sep 4 | Unemployment Rate (expected 4.2%) | Expected to rise. A Fed hiking into a rising unemployment rate is exactly the configuration the curve flattened on this week, and the one it would have to unwind violently if the growth side wins. |
WHAT TO WATCH NEXT WEEK:
1. Does Tuesday’s ISM confirm Chicago — and if it does, has the Fed already committed? Chicago fell 10.5 points into contraction on the same morning Warsh put September in play, and consensus for ISM sits at 55.3. There is no reading in which both surveys describe the same economy, and the September FOMC arrives carrying a Summary of Economic Projections that has to reconcile them.
2. Broadcom reports Wednesday: is custom-silicon margin dilution a Marvell problem or a category problem? Marvell beat on both lines, raised two fiscal years of outlook, and lost a tenth of its value on a 90 basis-point gross-margin guide. Broadcom is roughly eight times the market capitalisation running the same model, and the answer decides whether the market keeps charging AI names for the composition of their growth rather than its rate.
3. With forward guidance retired, where does the volatility go? If more of the policy signal now arrives on decision days, options struck around September 16 are cheap relative to the weeks either side. A VIX at 14.42 after a 12.2 basis-point move in the two-year suggests nobody has adjusted for that yet.
4. Does anything actually price September 8? Canada’s C$27.6bn counter-tariffs take effect in ten days across roughly 700 lines at 15%, 25% and 50%. The only participants visibly marking the cost this week were Canadian banks provisioning ahead of it; US industrial, agricultural-equipment and appliance names have not moved.
— US market commentary trusted by family offices and institutions. Apply for membership at join.recessionalert.comG. CHART OF THE WEEK -> TOP
WHY THIS CHARTFour of the week’s five charts examined the Fed or the historical record; this one examined the gap between a headline number and the economy underneath it, which is the exact tension the week went on to resolve. It won because it was published the morning before Warsh spoke and had already named the configuration that made his keynote possible — a 1.5% GDP print concealing 4.2% growth in what American households and businesses actually bought, with core inflation at 3.3% and September priced for a hike rather than a cut.
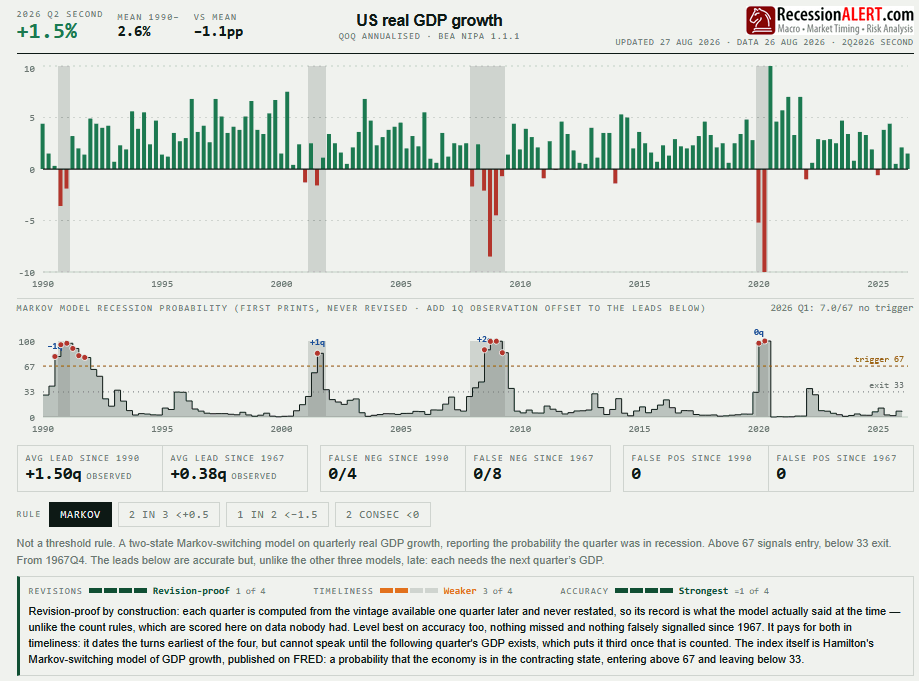
ORIGINAL CHART ANALYSIS — FROM THURSDAY’S MIBThe headline decelerated. The economy did not. Real GDP grew 1.5% in the second quarter, unchanged in yesterday’s second estimate and down from 2.1% in the first. But GDP counts production, and it deducts imports and swings in inventories. Strip those out and what American households and businesses actually bought grew 4.2% — revised up from 3.9%. Net exports cost the headline 1.14 points, slower stock-building another 0.72. BEA said it plainly: stronger consumer spending, partly offset by an upward revision to imports. The same appetite that lifted demand pulled in the foreign goods that get deducted from it. Count the same economy from income rather than purchases — wages, profits and rents — and it grew 2.2%, against 1.2% in the first quarter. The two measures swapped places, and averaged, as BEA publishes them, the economy went slightly faster: 1.8% against 1.7%. Corporate profits rose $400.9bn, after $74.4bn. Which is why September is priced near 40% for a hike, not a cut, with core inflation at 3.3%, and why Warsh’s Jackson Hole debut tomorrow matters more than a 1.5% print suggests. The recession probability below sits at 7 against a trigger of 67. The one crack: durables, equipment and housing were marked down in the release that marked demand up. Not a slowing economy. A slowing measurement of a fast one. What it means: the number that made headlines yesterday understates what Americans are actually spending, and the Fed knows it. If you are positioned for rate cuts — long-dated bonds, or shares that do well when borrowing gets cheaper — this release argues the other way. Watch durable goods and business equipment: both shrinking in the same quarter, which last happened in 2021, is what would change it.
MIB Weekly Digest Ver. 1.99
For professional investors only. Not investment advice.
© 2026 RecessionALERT.com

Comments are closed.