
MIB WEEKLY DIGEST
Week of Sep 21–25, 2026
The 10-year Treasury closed Thursday at 5.225%, its highest since 2007, after a flash PMI at 58.4 and eight Fed speakers pushed October hike odds to roughly 70% — and yet the S&P 500 finished the week up 1.21%. That gain belonged to almost nobody: the Nasdaq 100 rose 3.25% on Meta (+12.90%), Qualcomm (+13.65%), Intel (+13.26%) and AMD (+12.65%), while the NYSE Composite and the Russell 2000 both fell. Oracle lost 7.12% on a force-majeure notice over its New Mexico data centre. Brent rose as WTI fell almost 7%, and Michigan’s inflation expectations jumped to 4.6%.
TABLE OF CONTENTS
A. WEEK AT A GLANCE
B. WEEK IN MARKETS
C. WEEK’S TOP STORIES (9)
D. WEEK IN THE ECONOMY (5)
E. WEEK IN EARNINGS (1)
F. NEXT WEEK SETUP
G. CHART OF THE WEEK
A. WEEK AT A GLANCE -> TOP
The S&P 500 gained 1.21% and the Nasdaq 100 3.25% in a week the NYSE Composite and the Russell 2000 both finished lower — a headline advance owned by a handful of mega-caps. The driver was the bond market: a flash composite PMI at 58.4, the fastest private-sector growth since July 2021, took the 10-year to 5.225% on Thursday, its highest close since 2007, and eight Fed speakers in five sessions moved October hike odds to roughly 70%. That leaves the index nine days from an August core PCE print that will largely settle whether the Fed moves again on October 27–28, with the long end already refusing a tripled Treasury buyback.
• The 10-year added 16.9 bps to 5.167% and the 30-year closed at 5.49%, a level last seen in 2004 — two coupon auctions tailed, indirect bidders retreated at both, and Treasury accepted only $4.078bn of the $10.468bn offered into a buyback cap it had just tripled.
• Qualcomm (+13.65%), Intel (+13.26%), Meta (+12.90%) and AMD (+12.65%) led the weekly movers — AMD crossed a $1 trillion market capitalisation for the first time, and the Nasdaq Composite posted records on Monday and Tuesday.
• Brent rose 1.41% while WTI fell 6.84% — Iran offered to reopen Hormuz within seven days on Tuesday, then a Khamenei adviser threatened to widen the war to the Indian Ocean on Thursday; the spread reached its widest since May.
• Michigan sentiment fell to 48.1 with year-ahead inflation expectations jumping to 4.6% and long-run to 3.4% — a move at both horizons, on the day Cleveland’s Hammack named an “inflationary mindset” as her biggest risk while calling expectations reasonably anchored.
• Oracle lost 7.12%, the week’s worst mega-cap — a force-majeure notice on its 2.45 GW New Mexico campus after a gas pipeline slipped to 2027, hours before Anthropic committed $11.6bn to Akamai for CPU capacity.
• The Busan truce was extended to January 10 and Xi left Washington without purchase deals — a tariff cliff removed from the fourth quarter, with no rates, no dollar value and advanced semiconductors explicitly off the table.
1. Good news became bad news, and the bond market kept the receipt — every growth indicator beat (PMI 58.4, claims 197K, new home sales +6.4%, core capex +1.6%, GDPNow 5.0%), and the equity damage from Wednesday’s selloff was fully recovered by Friday while the yield damage was not.
2. Agentic AI acquired a business model in the same week it acquired a victim — Meta and Microsoft both moved agent pricing to usage and transaction fees, and the first sector repriced for it was financials, where the losses landed on brokerage, wealth management and insurance rather than on lenders.
3. The AI build-out’s scarce input stopped being chips — a permitting delay, a pipeline slipping to 2027, rising rented-GPU prices and an $11.6bn CPU contract all landed in one week, and every one of them is about power, delivery or financing rather than demand.
4. The index and the market parted company — the S&P 500 rose 1.21% while the NYSE Composite, the Russell 2000 and six of eleven sectors fell, the Dow Transports lost 2.52% over five straight lower closes, and the median S&P constituent now sits 18.6% below its own 52-week high.
 — Leading economic indicators. Accurate market forecasts. Apply for membership at join.recessionalert.com
B. WEEK IN MARKETS -> TOP
The week’s driver was the bond market, not the tape. Wednesday’s flash composite PMI at 58.4, the fastest private-sector growth since July 2021, pushed Governor Barr and then Williams, Paulson and Hammack to endorse further tightening, and October hike odds moved to roughly 70%; the 10-year closed Thursday at 5.225%, its highest since 2007, before easing into Friday. Equities absorbed all of that only at the very top of the index — the Nasdaq 100 gained 3.25% on Meta’s Muse launch, a chip bid and Microsoft’s Copilot overhaul, while the NYSE Composite and the Russell 2000 both finished the week lower. The cleanest divergence sat inside crude itself: Brent rose while WTI fell almost 7%, pushing the spread to its widest since May as Hormuz risk stayed offshore and a threatened US diesel export ban weighed on domestic barrels.
FRIDAY CLOSE & WEEK-ON-WEEK CHANGE — Fri, Sep 25, 2026:
MAJOR INDICES
Dow Theory split the week: industrials finished higher while transports lost 2.52%, a 2.8-point non-confirmation built on five consecutive lower Transport closes from Monday through Thursday — freight cracking under record diesel while blue chips held. Beneath the headline, the advance was a top-of-index affair. The Nasdaq 100 carried the S&P 500 while the NYSE Composite and the Russell 2000 both ended red, so more of the market fell than rose in a week the benchmark gained.
| Index | Fri Close | WoW Change | WoW % | Why It Moved (Week) |
|---|---|---|---|---|
| S&P 500 | 7,743.41 | +92.91 | +1.21% | Three advancing sessions bracketing Wednesday’s PMI-driven 0.75% selloff. Microsoft’s Copilot overhaul and easing crude carried Friday, leaving a weekly gain built almost entirely on mega-cap technology. |
| Dow Jones | 51,828.62 | +145.98 | +0.28% | Three straight lower closes Tuesday to Thursday on the bank selloff and the yield surge, erased by Friday’s 478-point advance led by Microsoft and Caterpillar, which snapped a three-week losing streak. |
| DJ Transportation | 19,572.22 | −506.88 | −2.52% | Five consecutive lower closes Monday through Thursday, falling even on the two sessions crude jumped. Diesel at a record $6.53 a gallon and a threatened export ban kept freight costs the swing variable all week. |
| Nasdaq 100 | 30,608.14 | +963.97 | +3.25% | Two record closes Monday and Tuesday on Meta’s Muse launch and the AI-memory rally, then a Wednesday rates shock it never fully surrendered; Microsoft’s Friday Copilot event restored the bid. |
| Russell 2000 | 2,837.55 | −22.85 | −0.80% | Small caps took the worst of Wednesday’s yield spike, falling 1.77% against 0.75% for the S&P 500, and never won it back; floating-rate and refinancing exposure is the whole weekly story. |
| NYSE Composite | 23,912.59 | −86.30 | −0.36% | Finished red in a week the S&P 500 gained 1.21% — the cleanest available measure of how narrow the advance was, with financials, energy and utilities all lower. |
VOLATILITY & TREASURIES
The VIX finished almost exactly where it started while the 10-year added 16.9 bps — volatility declined to price a repricing that was happening in plain sight, and it took Friday’s 5.11% drop to undo Wednesday’s 6.76% spike. Rising yields alongside a firmer dollar and falling gold is a real-rate and term-premium signature, not a growth scare; in a growth scare the long end rallies. Wednesday’s 58.4 flash PMI and Barr’s “further policy adjustments” remark did the damage, and the curve steepened to about 30 bps from 24.
| Instrument | Fri Level | WoW Change | Why It Moved (Week) |
|---|---|---|---|
| VIX | 14.87 | +0.06 (+0.41%) | A round trip: 4.44% lower Tuesday on Iran de-escalation, 6.76% higher Wednesday on the PMI and yield shock, 5.11% lower Friday. Net flat, which badly understates a week carrying two distinct shocks. |
| 10-Year Treasury Yield | 5.167% | +16.9 bps | Wednesday’s flash PMI and Barr’s remarks added 16.2 bps, Thursday a further 10.9 bps to a post-2007 high of 5.225%, and Friday pared 4.1 bps. Two soft coupon auctions and a buyback that used only $4.078bn of a tripled $6bn cap showed demand, not just expectations, driving it. |
| 2-Year Treasury Yield | 4.864% | +11.0 bps | Tracked October hike odds from about 55% to roughly 70% after Barr on Wednesday and Williams calling another hike this year “reasonable” on Thursday, then rallied 7.7 bps Friday while the long end held. |
| US Dollar Index (DXY) | 101.02 | +0.82 (+0.82%) | Firmed with yields Wednesday and Thursday rather than on any dollar-specific catalyst, then eased 0.26% Friday alongside the front-end rally. |
COMMODITIES
The metals split monetary against industrial rather than risk-on against risk-off: gold, silver and platinum all fell while copper edged higher. That is the week’s tell — on the five sessions that carried the 10-year to its highest since 2007, gold offered no haven at all, and it dropped hardest on Wednesday, the one day equities fell meaningfully. Bitcoin banked its entire weekly gain on Monday’s eight-month high and then drifted, tracking neither the equity tape nor the metals.
| Asset | Fri Price | WoW Change | WoW % | Why It Moved (Week) |
|---|---|---|---|---|
| Gold | $4,321.15/oz | −$95.20 | −2.16% | Lower in three of five sessions as real yields rose, with Wednesday’s 1.27% drop the largest; a firmer dollar rather than any gold-specific catalyst did the work. |
| Silver | $64.718/oz | −$2.052 | −3.07% | Fell further than gold on the same real-rate repricing, led by a 2.55% Wednesday slide that more than erased Tuesday’s 1.80% gain — the higher-beta leg of the precious complex. |
| Copper | $6.7763/lb | +$0.0638 | +0.95% | The only metal higher on the week, on Monday’s 1.33% and Tuesday’s 2.11% gains; industrial demand held its bid while the monetary metals sold off. |
| Platinum | $1,776.50/oz | −$28.10 | −1.56% | A 2.07% Tuesday gain wiped out by Wednesday’s 3.98% slide, the week’s largest single-session move in any metal, with only a partial Friday recovery. |
| Bitcoin | $84,050 | +$2,955 | +3.64% | The whole gain arrived Monday, a 7.57% surge to $87,248 and an eight-month high on reported ETF inflows and roughly $648m of short liquidations; it then fell or flatlined across the remaining four sessions. |
ENERGY
Crude split in two, and the split is the signal: Brent finished higher while WTI fell almost 7%, widening the Brent-WTI spread past $12, its widest since May. The week’s risk was seaborne — Iran’s seven-day Hormuz offer on Tuesday collapsed into a Khamenei adviser’s Indian Ocean threat and a Houthi missile attempt on Yanbu, the terminal built to bypass the strait. Domestic barrels carried the opposite pressure in a threatened US diesel export ban. Henry Hub’s gain against Dutch TTF’s near-identical loss completed a clean US-versus-Europe decoupling.
| Asset | Fri Price | WoW Change | WoW % | Why It Moved (Week) |
|---|---|---|---|---|
| Crude Oil (WTI) | $92.71/bbl | −$6.81 | −6.84% | Fell five straight sessions into Tuesday on Iran’s seven-day Hormuz offer and Saudi Arabia’s East-West pipeline restart, rebounded midweek on escalation, then resumed falling on reported phased-reopening talks; a threatened US diesel export ban added domestic-only pressure. The daily MIB flagged a likely contract-month roll in Monday’s prior close. |
| Crude Oil (Brent) | $104.64/bbl | +$1.45 | +1.41% | The only crude benchmark higher on the week: Wednesday’s 4.43% rebound on Pezeshkian’s UN address and Thursday’s 4.25% jump to $107.46 on the Indian Ocean threat and the Yanbu missile attempt outweighed Friday’s retreat. |
| Natural Gas (Henry Hub) | $3.186/MMBtu | +$0.287 | +9.90% | Higher in three of five sessions, with Thursday’s 6.75% jump on a Columbia Gas Transmission force majeure in Appalachia taking it to a 13-week high; Friday’s 3.37% fall was profit-taking, not a reversal of the outage. |
| Natural Gas (Dutch TTF) | $24.07/MMBtu | −$2.65 | −9.92% | Lost 7.24% on Monday alongside crude’s de-escalation slide and never recovered it; European gas traded the Hormuz diplomacy while US gas traded a domestic pipeline outage. |
S&P 500 SECTORS — WEEKLY ROTATION
Technology led the week and leads every horizon out to twelve months — regime leadership, not a bounce — but it was not broad: three of the five weekly gainers (QCOM, INTC, AMD) are Technology names, and Meta alone carried Communication Services into second place. Utilities were the worst sector for a third consecutive week and are now down 13.85% over three months, the structural casualty of a 10-year above 5%. Energy is the reversal to watch: the year’s runaway leader at +35.19% YTD gave back a second straight week as the Hormuz premium unwound.
| Sector | 1-Week | 1-Month | 3-Month | 6-Month | YTD | 12-Month |
|---|---|---|---|---|---|---|
| Technology | +3.06% | +6.97% | +10.45% | +41.37% | +30.26% | +31.35% |
| Communication Services | +1.59% | +3.32% | +5.96% | +13.64% | +2.10% | +5.86% |
| Healthcare | +0.92% | −2.73% | +3.75% | +15.00% | +8.70% | +22.02% |
| Industrials | +0.25% | −3.47% | −7.07% | +4.13% | +9.03% | +11.98% |
| Consumer Defensive | +0.17% | −2.82% | −3.23% | −0.05% | +4.81% | +4.51% |
| Consumer Cyclical | −0.52% | −5.13% | −1.73% | +2.57% | −8.10% | −9.75% |
| Basic Materials | −1.00% | −7.88% | +3.42% | +6.68% | +13.32% | +24.16% |
| Financial | −1.26% | −4.30% | +2.47% | +14.61% | +4.03% | +7.64% |
| Real Estate | −1.34% | −7.47% | −7.99% | +3.34% | +2.77% | −0.50% |
| Energy | −2.89% | −0.44% | +13.18% | −0.59% | +35.19% | +34.17% |
| Utilities | −2.95% | −8.08% | −13.85% | −12.20% | −7.26% | −7.35% |
TOP WEEKLY MOVERS:
The leaderboard is one trade wearing five tickers: four of the five gainers are semiconductors or the company whose AI agent re-rated them, and Technology topped the sector rotation table — sector amplification, not stock-picking. Momentum and reversal sit side by side inside it. AMD and Intel extended runs already deep in progress, while Lam Research rose on the week against a negative quarter, which makes it a counter-trend bounce rather than leadership. The decliners are the mirror image: Oracle, Wells Fargo, Morgan Stanley and Cisco are the AI build-out’s financiers, lenders and hardware incumbents — the names paying for the trade rather than receiving it.
TOP 5 WEEKLY GAINERS
| Ticker | Week | YTD | Year | Why It Moved |
|---|---|---|---|---|
| QCOM | +13.65% | +18.08% | +19.03% | Qualcomm’s Snapdragon Summit ran September 22–24 in Maui, where it unveiled the Snapdragon 8 Elite Gen 6 and a higher-performance Extreme variant. Coverage also credited a renewed global patent-licensing agreement with Apple, whose announcement date is unconfirmed, and a joint optical die-to-die interconnect demonstration with Lumentum and Corning for AI systems. The stock gained 9.28% on Monday alone in the chip rally and added 3.97% on Friday. |
| INTC | +13.26% | +233.33% | +261.87% | Intel jumped 12.17% on Monday to lead the chip rally, with Northland upgrading to Outperform and Tigress Financial raising its target to $145. Reported support came from a planned ~10% PC CPU price increase in early October, SK hynix talks over its Ohio fab, and High-NA EUV reaching high-volume manufacturing at Intel Foundry — none of them dated to a single session. It gave back 3.45% on Friday as profit-taking hit a roughly 223% year-to-date run. |
| META | +12.90% | +13.87% | +0.37% | Meta rose 11.34% on Monday into Meta Connect, where Zuckerberg said on Wednesday that Muse, its AI agent, will charge a fee on transactions it completes — a take-rate model rather than a subscription. JPMorgan lifted its target to $920 and Deutsche Bank, Piper Sandler, TD Cowen, Raymond James, Citizens and Canaccord all raised theirs. A Santa Fe jury’s Friday finding that Facebook misled users over privacy protections coincided with a 3.33% Friday decline. |
| AMD | +12.65% | +194.47% | +291.04% | AMD gained 9.95% on Monday and crossed a $1 trillion market capitalisation for the first time, capping a five-session run of roughly 25%. No company-specific catalyst was identified; coverage framed the move as an agentic-AI CPU-demand read-through from Meta’s Muse launch, which remains unverified as causal. |
| LRCX | +9.41% | +84.14% | +146.01% | No single catalyst — Lam Research rode the AI-memory and chip-equipment bid that lifted SanDisk, Micron and Seagate early in the week, then added 2.62% on Friday in a broad chip rally alongside Applied Materials. A new buy rating landed September 20 while UBS and Mizuho trimmed targets, and the negative quarter behind it makes this a counter-trend bounce. |
TOP 5 WEEKLY DECLINERS
| Ticker | Week | YTD | Year | Why It Moved |
|---|---|---|---|---|
| ORCL | −7.12% | −29.66% | −52.94% | Bloomberg reported on Thursday that Oracle had sent a force-majeure notice to the developer of Project Jupiter, its 2.45 GW New Mexico data-centre campus, after the gas pipeline supplying the site slipped to February 2027; the stock fell 3.47% that day and another 1.75% on Friday. Reports of stressed pricing on related data-centre loans and continued workforce cuts compounded it. Oracle says the project “remains on our planned schedule.” |
| WFC | −3.66% | −10.98% | −1.60% | Wells Fargo fell 3.92% on Tuesday in a broad financials selloff that Reuters tied to AI-disruption fears after Meta’s Muse launch and to a yield curve at its flattest since March 2025; the S&P 500 bank index lost 3% that session. Company-specific news was minor by comparison — a new chief risk officer named on September 23. |
| MS | −3.10% | +10.58% | +23.50% | Morgan Stanley fell with the same financials complex. Bloomberg reported on September 22 that the firm was working to contain damage from a leaked deal list, and Wells Fargo cut its price target to $223 from $240 on September 25; neither is large enough on its own to explain a week dominated by the sector’s AI-disruption and yield-curve concerns. |
| SPCX | −2.64% | −0.88% | – | A lockup expiring Thursday made about 328 million shares eligible for sale, and President and COO Gwynne Shotwell filed on September 22 to sell 342,170 shares worth roughly $52 million under a trading plan adopted in June. The stock fell 4.11% on Wednesday ahead of the unlock, the session’s largest mega-cap decline, and steadied once it passed. |
| CSCO | −2.57% | +38.52% | +57.26% | Cisco fell 4.50% on Tuesday after Piper Sandler cut its target to $125 from $132 on peaking-growth concerns while keeping a Neutral rating. Reporting attributed the rest to profit-taking on insider-sale disclosures following its strong August post-earnings rally. Networking peers Arista and Ciena were roughly flat, marking this as single-name selling rather than an AI-networking demand scare. |
— Institutional-grade intelligence for serious investors. Apply for membership at join.recessionalert.comC. WEEK’S TOP STORIES -> TOP
Three threads, and they are not independent. The rate shock runs through stories #1, #2 and #6 — a long end repricing term premium, a Fed chorus pushing October hike odds toward 70%, and a bank complex squeezed from both ends. The AI re-rating runs through #4, #5 and #7, where the same enthusiasm lifting chips and agents is meeting delivery, power and financing limits. Geopolitics and trade — #3, #8 and #9 — supplied the week’s inflation input and its one piece of de-risking. The threads meet at inflation: every one of them ends at the October decision.
BEARISH
1. The Long End Broke Away: 10-Year Hits 5.225%, Its Highest Since 2007, as Two Auctions Tail and Treasury’s Tripled Buyback Goes Two-Thirds Unused
The core facts:The 10-year Treasury yield opened the week at 4.954% on Monday, jumped 16.2 bps on Wednesday to 5.110% and a further 10.9 bps on Thursday to 5.225%, the highest close since June 2007, before easing 4.1 bps on Friday to 5.167%. The 30-year touched 5.501% intraday on Thursday, its highest since June 2004, and closed Friday at 5.49% on the par curve. Supply, not just expectations, drove it. Wednesday’s 5-year auction cleared at 5.033% with a 3.1 bp tail, a 2.21 bid-to-cover against a 2.33 average and indirect bidders at 54.3% against 65.2%. Thursday’s 7-year cleared at 5.085%, the highest since April 1993, with indirects at 57.2% against about 61%. Treasury had tripled its 20- to 30-year buyback cap to $6 billion from August’s $2 billion and accepted only $4.078 billion of $10.468 billion offered, taking 12 of 35 eligible issues. Freddie Mac’s 30-year mortgage rate crossed 7% to 7.03%, its first reading above that level since January 2025, and the MBA contract rate reached 7.12%.
Why it matters:The 10-year rose 16.9 bps on the week against 11.0 bps for the 2-year, so this was a bear steepener: the repricing sat in term premium and inflation compensation rather than in near-term Fed expectations, which is the harder problem because it raises the discount rate with no matching growth upgrade. The buyback result is the most telling number in the week. Treasury enlarged a supply-relief operation aimed squarely at the long end, investors offered it 2.6 times what Treasury chose to take, and the long end sold off anyway — a backstop cannot manufacture the term premium buyers are demanding. The damage landed exactly where duration and financing costs bite: Utilities fell 2.95% on the week and are down 13.85% over three months, Real Estate lost 1.34%, and the Russell 2000 finished red while the S&P 500 gained 1.21% (see Section B). Cleveland’s Hammack read the move as real rates rather than lost inflation credibility, which is reassuring about anchoring and is also the argument for tightening further.
What to watch:Whether the 30-year holds above 5.5% into August core PCE on Wednesday, September 30, and the next MBA mortgage survey the same morning — the first week of applications fully priced above 7%.
BEARISH
2. Eight Fed Speakers in Five Days All Point the Same Way — October Hike Odds Move From About 55% to Roughly 70% and the Vice Chair Declines to Argue
The core facts:Every session carried a hawkish voice. St. Louis’s Musalem told Reuters on Monday that the new 3.75%-4.00% range is “on the accommodative side” and that without further restraint inflation is “more likely to be substantially above our 2% target in 18 months than at target”; Minneapolis’s Kashkari said inflation is too high “in all aspects of the economy.” Richmond’s Barkin, in a speech titled “Why Hike?”, left the next step open with “We’ll see.” On Wednesday Governor Barr said further policy adjustments are “likely to be needed,” and Chicago’s Goolsbee argued against treating an oil shock as transitory: “we better be careful.” Futures-implied odds of an October 27-28 hike rose from about 55% to 70%, with CME FedWatch read at about 73%. On Thursday New York’s Williams called another hike by year-end “a reasonable way of thinking about it,” Philadelphia’s Paulson said “some modest further tightening may be warranted,” and Cleveland’s Hammack put inflation risks “tilted to the upside.” The 2-year closed the week 11.0 bps higher at 4.864%.
Why it matters:The composition is what changed, not the volume. A week that began with regional presidents ended with a Board governor, the FOMC vice chair and two 2026 voters all pointing at another increase, and Williams explicitly declined to push back on market pricing. That removes the possibility that the September hike was a one-off response to energy. Note how little the front end moved for all that: the 2-year rose 11.0 bps against 16.9 bps on the 10-year, and on Thursday just 4.6 bps against 10.9. Hawkish Fed talk is lifting near-term expectations only modestly while doing nothing to anchor the long end — which is precisely the split story #1 describes. Equities largely looked through it, and that gap between the rate path the committee is describing and the one a 3.25% weekly gain in the Nasdaq 100 implies is the risk carried into October.
What to watch:August core PCE on Wednesday, September 30, expected at 0.3% against 0.2% prior, is the last major inflation print before the October 27-28 decision; Goolsbee, Musalem and Williams all speak on Tuesday, September 29.
UNCERTAIN
3. Hormuz Round Trip: Iran Offers to Reopen the Strait in Seven Days, Then Threatens the Indian Ocean — Brent Ends the Week Higher While WTI Falls Nearly 7%
The core facts:The week ran de-escalation, escalation and back again. Monday brought satellite imagery reported by Bloomberg showing Saudi Gulf loading capacity of about 14 million barrels over the weekend, the highest since at least June, plus Iran’s conditions for reopening passed through mediators. On Tuesday a senior Iranian official told Reuters Tehran could reopen the Strait of Hormuz within seven days if Washington eased military pressure, Foreign Minister Araghchi met US envoy Witkoff at the UN for three hours, and Saudi Arabia began restarting its East-West pipeline to Yanbu, shut since the September 13 drone attacks. Bloomberg, citing preliminary ICE data, reported the most Brent put contracts ever traded in a single session. Wednesday reversed it: Pezeshkian told the General Assembly Iran “cannot be made to surrender,” Brent rose 4.43% back above $100 despite a 2.969 million-barrel US crude build, and Kpler data cited by Reuters showed three vessels transiting Hormuz against a 10-day average near 15. Thursday added a Khamenei military adviser’s threat to extend the war “reaching the Indian Ocean and perhaps beyond” and six Houthi missiles intercepted en route to Yanbu and Taif; Brent hit $107.46. Friday’s reported US-Iran talks on a phased reopening, with Qatar mediating, pulled Brent back to $104.64.
Why it matters:The two benchmarks parted company, and that is the week’s cleanest read on where the risk actually sits. Brent finished 1.41% higher while WTI fell 6.84%, widening the spread past $12 — its widest since May (see the Energy table in Section B). The premium is on seaborne barrels, not US inland supply, which is why a sizeable US and Cushing build could not stop Brent rebounding. Thursday’s missile attempt on Yanbu matters more than its interception suggests: Yanbu is the Red Sea outlet of the pipeline built to bypass Hormuz, so the bypass itself is now a target. And the macro transmission ran the wrong way for the Fed — CNBC tied Thursday’s leg of the Treasury selloff to the oil move, and Goolsbee spent the same week arguing central banks should stop assuming oil shocks fade.
What to watch:Daily Hormuz transit counts against the roughly 15-vessel 10-day average, whether Yanbu loadings actually resume, and any formal US response to Iran’s three conditions.
BULLISH
4. Agentic AI Got a Price Tag This Week: Meta Puts a Take Rate on Muse Transactions and Microsoft Bills Its Copilot Agents by Usage, Not by Seat
The core facts:Meta rose 11.34% on Monday to $741.24 as Wells Fargo lifted its target to $796 ahead of Meta Connect; Amazon had cut Muse off from shopping on Amazon.com late Sunday, saying access by “an unauthorized AI agent” violates its conditions of use. At Connect on Wednesday Mark Zuckerberg said Meta will charge a small fee on transactions completed through Muse. Meta added 4.50% on Thursday as JPMorgan raised its target to $920 from $820, calling Muse potentially “the most widely used consumer AI application since ChatGPT,” with Raymond James, Citizens, Deutsche Bank, Piper Sandler, TD Cowen and Canaccord also raising. On Friday Microsoft unveiled its largest Copilot overhaul — Home, Code, and an always-on Autopilot agent entering private preview at the end of September — and said Cowork, Code and Autopilot will be billed on usage rather than through the $30-per-user-per-month seat licence; Satya Nadella called it “a new OS for work.” Microsoft closed 3.66% higher at $516.17 and led both the S&P 500 and the Dow. Meta finished the week 12.90% higher despite a 3.33% Friday decline.
Why it matters:Two of the largest companies in the market answered the same question four days apart, and they answered it the same way: agents get charged for what they do, not for who has access to them. That converts AI from a subscription attach-rate problem, where adoption has been the persistent doubt, into consumption revenue that scales with usage — the model Azure already runs on. It also explains why the read-through was so wide. The two names between them carried Communication Services and Technology, the week’s top two sectors, and Friday’s Microsoft move was large enough to snap a three-week Dow losing streak (see Section B). Amazon’s block is the counterweight worth holding onto: if a transaction fee is the business model, the platforms that own the checkout get a veto over it, and that fight is now explicit.
What to watch:Autopilot’s private preview at the end of September, whether Microsoft breaks out consumption-based Copilot revenue at its next quarter, and whether Amazon escalates beyond a technical block.
BULLISH
5. Two Nasdaq Records in Two Days as Leadership Narrows From Compute to Memory — AMD Crosses $1 Trillion and Intel Adds 13.26% on the Week
The core facts:Monday’s chip rally lifted Intel 12.17%, AMD 9.95%, Qualcomm 9.28% and Marvell 5.38%, with Arm’s US-listed ADR up 17.16%; AMD crossed a $1 trillion market capitalisation for the first time, capping a five-session run of roughly 25%. The Nasdaq Composite closed at a record, its first since June. Tuesday narrowed the leadership from compute to memory: SanDisk rose 6.82%, Micron 5.00% above $1,000, Seagate 4.85% and Lam Research 2.87%, after Rosenblatt initiated SanDisk at Buy with a $2,400 target casting NAND flash as core AI infrastructure. The Nasdaq 100 closed at 30,732.40, its first close above the June 2 peak of 30,660.60, and the Composite posted a second straight record. Wednesday’s rate shock took the Nasdaq 100 down 0.85% and SanDisk fell on both Wednesday and Thursday, but Friday’s broad chip bid — Qualcomm +3.97%, Texas Instruments +2.74%, Lam Research +2.62%, Applied Materials +2.27% — left the index 3.25% higher on the week.
Why it matters:Two records inside a week in which the NYSE Composite and the Russell 2000 both finished lower is the definition of narrow, and the narrowing happened twice over: first from the index into semiconductors, then from compute into memory and storage. The memory leg rests on a specific thesis — that high-bandwidth memory and enterprise flash, not GPUs, are now the binding constraint on data-centre build-outs, which hands the suppliers pricing power. Reuters reporting on Friday that SK hynix is weighing a US listing for Solidigm at up to $150 billion is the same thesis priced in the primary market. The vulnerability is equally specific: three of the five weekly gainers are chip names and Technology topped the sector table, so the index’s weekly gain and its concentration risk are the same fact viewed twice.
What to watch:Micron’s fiscal fourth quarter after the close on Wednesday, September 30 — consensus EPS $31.52 on revenue of $51.07 billion against guidance of $50.0 billion ± $1.0 billion — the first hard test of whether memory pricing justifies a share price above $1,000.
BEARISH
6. The AI-Disruption Trade Reaches Financials: Schwab Falls 6.1% and the Bank Index 3% on the Day the Curve Hit Its Flattest Since March 2025
The core facts:Financials were the weakest S&P 500 sector on Tuesday at -1.55%, with Wells Fargo down 3.92%, JPMorgan 3.42% and Bank of America 3.04%. Reuters reported the S&P 500 bank index finished 3% lower, with Charles Schwab down 6.1%, Ameriprise 4.4% and Raymond James more than 3%, and linked the selloff to competition from artificial intelligence, noting Meta’s Muse had passed ChatGPT as the most-downloaded free iPhone app. Bloomberg reported Muse was weighing on stocks that “depend on consumer inertia,” with Allstate down 5.5%. The 2s10s spread closed near 21 basis points and Reuters said it touched its flattest since March 2025 intraday. The sector finished the week 1.26% lower, and Wells Fargo and Morgan Stanley were two of the five largest weekly mega-cap decliners.
Why it matters:The distribution of the damage is the argument. This was not a credit scare — the worst losses landed at Schwab, Ameriprise and Allstate, not at credit-sensitive lenders — so the market was pricing a threat to businesses whose margin depends on customers who do not shop around: brokerage cash sweeps, wealth-management fees and auto insurance renewals. An agent that compares products and moves money attacks exactly that. The second headwind is conventional and arrived from story #1: a flatter curve squeezes net interest margin just as deposit franchises are being questioned. By Friday the curve had steepened back to about 30 bps and Financials rose 0.79%, so the rate leg partially reversed while the disruption leg did not — the sector still finished the week down. That is the split to carry forward.
What to watch:Whether Muse adoption keeps pressure on brokerage, wealth-management and insurance names beyond a single session, and whether the 2s10s spread holds its Friday steepening into the October FOMC.
UNCERTAIN
7. The AI Build-Out’s Constraint Is No Longer Demand: Oracle Declares Force Majeure on a 2.45 GW Campus the Same Day Anthropic Commits $11.6 Billion to Akamai
The core facts:Monday opened the thread with Rothschild & Co Redburn initiating CoreWeave and Nebius at Sell, arguing the credit market is “sending the more important signal”; both stocks rose anyway. On Thursday Bloomberg reported Oracle had sent a force-majeure notice to the developer of Project Jupiter, its 2.45 GW New Mexico campus, after the New Mexico State Land Office denied a right-of-way and pushed Energy Transfer’s gas line to February 1, 2027; Oracle is not exiting as tenant and says the project “remains on our planned schedule.” The stock fell 3.47% and finished the week 7.12% lower, the largest weekly mega-cap decline. Hours later Akamai announced Anthropic had committed $11.6 billion over seven years for CPU capacity, expandable to about $20 billion, with a warrant over roughly 7.7 million Akamai shares at $111.33; Akamai rose as much as 20% after hours. The same day JPMorgan upgraded CoreWeave citing 25% product price increases in July, and BNP Paribas Exane upgraded Nebius, which gained 7.44%.
Why it matters:Read together, Thursday’s three items say the same thing from three directions: capacity that exists commands a premium, and the binding constraints are power, permitting and financing rather than chips or customers. That is a different investment problem from the one the market spent 2025 worrying about. It also relocates the risk. By invoking force majeure Oracle pushes timing exposure onto the developer and its lenders — the leveraged layer — in a week when the 10-year closed at 5.225% and reports described stressed pricing on loans tied to the campus. The neoclouds fund build-outs with debt, so improving unit pricing and a rising cost of capital are pulling in opposite directions, and Redburn’s Monday argument that credit is the leading indicator is the one to keep in view.
What to watch:Any revised in-service date for the Energy Transfer pipeline beyond February 1, 2027, whether other gas-powered campuses disclose similar permitting delays, and whether Akamai holds its after-hours gain.
UNCERTAIN
8. The November 10 Tariff Cliff Is Gone and Almost Nothing Else Is Settled: Busan Truce Extended to January 10, Xi Leaves Washington With No Purchase Deals
The core facts:Vice Premier He Lifeng met Treasury Secretary Bessent and Trade Representative Greer in New York on Sunday; Xinhua described “candid, in-depth and constructive exchanges” including the first talks on AI. On Tuesday China added two drug-precursor chemicals to its US export-permit list, taking it to 18. Bessent met He again in Washington on Wednesday, saying the US was “open to the idea of just continuing the Busan arrangement or examining the bigger deal,” and US officials said rare-earth magnet deliveries had “not been up to par.” Wednesday evening he confirmed the truce, due to expire November 10, would run to January 10. Xi was hosted at the White House on Thursday for an Oval Office meeting and state dinner. On Friday he left without new purchase deals; Greer said the US would send “agricultural products and medical devices” for Chinese “consumer goods and other things that are non-sensitive,” promised details on Monday, and ruled advanced semiconductors out entirely: “These are the crown jewels of American technology.” China’s 15% tariff on US LNG remains.
Why it matters:One real thing happened: a tariff cliff was removed from the fourth-quarter calendar, along with the suspensions of US port fees and China’s rare-earth controls that ride on it, which matters most to autos, industrials and the semiconductor supply chain. Everything else is a framework without numbers — no dollar value, no tariff rates, no energy, soybean or aircraft commitments. Greer’s refusal to trade chip export controls for purchase commitments caps the upside for exactly the semiconductor names that led the week in story #5. The market’s response is its own evidence: the S&P 500 finished flat on summit day while rates drove the tape, which says the extension was already expected once Bessent spoke on Wednesday, and that a breakdown is not priced either.
What to watch:The trade details USTR promised for Monday, September 28, then the G20 trade ministerial in Milwaukee from September 29 to October 1, where Greer speaks on September 30; the November Shenzhen AI summit is the follow-on venue.
UNCERTAIN
9. A Diesel Export Ban Was Floated, Denied and Left Open in Four Days as Pump Diesel Set a Record $6.53 — Refiners Fell and the Brent-WTI Spread Widened
The core facts:Monday brought two supply shocks at once: Bloomberg reported Russia is set to extend its diesel export ban beyond September, a day after Ukraine’s drone strike set Gazpromneft’s Moscow refinery alight, and GasBuddy put the US average diesel price at $6.490 a gallon, up 30.7 cents on the week. On Tuesday President Trump said he had pushed for a US diesel export ban internally and that a decision would come quickly “one way or another”; Bessent said the administration was “examining whether it’s feasible.” Valero fell 4.10% and Marathon Petroleum 3.16% that session, with Jefferies also downgrading both to Hold. Wednesday brought open disagreement: Politico reported a 90-day ban was being prepared, the White House denied it, and Energy Secretary Chris Wright said nobody is considering a flat ban because it could raise gasoline and jet fuel prices. AAA’s national diesel average peaked at a record $6.5276 on Tuesday. By Friday the ban had not appeared in the White House presidential-actions listing, and The National cited it as a weight on WTI.
Why it matters:Diesel is the fuel of freight, farming and construction, so this is the channel by which an energy shock becomes goods inflation — and it ran the opposite way to crude all week, with WTI down 6.84% while pump diesel set a record. That divergence is precisely the non-oil pass-through Musalem and Goolsbee described, and it is visible in the tape: the Dow Transports fell five straight sessions and lost 2.52% on the week, the worst of any index tracked in Section B, on days both up and down for crude. The policy itself is unresolved and openly contested inside the administration, which leaves refiners’ export margins hostage to an announcement rather than to fundamentals. It also has a measurable market footprint: a ban would trap product on the Gulf Coast, which is bearish US crude against seaborne barrels and is part of why the Brent-WTI spread reached its widest since May.
What to watch:Any executive action on diesel exports, a formal Russian decree extending its own ban, and Wednesday’s EIA distillate data.
— Separating signal from noise since 2007. Apply for membership at join.recessionalert.comD. WEEK IN THE ECONOMY -> TOP
The week’s growth scare unwinding was emphatic and expensive. September’s flash composite PMI at 58.4 was the fastest private-sector expansion since July 2021, core capital-goods orders rose 1.6%, jobless claims fell to 197,000, new home sales beat by 64,000 and GDPNow closed the week tracking 5.0% — a clean sweep against a prior week of flat industrial production and a falling leading index. The cost is that nothing in it argues for the Fed stopping, and the inflation side moved with it: PMI input costs rose at their steepest pace since October 2022 and Michigan’s year-ahead expectations jumped to 4.6%. Markets priced the trade-off rather than the growth: the 10-year added 16.9 bps, Utilities fell 2.95%, and Polymarket’s recession odds rose 2 points even as the data improved. August core PCE on Wednesday, September 30 decides whether firms’ pricing power has reached consumer prices.
POLYMARKET ODDS — WEEK-ON-WEEK SHIFT:
| Market | Last Friday | This Friday | Δ |
|---|---|---|---|
| US Recession by end-2026 | 9% | 11% | +2.0 pp |
| Fed rate hike in 2026 | 100% | 100% | 0.0 pp |
| Fed rate cuts ≥1 in 2026 | 5% | 4% | −1.0 pp |
UNCERTAIN
Flash Composite PMI 58.4, Fastest Since July 2021, With Input Costs at Their Steepest Since October 2022 (S&P Global, Wed Sep 23)
What they’re saying:The flash US composite PMI rose to 58.4 in September from 56.0 in August, a fourth straight month of acceleration. Services rose to 58.7 from 56.5 against 56.0 expected; manufacturing rose to 57.0 from 53.9 against 53.5 expected, a 52-month high. Both beat consensus by wide margins. Input costs rose at the steepest pace since October 2022 on fuel and transport, wage pressures intensified, selling-price inflation picked up and hiring ran at its fastest since June 2022. Chris Williamson said “US business continues to boom, with output growing at the fastest rate for over five years in September,” and put the historical read at annualised growth near 5%.
The context:The market read the release as a rate event rather than an earnings one, and the reaction was immediate and one-directional: the 10-year rose 16.2 bps to 5.110%, the dollar gained 0.50%, the S&P 500 fell 0.75%, ten of eleven sectors declined and the Russell 2000 lost 1.77%. Stocks and bonds fell together, which removed the usual portfolio hedge and identifies this as a discount-rate shock rather than a rotation. The print is also the reason the rest of the week’s Fed commentary landed as hard as it did — October hike odds moved from about 55% to 70% on the same afternoon as Governor Barr’s remarks. A week later the S&P had recovered the loss and Technology finished up 3.06%, so the equity damage proved temporary while the yield damage did not (see Section B).
What to watch:ISM Manufacturing on Thursday, October 1 (expected 54.8 against 54.6 prior), and whether the September final PMI confirms the flash reading.
BEARISH
Michigan Sentiment 48.1 as Year-Ahead Inflation Expectations Jump to 4.6% and Long-Run Expectations Break 3.3% (University of Michigan, Fri Sep 25)
What they’re saying:The final September index came in at 48.1, above the 47.6 consensus but down 7.0% from August’s 51.7 and 12.7% lower than a year earlier. Expectations fell 10.1% to 46.3 while current conditions slipped 1.9% to 50.9. Year-ahead inflation expectations jumped to 4.6% from 4.0%, the highest since June, and long-run expectations rose to 3.4% after three consecutive months at 3.3%. Survey director Joanne Hsu called it “the lowest reading in four months and down 15% from January 2026.” The Atlanta Fed’s business survey pointed the same way on Wednesday, with firms’ year-ahead unit-cost expectations rising to 2.4% from 2.2%.
The context:The headline is not the story; a move at both the one-year and long-run horizons is the de-anchoring signature the Fed watches most closely, and it arrived on the same day Cleveland’s Hammack named “the formation of an inflationary mindset” as her biggest inflation risk while simultaneously judging expectations “reasonably well anchored.” Those two statements now sit in visible tension, and the survey is the evidence that will test which one holds. The source of the household squeeze is identifiable and it is not the labour market: claims were 197,000 in the same week, while gasoline sat at $4.48 a gallon against $3.18 a year ago and pump diesel set a record. Consumers are pessimistic about prices while continuing to spend — GDPNow’s consumption nowcast rose to 4.2%.
What to watch:Conference Board Consumer Confidence on Tuesday, September 29 (expected 90 against 89.4 prior) and August personal spending on Wednesday, September 30 (expected 0.8% against 0.2%).
BULLISH
Core Capital-Goods Orders Jump 1.6% and Durable Goods Beat a −0.4% Forecast as GDPNow Holds 5.0% (Census Bureau / Atlanta Fed, Fri Sep 25)
What they’re saying:August durable goods orders were virtually unchanged at $338.6 billion against a consensus 0.4% decline, after a 0.9% July gain. Transportation fell 0.6% to $114.1 billion and held the headline flat; excluding transportation, orders rose 0.3% against 0.6% expected. Nondefense capital goods excluding aircraft — the core business-investment gauge — rose 1.6% to $87.6 billion and is running 10.6% ahead of last year year-to-date. Unfilled orders climbed 0.6% to $1.61 trillion. The Atlanta Fed’s GDPNow closed the week at 5.0% for the third quarter, with real private domestic investment nowcast at 18.7%.
The context:This is the AI build-out arriving in the national accounts rather than in a press release, and Friday supplied a live example alongside it: Atlas Energy Solutions signed cost-reimbursement agreements with an unnamed frontier AI lab and ordered a further 283 MW of Caterpillar power-generation equipment, rising about 17% intraday. The market rewarded the read-through — Industrials gained 0.76% on Friday and Caterpillar was one of the two high-priced names carrying the Dow’s 0.93% advance. The forecasting community is not close to agreement on the magnitude: the American Bankers Association’s advisory committee projected 2.7% third-quarter growth this week against GDPNow’s 5.0%, and total durable-goods shipments actually fell 0.2%, the first decline after eight monthly increases. Both, though, describe an economy strong enough to absorb another hike.
What to watch:Final second-quarter GDP on Wednesday, September 30 (expected 1.6% against 2.1% prior) and the revised factory orders report on Friday, October 2.
BULLISH
Jobless Claims Fall to 197K Against a 201K Forecast as ADP’s Weekly Pulse Accelerates a Third Week to 20,000 (Labor Department / ADP, Tue Sep 22 and Thu Sep 24)
What they’re saying:Initial claims fell 1,000 to 197,000 in the week ended September 19, below the 201,000 consensus, with the prior week revised up 2,000 to 198,000. The four-week average eased 1,750 to 202,250. Insured unemployment rose 2,000 to 1,719,000 and the insured rate held at 1.1%. Separately, ADP’s NER Pulse showed private employers adding an average of 20,000 jobs per week in the four weeks to September 5, up from 16,750 and accelerating for a third straight week; the four-week average has doubled from 10,000 in the period ending August 15. ADP’s figures are preliminary and subject to revision.
The context:A firm labour market is the week’s quietest data point and its most consequential one, because it removes the only argument for pausing. Every hawkish speaker used it: Paulson called conditions “stable and seem to have improved a bit,” Musalem described the job market as “around full employment” while calling for more restraint, and Barkin said the economy and labour market “remain on solid footing.” With employment near its goal the committee has no competing mandate to weigh, which is why eight speakers in five days could converge on the same conclusion. The one caveat is composition: the Richmond Fed’s September survey showed employment improving to +7 while new orders fell to −6, and hiring plans usually follow orders rather than lead them.
What to watch:August JOLTS on Tuesday, September 29 (prior 7.271M), then September payrolls on Friday, October 2 (expected 100K against 162K prior).
UNCERTAIN
Mortgage Rates Cross 7% for the First Time Since January 2025 in the Same Week New Home Sales Beat by 64,000 (MBA / Freddie Mac / Census Bureau, Wed Sep 23 and Thu Sep 24)
What they’re saying:The MBA’s average 30-year fixed contract rate rose 15 bps to 7.12% in the week ending September 18, its highest since May 2024; total applications fell 1.5%, refinances 3% and purchases 1%, while the adjustable-rate share rose to 9.8%. Freddie Mac’s survey reached 7.03% on Thursday, the first print above 7% since January 2025, against 6.30% a year earlier. New single-family home sales rose 6.4% to a seasonally adjusted annual rate of 684,000 in August, well above the 620,000 consensus, from an upwardly revised 643,000. The median price was $393,700, down 5.8% from a year earlier, with inventory at 8.5 months.
The context:The two prints are not in conflict; they are separated by about six weeks. August’s contracts were signed before this month’s rate shock, and Census puts the monthly confidence interval at ±19.5%, so the beat is not statistically significant and sales remain 2.0% below August 2025. What the week actually established is the mechanism by which the bond market reaches households: builders have been buying volume with price cuts, and that lever gets harder to pull as financing costs climb. The MBA survey week also closed before Wednesday’s 16.2 bp jump in the 10-year, so the 7.12% figure understates where rates now sit. The rate-sensitive equity complex had already marked it: Real Estate fell 1.34% on the week and Utilities 2.95%, both deep in three-month drawdowns.
What to watch:S&P/Case-Shiller home prices on Tuesday, September 29, and the MBA mortgage rate on Wednesday, September 30 — the first week of applications fully priced above 7%.
— Know the probability before the market prices in the risk. Apply for membership at join.recessionalert.comE. WEEK IN EARNINGS -> TOP
TOP EARNINGS OF THE WEEK
BULLISH
1. Costco Wholesale (COST): +2.93% on Friday | Traffic, Not Price, Carried a Double Beat — and $0.15 of the EPS Line Was a Tariff Refund
The Numbers:Fiscal fourth quarter (16 weeks), released after the close on Thursday, September 24. EPS $6.75 diluted against $6.54 estimated, up from $5.87 a year earlier and including a non-recurring $0.15 benefit from IEEPA tariff refunds; revenue $95.72 billion against $94.97 billion estimated. Net sales rose 11.2% to $93.9 billion and net income was $2.998 billion against $2.610 billion. Comparable sales rose 9.4%, with comparable traffic up 3.3% and digitally enabled comparable sales up 19.5%; US comps rose 10.7%, or 7.2% adjusted. Membership fee income rose 7.3% to $1.849 billion across 150.4 million cardholders, with a worldwide renewal rate of 89.8% and 92.3% in the US and Canada. Market cap $397.57 billion.
The Problem/Win:The composition is better than the headline. A 3.3% gain in comparable visits and a roughly 30% jump in traffic to the website and app means the quarter was won on footfall rather than on ticket inflation — the distinction that separates share gain from price pass-through. The qualification is the earnings line: strip the $0.15 tariff refund, which the company partly reinvested in member value, and EPS of about $6.60 still cleared consensus but by a far narrower margin than the reported figure implies. Membership economics, the part of the model that actually compounds, held: fee income up 7.3% on a renewal rate near 90%.
The Ripple:Walmart had fallen 2.69% into the print on Thursday with no discrete catalyst identified, and Consumer Defensive lost 0.90% that session, so Costco arrived as the first hard data point on defensive retail after a selloff. Friday answered narrowly: the sector recovered 0.40% and finished the week up 0.17%, one of only five green sectors, but the response was Costco-specific rather than a group re-rate. The sell side went the other way on valuation — Raymond James cut its target to $1,050 from $1,100, Mizuho to $1,065 from $1,100 and Bernstein to $1,143 from $1,144, with DA Davidson the lone raise to $1,040.
What It Means:This is the cleanest available read on a consumer who tells surveys they are miserable and keeps spending anyway: Michigan sentiment printed 48.1 the same morning, and Costco reported 9.4% comparable sales with rising traffic. The two are reconcilable only if households are trading down into value and convenience rather than cutting volume — which is bullish for the warehouse model and bearish for everyone charging a premium for the same basket. Targets drifting lower on a double beat says the multiple, not the business, is what limits the stock from here.
What to watch:Costco’s September sales report in early October, the first monthly comparable-sales read of fiscal 2027 and the first fully clear of the tariff-refund benefit.
WEEK AHEAD PREVIEW:
Q3 2026 earnings season is still in its off-cycle opening stretch, with only a handful of fiscal-year-offset reporters out; two names above $100 billion report over the next five business days, and none on Monday, Sept 28, Tuesday, Sept 29 or Friday, Oct 2.
Micron Technology (MU) — AMC, Wednesday, Sept 30 — Consensus EPS $31.52 on revenue of $51.07 billion, against company guidance of $50.0 billion ± $1.0 billion. The key focus is AI memory pricing and high-bandwidth memory supply into 2027; the report lands days after Reuters said SK hynix’s Solidigm is weighing an IPO at up to $150 billion, a live test of how richly the market values memory and storage.
Accenture (ACN) — BMO, Thursday, Oct 1 — Consensus EPS $3.18 on revenue of $18.03 billion; market cap $107.77 billion. The key focus is fiscal 2027 guidance and whether generative-AI bookings offset pressure on traditional consulting, with JPMorgan raising its target to $200 from $179 on Friday. Microsoft’s usage-priced Copilot agents raise the stakes on how much AI implementation work stays with integrators.
Nike ($53 billion) reports after the close on Oct 1 but falls below the $100 billion threshold; the big banks open the main Q3 season in mid-October.
— US market commentary trusted by family offices and institutions. Apply for membership at join.recessionalert.comF. NEXT WEEK SETUP -> TOP
UPCOMING RELEASES:
| Date | Event | Why It Matters |
|---|---|---|
| Mon Sep 28 | Dallas Fed Manufacturing Index Sep (prior 11.6) | The third regional factory read after Kansas City’s beat at 14 and Richmond’s slide to −2. Two of three pointing up would make the flash PMI’s 57.0 manufacturing print look national rather than survey-specific. |
| Mon Sep 28 | Fed Barkin speech (1:30 PM ET) | Barkin left the next step open with “We’ll see” on Tuesday; after a week in which Barr, Williams, Paulson and Hammack all hardened, whether he closes that gap is the cleanest read on how unified the committee has become. |
| Tue Sep 29 | S&P/Case-Shiller Home Price YoY Jul (prior 2.1%) | New home median prices are already down 5.8% year over year while builders buy volume with discounts; the resale series shows whether that discounting has reached the existing stock with mortgage rates now above 7%. |
| Tue Sep 29 | CB Consumer Confidence Sep (expected 90, prior 89.4) | The second read on a household mood that Michigan put at 48.1. The Conference Board series is weighted toward labour-market perceptions, so a hold near 90 against Michigan’s slide would confirm that the squeeze is about prices rather than jobs. |
| Tue Sep 29 | JOLTS Job Openings Aug (prior 7.271M) | Claims at 197K describe firings; JOLTS describes hiring appetite. With every hawkish speaker citing a labour market “around full employment,” a material drop in openings is the single data point that could reopen the case for pausing in October. |
| Tue Sep 29 | Fed Goolsbee speech (1:00 PM ET) | Goolsbee argued this week that policymakers should stop assuming oil shocks fade. With Brent ending the week above $104, whether he repeats it tells you if the “look through energy” convention is genuinely being abandoned. |
| Tue Sep 29 | Fed Musalem speech (1:30 PM ET) | The week’s most hawkish voice, who called the new range “on the accommodative side.” He speaks after the PMI and the Michigan expectations jump, both of which support his case. |
| Tue Sep 29 | Fed Williams speech (2:00 PM ET) | The vice chair called another hike by year-end “reasonable” on Thursday without committing to October. Three speakers in one afternoon, and his is the one the front end trades. |
| Tue Sep 29 | API Crude Oil Stock Change (prior 1.786M) | The first inventory read since the Brent-WTI spread reached its widest since May. A further US build would reinforce that the tightness is seaborne rather than domestic. |
| Wed Sep 30 | MBA 30-Year Mortgage Rate (prior 7.12%) | The first survey week fully priced above 7%, and the first to include the 10-year’s move to 5.225%. This is where the bond selloff becomes a household cost. |
| Wed Sep 30 | ADP Employment Change Sep (prior 38K) | The monthly counterpart to the weekly pulse that accelerated to 20,000 a week. A soft monthly figure against an accelerating weekly series would call the labour-market resilience story into question two days before payrolls. |
| Wed Sep 30 | Core PCE Price Index MoM Aug (expected 0.3%, prior 0.2%) | The week’s decisive release. It is the last major inflation print before the October 27–28 FOMC, and the first test of whether the PMI’s steepest input costs since 2022 and Michigan’s 4.6% expectations have reached actual consumer prices. |
| Wed Sep 30 | GDP Growth Rate QoQ Final Q2 (expected 1.6%, prior 2.1%) | A backward-looking figure that matters mainly for the gap it exposes: 1.6% for the second quarter against GDPNow tracking 5.0% for the third is an acceleration almost no forecaster has matched. |
| Wed Sep 30 | GDP Price Index QoQ Final Q2 (expected 6.4%, prior 3.6%) | The broadest inflation measure in the national accounts. A confirmed 6.4% would sit far above every consumer-price gauge and reinforce the case that price pressure is economy-wide rather than energy-specific. |
| Wed Sep 30 | Goods Trade Balance Adv Aug (expected −$108.5B, prior −$118.8B) | The first read on third-quarter net exports, and a live input to a current-account deficit that widened to 3.0% of GDP just as indirect bidders retreated at two Treasury auctions. |
| Wed Sep 30 | PCE Price Index MoM Aug (expected 0.4%, prior 0.2%) | The headline companion to core. A 0.4% monthly print would carry the energy shock the core measure strips out — the part households actually feel and the part Michigan’s expectations are responding to. |
| Wed Sep 30 | PCE Price Index YoY Aug (prior 3.7%) | Barkin cited July’s 3.7% headline and 3.3% core as the reason the committee hiked. The annual rate is the number that will be quoted in October either to justify another move or to argue the peak is in. |
| Wed Sep 30 | Personal Income MoM Aug (expected 0.4%, prior 0.4%) | Steady income growth is what has allowed spending to hold up while sentiment collapses. A miss here is the first thing that would break that reconciliation. |
| Wed Sep 30 | Personal Spending MoM Aug (expected 0.8%, prior 0.2%) | An expected quadrupling of the monthly pace, and the hard-data test of the divergence Costco’s 9.4% comps and Michigan’s 48.1 sentiment left open. |
| Wed Sep 30 | Retail Inventories Ex Autos MoM Adv Aug (prior 0.8%) | Rising inventories against strong spending would suggest retailers are restocking into tariff and freight costs rather than being caught short — relevant with container rates from Asia near records. |
| Wed Sep 30 | Wholesale Inventories MoM Adv Aug (prior 1.3%) | A GDP arithmetic input more than a signal, but a second consecutive large build would mean a chunk of the third quarter’s growth is stock rather than final demand. |
| Wed Sep 30 | Chicago PMI Sep (prior 47.1) | The one regional gauge still in contraction. If it stays below 50 while the national flash PMI prints 58.4, the strength is narrower than the headline implies. |
| Wed Sep 30 | EIA Crude Oil Stocks Change (prior 2.969M) | Last week’s surprise build did not stop Brent rebounding 4.43%, which is the clearest evidence the premium sits on seaborne barrels. A second build tests that reading. |
| Wed Sep 30 | EIA Gasoline Stocks Change (prior −1.686M) | With pump gasoline at $4.48 and diesel at a record, product inventories are now the politically sensitive series — and the one a diesel export decision would move first. |
| Wed Sep 30 | Fed Barkin speech (1:30 PM ET) | His second appearance of the week, and the first Fed comment to land after core PCE. The immediate reaction function on a live print is more informative than a prepared speech. |
| Wed Sep 30 | Fed Goolsbee speech (5:10 PM ET) | Post-PCE and post-close. Goolsbee’s framing — that a supply shock spilling into aggregate demand leaves “only the hard way” back — is the argument to watch for in the reaction. |
| Wed Sep 30 | Fed Kashkari speech (6:00 PM ET) | Kashkari opened the week saying inflation is too high “in all aspects of the economy.” He closes the PCE day, and a hardening from a 2026 voter would move October pricing overnight. |
| Thu Oct 1 | Initial Jobless Claims (week ending Sep 26, prior 197K) | The series that has removed the Fed’s reason to pause five weeks running. Anything above about 210K would be the first crack in that argument. |
| Thu Oct 1 | Fed Barkin speech (9:05 AM ET) | Third appearance in four sessions. Repetition at this frequency is itself a signal that the committee is working to align its message before October. |
| Thu Oct 1 | Fed Collins speech (9:05 AM ET) | One of the few policymakers who did not speak this week, which makes her the closest thing available to an unrevised view on the September hike. |
| Thu Oct 1 | Fed Schmid speech (9:05 AM ET) | Schmid spent Friday asking whether the AI “ecosystem” is becoming too big to fail — a financial-stability angle nobody else on the committee is pressing, and one that bears directly on the build-out financing story. |
| Thu Oct 1 | ISM Manufacturing Employment Sep (prior 51.2) | The flash PMI reported the fastest hiring since June 2022. This sub-index is the national check on whether factory payrolls are genuinely expanding. |
| Thu Oct 1 | ISM Manufacturing PMI Sep (expected 54.8, prior 54.6) | The definitive test of the flash PMI’s 57.0 manufacturing reading. ISM is the series institutional allocators trade, and a wide gap between the two would put the week’s central growth claim in doubt. |
| Thu Oct 1 | Fed Williams speech (3:30 PM ET) | His second appearance in three days, now with core PCE and ISM in hand. The vice chair speaking after both prints is the closest the week gets to a policy signal. |
| Thu Oct 1 | Fed Logan speech (6:45 PM ET) | Logan follows funding markets more closely than most. After two soft coupon auctions and a partly unused buyback, her read on Treasury demand is the relevant one. |
| Fri Oct 2 | Non Farm Payrolls Sep (expected 100K, prior 162K) | The month’s biggest release and the one that could still break the hawkish consensus. A 100K expectation against 162K prior is already a slowdown; a large miss would put an October hike back in genuine doubt. |
| Fri Oct 2 | Unemployment Rate Sep (expected 4.2%, prior 4.1%) | A tick up to 4.2% would be the first visible loosening in a labour market every hawkish speaker this week described as balanced or at full employment. |
| Fri Oct 2 | Average Hourly Earnings MoM Sep (prior 0.3%) | The flash PMI flagged intensifying wage pressure. This is the hard-data version, and the channel by which a supply shock becomes persistent inflation. |
| Fri Oct 2 | Average Hourly Earnings YoY Sep (prior 3.1%) | At 3.1% wage growth is not the source of a 3.7% headline PCE. Any acceleration here changes that judgement and with it the case that the shock is external. |
| Fri Oct 2 | Participation Rate Sep (prior 61.6%) | Determines how to read the unemployment rate. A rise driven by more people entering the workforce is benign; a rise with flat participation is not. |
| Fri Oct 2 | Factory Orders MoM Aug (prior 0.9%) | The revised, complete version of Friday’s advance durable goods report, including the 1.6% core capital-goods figure that anchored the week’s investment story. |
| Fri Oct 2 | Fed Logan speech (10:00 AM ET) | Ninety minutes after payrolls. The first official reaction to the month’s most consequential number, from a policymaker focused on market plumbing. |
WHAT TO WATCH NEXT WEEK:
1. Does core PCE ratify the PMI, or expose it as a survey artefact? The whole hawkish case built this week rests on soft data — a flash PMI, a business-expectations survey, a consumer survey. Wednesday’s August core PCE is the first hard price print since the September hike, and a 0.3% monthly reading with the headline at 0.4% would leave October effectively decided.
2. Can the long end find a buyer at 5.2%? Two coupon auctions tailed this week, indirect bidders retreated at both, and Treasury could not spend two-thirds of a tripled buyback. There is no coupon auction next week, which removes the immediate supply test but not the question — watch whether the 30-year holds above 5.5% through payrolls, and what Logan says about funding conditions on Thursday evening.
3. Does the USTR detail on Monday put numbers on the US-China framework? Greer promised “a lot more details” on September 28 and ruled out advanced semiconductors entirely. A tariff schedule with actual rates would be the first substance since the truce extension; another framework without figures confirms that January 10 has simply replaced November 10 as the deadline.
4. Does Micron justify a $1,000 share price on Wednesday? The week’s index records were built on the argument that memory, not compute, is the binding constraint on AI build-outs. Micron’s fiscal Q4 after the close is the only hard number available to test it, and it lands days after Reuters reported SK hynix is weighing a $150 billion valuation for Solidigm.
5. Is the diesel export decision made, or does the ambiguity persist another week? The president backed a ban, the Energy Secretary argued against one, the White House denied a 90-day plan, and nothing had appeared in the presidential-actions listing by Friday. Refiners’ export margins and the Brent-WTI spread are both hostage to an announcement rather than to fundamentals.
— US market commentary trusted by family offices and institutions. Apply for membership at join.recessionalert.comG. CHART OF THE WEEK -> TOP
WHY THIS CHARTFour of the week’s five charts explained a single day — freight pricing, the core PCE measurement quirk, the bank-versus-insurer split, the PMI backlog — and this one explains the whole of it in a single line: the median S&P 500 stock sits 18.6% below its own 52-week high in a week the index gained 1.21%. That is the week’s dominant tension drawn as one series, showing exactly where a 10-year above 5% has been doing its damage while the headline held.
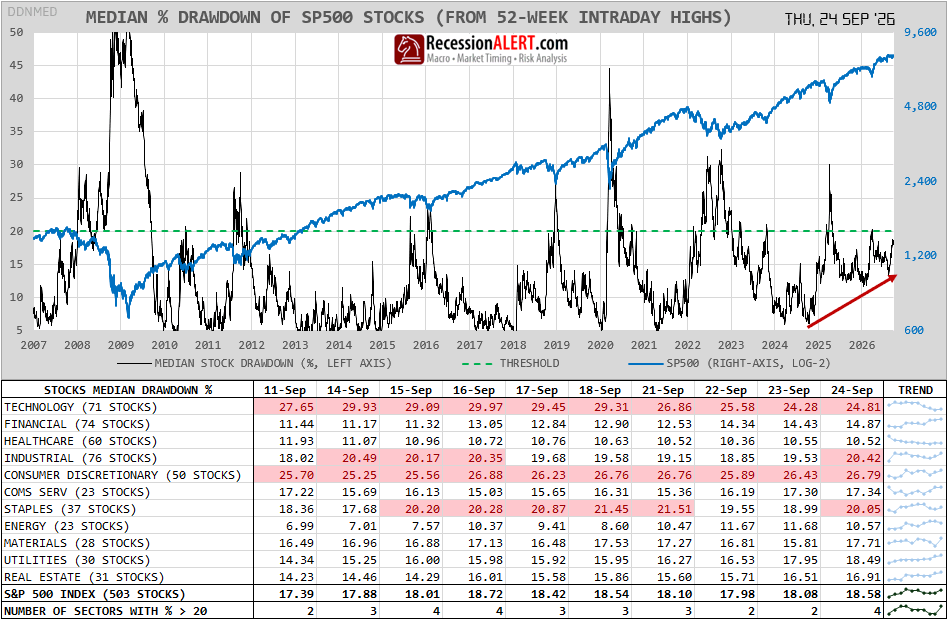
ORIGINAL CHART ANALYSIS — FROM FRIDAY’S MIBThe warning in this chart is not in its spikes but in how it heals between them. The line tracks how far the median S&P 500 stock sits below its own 52-week high. In past bull markets it spiked in corrections, then sank back to roughly 5-8% as rallies carried most stocks back to their highs. Since the April 2025 spike to about 30%, that reset has not come: the lows have held near 10-12%, and the line now reads 18.6%. Nor is this a few giants carrying the index; the equal-weight S&P 500, which counts every stock the same, led it through August. What broke is that no rally lifts everyone at once. Each lifts a new group and strands the last. As the 10-year yield climbed from 4.97% to 5.225%, its highest since 2007, the damage spread into utilities, financials and real estate. That fits: the typical company is more exposed to borrowing costs than the cash-rich giants atop the index, so with Treasuries paying over 5%, each rally leaves more stocks behind. The floor rose like this through 2007 and 2021 before bear markets, and through 2015 before a mere correction. A rally pulling the median back under about 10% would rebuild it. Until then, this is a bull market that has stopped healing between injuries — not dead, but older than the index admits.
What it means: an S&P 500 index fund near its record rests on fewer companies than it looks; the ten largest are 37.8% of it. The typical stock outside them, especially utilities, financials and real estate, is already in a correction. If the next rally lifts it back within about 8% of its high, the warning fades; if not, the index itself is exposed.
MIB Weekly Digest Ver. 2.05
For professional investors only. Not investment advice.
© 2026 RecessionALERT.com

Comments are closed.