
MIB WEEKLY DIGEST
Week of Jul 6–10, 2026
AI-infrastructure conviction defined the week: SK Hynix’s record $26.5B Nasdaq debut surged 14%, Meta rallied roughly 15% on its “Meta Compute” cloud pivot, and Broadcom extended a $30B+ Apple chip deal — even as a genuine US-Iran ceasefire collapse sent oil spiking as much as 5.9% and nine of eleven S&P sectors red mid-week. The Fed turned meaningfully more hawkish: 2026 rate-hike odds jumped to 59% after Williams named AI-driven demand his top inflation risk. Beneath the rally, SpaceX’s bonds traded at junk-equivalent spreads and high-multiple software names (Palo Alto, Palantir, Netflix) sold off sharply. The S&P 500 closed +1.24%; the Dow finished red.
TABLE OF CONTENTS
A. WEEK AT A GLANCE
B. WEEK IN MARKETS
C. WEEK’S TOP STORIES (10)
D. WEEK IN THE ECONOMY (5)
E. WEEK IN EARNINGS (1)
F. NEXT WEEK SETUP
G. CHART OF THE WEEK
A. WEEK AT A GLANCE -> TOP
The S&P 500 closed the week +1.24%, its gain concentrated in AI-infrastructure names even as the Dow finished red (-0.50%) on a mid-week Iran-driven selloff it never fully recovered from. The dominant driver was conviction in the AI-infrastructure buildout — Broadcom’s expanded Apple chip deal, Meta’s cloud pivot, and SK Hynix’s record Nasdaq debut — proving strong enough to absorb both a genuine US-Iran ceasefire collapse and a meaningfully more hawkish Fed. That resilience came with a real policy cost: 2026 rate-hike odds jumped to 59% by week’s end, setting up Tuesday’s CPI print and Chair Warsh’s congressional debut as the decisive next tests.
• S&P 500 +1.24% on the week, but the Dow closed red (-0.50%) — narrow, AI-concentrated leadership, not broad participation.
• SK Hynix’s $26.5B Nasdaq debut surged 14% on its first day — the largest-ever US listing by a foreign company.
• Meta rallied roughly 15% on the week — its best since February 2024 — on “Meta Compute” cloud plans and an in-house AI chip.
• Oil whipsawed on the Iran ceasefire collapse: WTI spiked as much as 5.9% mid-week before easing to close +4.34% on the week.
• Fed 2026 hike odds jumped 11 points to 59% Thursday after Williams named AI-driven demand his top inflation risk.
• SpaceX was the week’s worst mega-cap decliner (-10.31%) as its bonds traded at junk-equivalent credit spreads.
1. AI Infrastructure Conviction Overpowers Geopolitical and Policy Risk — a real Iran-conflict escalation and a hawkish Fed repricing both failed to derail the AI-infrastructure trade, which closed the week stronger than it started.
2. Within-AI Discrimination, Not a Single Basket — hardware/memory names (Broadcom, SK Hynix suppliers, Meta) rallied while high-multiple software names (Palo Alto, Palantir, Dell, Netflix) sold off, and even semiconductors split internally (AVGO/SNDK up, INTC/PANW down); investors are pricing AI winners and losers individually.
3. Credit Markets Are Flagging Risk Equities Aren’t Yet Pricing — SpaceX’s bonds trading at junk-equivalent spreads and gold’s failure to catch a haven bid during the Iran escalation both point to the same signal: credit and haven-asset markets are pricing risks the AI-focused equity tape has not yet reflected.
 — Leading economic indicators. Accurate market forecasts. Apply for membership at join.recessionalert.com
B. WEEK IN MARKETS -> TOP
The week’s arc pivoted twice: Wednesday’s US-Iran ceasefire collapse (US strikes on roughly 90 Iranian targets, oil +4-7% that session, nine of eleven S&P sectors red) delivered a genuine stagflation scare, only for Thursday-Friday’s AI-infrastructure conviction — SK Hynix’s record $26.5B Nasdaq debut (+14% at the open), Meta’s best week since February 2024 on its “Meta Compute” cloud plans, and Broadcom’s $30B+ Apple chip extension — to override it entirely, leaving the S&P 500 +1.24% on the week. Breadth stayed narrow: the Dow closed red (-0.50%), unable to shake Wednesday’s selloff, while Technology’s own internal dispersion (AVGO/DELL/SNDK up, INTC/PANW down on execution setbacks) shows even the winning trade wasn’t uniform. The clearest divergence: VIX fell 6.9% even as yields rose and Fed hike odds jumped to 59% on Williams’ AI-inflation warning — markets pricing AI upside and policy risk as separate stories, a tension Tuesday’s CPI will test.
FRIDAY CLOSE & WEEK-ON-WEEK CHANGE — Fri, Jul 10, 2026:
MAJOR INDICES
Dow Theory’s bull confirmation held all week, but Thursday delivered a clean non-confirmation moment: DJ Transportation surged 2.07% against the Dow’s 0.27%, a 1.8-point same-day gap reflecting semiconductor and industrial strength (the SK Hynix run-up) rather than genuine blue-chip participation. The Dow closed the week red (-0.50%) while the Nasdaq 100 (+1.72%) and S&P 500 (+1.24%) both advanced — Wednesday’s Iran-strike selloff hit the Dow hardest (-1.09% that session alone) and it never fully recovered, even as AI-infrastructure strength powered the broader tape through the week’s geopolitical noise.
| Index | Fri Close | WoW Change | WoW % | Why It Moved (Week) |
|---|---|---|---|---|
| S&P 500 | 7,575.25 | +92.55 | +1.24% | AI-infrastructure conviction (SK Hynix debut, Meta Compute) outweighed Wednesday’s Iran-driven selloff. |
| Dow Jones | 52,637.09 | -262.98 | -0.50% | Never fully recovered from Wednesday’s 577-point Iran-escalation drop despite two later record-adjacent sessions. |
| DJ Transportation | 22,178.1 | +163.0 | +0.74% | Thursday’s 2.07% surge (semiconductor/industrial strength) drove the weekly gain; Dow Theory bull confirmation held throughout. |
| Nasdaq 100 | 29,825.11 | +503.82 | +1.72% | SK Hynix debut, Meta’s AI-cloud surge, and Broadcom’s Apple deal offset Tuesday’s semiconductor valuation scare. |
| Russell 2000 | 2,978.64 | -16.29 | -0.54% | Small-caps lagged the mega-cap AI rally most sessions, confirming narrow, not broad, leadership. |
| NYSE Composite | 23,925.07 | -32.01 | -0.13% | Roughly flat on the week — broad tape muted versus the cap-weighted indices’ AI-driven gains. |
VOLATILITY & TREASURIES
VIX fell 6.9% on the week even as the 10Y (+9.1bps) and 2Y (+7.3bps) both backed up — an unusual split where equity fear eased while rates priced a more hawkish Fed, not the typical VIX-yield pairing. The divergence traces to a stack of hawkish catalysts: Wednesday’s FOMC minutes (nine of eighteen officials eyeing a hike), Thursday’s Williams remarks naming AI-driven demand his top inflation risk, and Friday’s first Warsh-era Monetary Policy Report vowing unhedged 2% commitment — none of which dented AI-rally-driven risk appetite.
| Instrument | Fri Level | WoW Change | Why It Moved (Week) |
|---|---|---|---|
| VIX | 15.03 | -1.11 (-6.88%) | Eased steadily as AI-rally conviction overrode the mid-week Iran-conflict spike. |
| 10-Year Treasury Yield | 4.560% | +9.1 bps | Hawkish FOMC minutes, Williams’ AI-inflation warning, and Friday’s Monetary Policy Report drove the repricing. |
| 2-Year Treasury Yield | 4.210% | +7.3 bps | Front end repriced on rising 2026 hike odds (Polymarket +11pp to 59% on Thursday alone). |
| US Dollar Index (DXY) | 100.97 | +0.11 (+0.11%) | Essentially flat on the week; no independent dollar signal. |
COMMODITIES
Gold slipped 0.53% and silver fell 2.08% on the week even with a fresh US-Iran strike escalation mid-week — the absence of a safe-haven bid confirms markets priced the conflict as contained, not a systemic shock. Copper’s +1.69% gain diverging from precious metals points to industrial-demand optimism outweighing the geopolitical premium. Bitcoin’s +4.29% tracked the equity risk-on tape (AI-rally driven) rather than decoupling into its own narrative.
| Asset | Fri Price | WoW Change | WoW % | Why It Moved (Week) |
|---|---|---|---|---|
| Gold | $4,113.70/oz | -$21.95 | -0.53% | No safe-haven bid despite Iran escalation; rising real-rate expectations outweighed haven demand. |
| Silver | $60.165/oz | -$1.275 | -2.08% | Tracked gold lower, amplified by mid-week industrial-demand jitters. |
| Copper | $6.2800/lb | +$0.1045 | +1.69% | Industrial-demand optimism diverged from the precious-metals softness. |
| Platinum | $1,629.00/oz | -$2.80 | -0.17% | Roughly flat; tracked the broader precious-metals complex. |
| Bitcoin | $64,206.0 | +$2,638.0 | +4.29% | Tracked the equity risk-on tape through the week’s AI-driven advance. |
ENERGY
WTI (+4.34%) and Brent (+6.19%) both rose on the week despite easing Thursday-Friday, as markets priced a bumpy but real US-Iran de-escalation path — Wednesday’s ceasefire-collapse spike (WTI +5.9% that session) never fully reversed. Henry Hub plunged 8.35% on an above-average storage build, decoupling entirely from crude, while Dutch TTF’s +10.37% gain reflects a genuine European supply squeeze (Russia’s diesel-export ban, tight regional storage) independent of the US natural-gas story.
| Asset | Fri Price | WoW Change | WoW % | Why It Moved (Week) |
|---|---|---|---|---|
| Crude Oil (WTI) | $71.41/bbl | +$2.97 | +4.34% | Wednesday’s Iran ceasefire-collapse spike held a net gain despite Thu-Fri de-escalation pricing. |
| Crude Oil (Brent) | $76.01/bbl | +$4.43 | +6.19% | Outpaced WTI on the week, tracking the same Iran-driven supply-shock premium. |
| Natural Gas (Henry Hub) | $2.940/MMBtu | -$0.268 | -8.35% | Plunged on an above-average EIA storage build; fully decoupled from crude’s Iran-driven gain. |
| Natural Gas (Dutch TTF) | $16.28/MMBtu | +$1.53 | +10.37% | Russia’s diesel-export ban and tight regional supply drove a European-specific gas squeeze. |
S&P 500 SECTORS — WEEKLY ROTATION
Energy’s sector-leading +3.50% week was broad-based — none of the week’s ten notable movers were Energy names, consistent with the Iran-driven crude rally lifting the whole sector rather than a single name. Technology’s modest +2.81% badly understates internal dispersion: AVGO, DELL, and SNDK were three of the week’s five biggest gainers, while INTC and PANW — both also Technology — ranked among the five biggest decliners on execution setbacks. Healthcare’s sector-worst -2.05% aligns with ABBV’s -4.98% weekly slide following its EPS-guidance cut.
| Sector | 1-Week | 1-Month | 3-Month | 6-Month | YTD | 12-Month |
|---|---|---|---|---|---|---|
| Energy | +3.50% | -3.68% | -5.54% | +23.36% | +22.85% | +26.57% |
| Technology | +2.81% | +2.20% | +24.21% | +20.03% | +21.97% | +34.32% |
| Communication Services | +1.28% | +0.10% | +6.24% | +4.05% | +5.04% | +34.42% |
| Consumer Cyclical | +0.94% | +1.53% | +3.36% | -4.99% | -3.39% | +5.10% |
| Financial | +0.66% | +6.83% | +9.65% | +3.91% | +5.33% | +13.60% |
| Utilities | -0.31% | +3.19% | -4.34% | +7.62% | +6.54% | +13.66% |
| Real Estate | -0.75% | +0.10% | +4.90% | +9.66% | +9.83% | +8.38% |
| Consumer Defensive | -1.02% | -0.27% | -1.67% | +8.47% | +7.03% | +5.07% |
| Healthcare | -2.05% | +5.70% | +7.67% | +1.41% | +5.17% | +19.95% |
| Basic Materials | -2.42% | -2.80% | -8.19% | +2.41% | +7.81% | +29.39% |
| Industrials | -2.63% | +0.43% | +3.23% | +12.43% | +16.13% | +21.90% |
TOP WEEKLY MOVERS:
Three of the five gainers — AVGO, DELL, SNDK — are Technology names, yet the sector closed the week up just 2.81%, understating the AI-hardware dispersion: INTC and PANW, both Technology, sit among the week’s biggest decliners on execution setbacks (18A yield delay, valuation-driven profit-taking). SNDK’s +9.79% extends a 707% YTD, 3,981% year run — momentum continuation, not reversal — while ANET’s 16.86% week builds on a 76% year gain, both AI-infrastructure demand stories the gif’s deeper horizon data confirms as multi-month trends. ABBV’s -4.98% aligns with Healthcare’s sector-worst -2.05% week; SPCX’s post-IPO slide is idiosyncratic, with no comparable sector read-through.
TOP 5 WEEKLY GAINERS
| Ticker | Week | YTD | Year | Why It Moved |
|---|---|---|---|---|
| ANET | +16.86% | +42.68% | +75.90% | New 1.6Tbps Etherlink AI-fabric switches with validated Meta/Microsoft/Oracle deployments, a 2026 revenue guide raised to $11.5B, and analyst price-target hikes to $190-200 (KeyBanc, BofA, Morgan Stanley) drove the rally; management called AI-networking demand “the best I’ve ever seen,” even as a supply crunch caps near-term shipments. |
| META | +14.81% | +1.38% | -7.98% | The planned “Meta Compute” AI cloud business — selling excess compute directly against AWS/Azure/Google Cloud — plus disclosure of an in-house “Iris” AI chip targeting 14GW of capacity at roughly half prior Street cost assumptions drove Meta’s best week since February 2024. |
| AVGO | +10.96% | +15.56% | +45.23% | A $30B+ multi-year custom-chip extension with Apple through 2031 (15B+ US-made chips) reassured investors on AI-silicon demand durability even as Erste Group downgraded shares on valuation. |
| DELL | +10.31% | +245.54% | +240.06% | Trump’s Oval Office endorsement at the Dell/Trump-Accounts launch ceremony and an Evercore price-target hike to $500 (citing 757% YoY AI-server revenue growth) drove the gain, though heavy insider selling and new bylaw restrictions on shareholder proposals tempered the advance late in the week. |
| SNDK | +9.79% | +707.11% | +3980.77% | Continued AI-memory demand tailwinds ahead of SK Hynix’s record Nasdaq debut, Goldman Sachs lifting its price target more than 83% and flagging a “very strong quarter,” and a Meta flash-memory supply deal drove the gain, even as some smart money began quietly trimming after the stock’s 635%+ YTD run. |
TOP 5 WEEKLY DECLINERS
| Ticker | Week | YTD | Year | Why It Moved |
|---|---|---|---|---|
| SPCX | -10.31% | – | – | Nasdaq-100 fast-track inclusion produced a “buy the rumor, sell the news” reaction — most of the estimated $4.3B in forced passive buying was already absorbed before the debut — while SpaceX’s bonds traded at junk-equivalent spreads on its $60B acquisition-driven debt load and AI-unit cash burn, and a lawsuit threatening the gas turbines powering its Colossus 2 data center added pressure. |
| INTC | -8.73% | +197.67% | +361.13% | Intel surged early in the week on price-target hikes (HSBC to $200, BofA to $160) and a semiconductor-sector rebound, then reversed sharply on its 18A foundry-node yield delay and AMD’s first-ever data-center revenue lead — erasing the early gains and then some. |
| PANW | -6.36% | +76.93% | +69.68% | Shares hit an all-time high mid-week on a string of analyst price-target hikes (BTIG, Wells Fargo, Needham) before reversing on valuation-driven profit-taking; Evercore cut its target to $320 from $375 even as underlying next-gen-security ARR growth guidance stayed strong. |
| NFLX | -5.51% | -21.75% | -41.33% | A brief bounce on reports Netflix won’t bid for NBCUniversal gave way to renewed pressure from subscriber-engagement concerns, reports the company is exploring live TV channels to offset a domestic growth plateau, and a Bernstein price-target cut to $100 ahead of the July 16 earnings report. |
| ABBV | -4.98% | +8.57% | +27.22% | Shares slipped after AbbVie trimmed full-year 2026 adjusted EPS guidance (to $13.91-$14.11) to absorb a $291M in-process R&D/milestone charge, with a Healthcare-sector-wide pullback overshadowing a same-week Bank of America price-target hike to $276. |
— Institutional-grade intelligence for serious investors. Apply for membership at join.recessionalert.comC. WEEK’S TOP STORIES -> TOP
Four threads defined the week. An AI-infrastructure conviction arc ran from Monday’s Broadcom-Apple chip deal through Tuesday’s Samsung/DeepSeek valuation scare to Friday’s SK Hynix debut (#1), running parallel to Meta’s own cloud-and-silicon pivot (#4) — together the week’s dominant force. A geopolitical-policy thread saw the Iran ceasefire collapse and refragment (#2) run alongside a new Fed chair’s hawkish drift (#3), both genuinely unresolved into next week. A valuation-discrimination thread punished high-multiple software and credit-stressed names (#5, #6) even as AI hardware rallied. And four standalone corporate/legal events (#7–#10) rounded out a week where conviction in AI infrastructure proved strong enough to absorb a real geopolitical shock and a hawkish Fed repricing simultaneously.
BULLISH
1. AI-Semiconductor Conviction Wins the Week: Broadcom-Apple Deal, Tuesday’s Valuation Scare, and SK Hynix’s Record $26.5B Nasdaq Debut
The core facts:Monday opened with Broadcom disclosing a multi-year custom-chip extension with Apple through 2031; Tuesday reversed hard as Samsung’s beat-but-sold-off earnings and a Reuters report that China’s DeepSeek is designing its own inference chip erased over $100B of Samsung value and dragged Intel (-9.66%), Marvell, SanDisk, KLA, and Lam Research down 6-11%. Wednesday, Apple and Broadcom finalized an expanded $30B+ agreement (15B+ US-made chips through 2031) and reports of Chinese H200 approval lifted Nvidia even as the broader tape sold off on Iran. Thursday the SOX index jumped 3.1% ahead of SK Hynix’s Friday listing; Friday SK Hynix priced at $149, opened at $170 (+14%), and closed with a $1.25 trillion market cap on 7x order-book oversubscription — the largest-ever US listing by a foreign company. The Trump administration separately eased UAE chip-export rules Friday, opening license-free Nvidia/AMD sales to Gulf AI buyers.
Why it matters:The week is a live stress-test of whether capital markets will keep financing the AI buildout at current valuations, and it answered emphatically yes — but only after a genuine mid-week scare exposed how thin the AI-equipment/memory complex’s margin for disappointment has become. Technology closed the week +2.81% (see sector rotation table in Section B), a number that flattens a week that actually swung from a >$100B single-day Samsung wipeout to a $1.25T oversubscribed debut. The UAE export easing is a structural, not one-day, tailwind that compounds the demand-durability signal.
What to watch:SK Hynix’s first session under its permanent SKHY ticker Monday; Intel’s July 23 earnings for foundry-yield and data-center-share commentary; hyperscaler capex guidance in late-July earnings for confirmation the demand signal holds.
UNCERTAIN
2. US-Iran Ceasefire Collapses, Then Markets Shrug It Off: From Tanker Strikes to a Fragile De-Escalation
The core facts:Iran struck at least two tankers near the Strait of Hormuz Tuesday, prompting the US Treasury to revoke Iran’s crude-export license; WTI jumped 5.32% that session. Wednesday, US Central Command struck roughly 90 Iranian targets, President Trump declared the ceasefire memorandum “over,” and oil surged a further 5.9-6.9% as nine of eleven S&P sectors sold off (Dow -1.09%). Thursday brought a second day of US strikes and Iranian retaliation against Kuwait/Bahrain targets, yet WTI fell 2.3% and equities rallied (S&P +0.81%) as markets priced a “bumpy but real” path to de-escalation. By Friday, oil had eased further (WTI -0.93%) on continuing technical talks, even as the IEA flagged a 1.2M bpd 2026 demand contraction.
Why it matters:The gap between Wednesday’s genuine risk-off (nine-of-eleven-sector selloff, gold failing to catch a haven bid) and Thursday-Friday’s shrug is itself the signal: markets are treating the escalation as contained and reversible rather than a durable supply shock, a read that remains fragile given Hormuz traffic (roughly 20% of global oil volume) stays well below pre-conflict levels. Energy still finished the week as the leading S&P sector (+3.50% — see Section B), even as oil gave back most of its mid-week spike.
What to watch:Whether Hormuz tanker traffic is physically disrupted again, and progress in ongoing US-Iran technical talks; any renewed Iranian threat against export infrastructure would force a rapid repricing of this week’s calm.
UNCERTAIN
3. Fed’s Hawkish Drift Under New Chair Warsh: FOMC Minutes, Williams’ AI-Inflation Warning Push 2026 Hike Odds to 59%
The core facts:Monday, Fed Governor Waller called forward guidance “more art than science,” visibly in tension with Chair Kevin Warsh’s data-only posture. Wednesday’s June FOMC minutes — Warsh’s first meeting — showed 9 of 18 officials eyeing a hike, with staff flagging AI-infrastructure demand as a structural inflation input. Thursday, NY Fed President Williams, traditionally a centrist, named AI-driven demand his “top inflation risk” and said the Fed “won’t look through” it; Polymarket’s 2026 hike-odds jumped 11 points in a single session to 59%. Friday, the Fed’s first Monetary Policy Report under Warsh vowed an “absolute commitment” to 2% inflation, setting up his House and Senate testimony next Tuesday and Wednesday. Warsh also named task-force leaders including Marc Andreessen (labor/AI) and Doug McMillon (data quality) Thursday.
Why it matters:A centrist voter (Williams) explicitly validating the hawkish minority meaningfully raises the odds Warsh’s committee tightens further this year, and it directly entangles Fed policy with the same AI-capex cycle powering the week’s equity rally (see Story 1) — an AI slowdown would now hit both growth and the policy path simultaneously. Yet a 30-year Treasury auction Thursday cleared at the richest yield since 2007 with blowout foreign demand (77.7% indirect bidders), suggesting credit markets aren’t yet panicking about the hawkish repricing.
What to watch:Tuesday’s June CPI print and Warsh’s same-day House testimony (Senate follows Wednesday) are the two highest-probability catalysts for the next repricing of 2026 hike odds in either direction.
BULLISH
4. Meta’s AI-Cloud Pivot: “Meta Compute,” In-House Iris Chip, and a $9.2B Canadian Data Center Anchor the Stock’s Best Week Since 2024
The core facts:Wednesday, Meta committed C$13B (~$9.2B) to a 1-gigawatt Alberta AI data center — its first in Canada. Friday, shares rose 5.97% to $669.21, extending the week’s gain to roughly 15%, on continued enthusiasm for a planned “Meta Compute” AI cloud business that would compete directly with AWS, Azure, and Google Cloud, plus disclosure of an in-house “Iris” AI chip targeting 14GW of capacity at roughly half prior Street cost assumptions. Meta ended the week as the second-biggest weekly gainer among mega-caps (see weekly movers table in Section B).
Why it matters:Meta’s disclosure that its in-house chip costs run roughly half of Street assumptions is a genuine capex-efficiency signal that, if it holds, eases the exact investor concern — unmonetized, escalating AI capex — that has periodically hit the stock all year. It also demonstrates hyperscaler AI-infrastructure spending is still accelerating even as the broader software complex de-rates (see Story 5), reinforcing that investors are discriminating within the AI trade, not abandoning it.
What to watch:Confirmation of the Iris chip’s September production start; Meta’s Q2 earnings call for formal capex guidance and Meta Compute’s monetization timeline.
BEARISH
5. Valuation Reset Sweeps High-Multiple Software: Palo Alto, Palantir, Dell, Marvell, and Netflix All Slide Even as AI Hardware Rallies
The core facts:Palo Alto Networks hit an all-time high Monday on a string of analyst upgrades, then fell 5.5% Wednesday and another 3.67% Friday on profit-taking despite Evercore trimming (not abandoning) its target; the stock finished the week -6.36%. Palantir fell 4% Wednesday, extending a 29-40% pullback from its 2026 highs. Dell and Marvell each fell 3-4% Friday on AI-server margin and custom-ASIC competition concerns. Netflix fell 2.78% Friday to a fresh multi-month low, down 5.51% on the week, on subscriber-engagement worries and reports it may launch live TV channels; Bernstein cut its target to $100 from $110.
Why it matters:The divergence between AI-infrastructure hardware (rallying, see Story 1) and high-multiple software/platform names (de-rating) shows investors discriminating sharply within the broader technology trade rather than treating it as one basket — a rotation likely to persist as long as rate-cut conviction stays low (see Story 3). PANW and Dell both appear among the week’s top mega-cap decliners (see Section B), underscoring the pattern isn’t isolated to one name.
What to watch:Whether the valuation-reset selloff broadens further into cybersecurity and enterprise software; Netflix’s July 16 earnings for subscriber and engagement metrics.
BEARISH
6. SpaceX’s Nasdaq-100 Debut Reveals Credit Stress as Bonds Trade at Junk-Equivalent Spreads
The core facts:SpaceX joined the Nasdaq-100 Tuesday under a new fast-track rule just 15 trading days after its June 12 IPO, but shares fell 6.34% that day as most of an estimated $4.3B in forced passive buying had already been absorbed — a classic “buy the rumor, sell the news” pattern. The stock kept sliding into Friday (-4.51%), down 10.31% on the week (the week’s worst mega-cap decliner — see Section B), as nominally BBB-rated SpaceX bonds traded at spreads consistent with BB (junk) credit, tied to $17.5B in debt assumed from its ~$60B xAI/X acquisition and a reported $30B annualized AI-unit cash-burn rate.
Why it matters:A roughly $1.9 trillion-valued company’s debt trading at junk-equivalent spreads is a genuine credit-stress signal, not noise. Because SpaceX’s financing has become a bellwether for how capital markets price the broader AI-infrastructure buildout (alongside Story 1), further deterioration here would raise real questions about financing conditions for other capital-intensive AI bets.
What to watch:Any formal credit-rating action from Moody’s, S&P, or Fitch; whether SpaceX’s bond spreads stabilize or widen further.
UNCERTAIN
7. Vertex Pharmaceuticals to Acquire Crinetics for $10 Billion, One of 2026’s Largest Biotech Deals
The core facts:Vertex agreed Monday to acquire Crinetics Pharmaceuticals for $85.00/share in cash (~$10B, ~$8.8B net of Crinetics’ cash), unanimously approved by both boards and expected to close Q3 2026. Crinetics markets PALSONIFY, the first once-daily oral acromegaly therapy; Vertex projects combined peak revenue above $5B, becoming accretive to non-GAAP operating income in 2029, financed via a $4.5B Bank of America/Morgan Stanley bridge facility. Crinetics shares surged over 100%; Vertex traded roughly 0.5% lower.
Why it matters:This is one of the largest biotech acquisitions of 2026 and signals continued large-cap pharma appetite for commercial-stage rare-disease assets over organic R&D. Vertex’s modest decline reflects standard deal-financing digestion (debt-funded, multi-year accretion) rather than strategic disapproval; Crinetics’ full premium pop confirms an uncontested bid.
What to watch:Regulatory clearance and the Crinetics shareholder vote ahead of the targeted Q3 2026 close.
BULLISH
8. Trump Rings NYSE/Nasdaq Bell From the Oval Office, Launches “Trump Accounts” With a $6B Dell Family Pledge
The core facts:President Trump rang the opening bell of both the NYSE and Nasdaq from the Oval Office Monday — the first time either bell has been rung from the White House — marking the launch of “Trump Accounts,” a new tax-advantaged investment program for American children. Michael and Susan Dell attended and pledged more than $6 billion to the program; Trump promoted Dell computers directly during the ceremony, and Dell shares rallied 4.43% that day (extending to +10.31% on the week — see Section B).
Why it matters:Beyond Dell’s single-stock pop, a nationwide tax-advantaged child investment program is a material new federal financial-policy initiative with potential long-run implications for retail investment flows and household balance-sheet formation, while the White House staging itself signals this administration’s active use of capital markets as a policy and messaging tool.
What to watch:Enrollment and funding details as Trump Accounts roll out; whether other companies pursue similar high-profile funding pledges.
BEARISH
9. State AGs Prepare Antitrust Suit to Block $110B Paramount Skydance-Warner Bros. Discovery Merger
The core facts:Reuters reported Thursday that California, New York, Pennsylvania, and roughly ten other states are finalizing an antitrust lawsuit to block Paramount Skydance’s approximately $110 billion acquisition of Warner Bros. Discovery, arguing the deal would harm entertainment and news competition. Paramount Skydance shares fell 6% on the report; the company has publicly denied the allegations and is separately seeking dismissal of earlier private litigation.
Why it matters:This would be one of the largest media mergers on record, and a coordinated multi-state suit layered on top of the DOJ’s existing Second Request review materially raises the odds of a prolonged legal fight or forced deal restructuring — a reminder antitrust enforcement remains an active constraint on large-scale consolidation even in a generally permissive M&A environment.
What to watch:Formal filing of the state lawsuit, expected within weeks; any parallel DOJ Second Request outcome or divestiture requirement.
UNCERTAIN
10. Apple Sues OpenAI Alleging Trade-Secret Theft Tied to AI Hardware Ambitions
The core facts:Apple filed suit Friday in Northern California federal court against OpenAI, its io Products hardware unit, and two former Apple employees, alleging OpenAI leadership directed a pattern of trade-secret theft to accelerate its consumer AI hardware ambitions — including use of Apple project code names in recruiting and retention of confidential product documents. Apple’s complaint states more than 400 former Apple employees now work at OpenAI, which acquired Jony Ive’s io Products for roughly $6.5 billion.
Why it matters:The suit is a direct escalation in the Apple-OpenAI consumer-AI-hardware rivalry and signals how seriously incumbent hardware makers are treating personnel and IP leakage to AI-native competitors — a dynamic relevant to any public company competing for AI talent, even though OpenAI itself has no direct public-market read-through.
What to watch:OpenAI’s formal response and whether Apple seeks a preliminary injunction that could delay or constrain OpenAI’s hardware product timeline.
— Separating signal from noise since 2007. Apply for membership at join.recessionalert.comD. WEEK IN THE ECONOMY -> TOP
This week’s dominant macro tension is Fed-cut bets re-pricing hawkish: 2026 hike odds jumped 11 points to 59% Thursday after Williams named AI-driven demand his top inflation risk, compounding Wednesday’s FOMC minutes showing nine of eighteen officials already eyeing a hike. The curve confirmed the repricing — the 10Y rose 9.1bps and 2Y rose 7.3bps on the week (see Section B) — even as hard data stayed mixed: ISM Services growth cooled to 54.0 while its employment gauge posted its best reading since 2024, and jobless claims beat at 215K even as Pantheon flagged a labor-force-participation “snapback” risk that could mechanically lift unemployment later this year. Tuesday’s June CPI print is the week’s decisive next data point — a hot reading validates the hawkish repricing already underway; a cool one forces it into reverse just as fast.
POLYMARKET ODDS — WEEK-ON-WEEK SHIFT:
| Market | Last Friday | This Friday | Δ |
|---|---|---|---|
| US Recession by end-2026 | N/A | N/A | N/A |
| Fed rate hike in 2026 | N/A | 59% (Thu) | N/A |
| Fed rate cuts ≥1 in 2026 | N/A | ~22% (Thu) | N/A |
Last-Friday baseline unavailable: July 3 had no trading session (Independence Day observed) and the substitute baseline daily (Thu, Jul 2) did not report these levels. This-Friday levels reflect the most recent print in the target week (Thursday, Jul 9) where Friday’s daily did not restate them.
UNCERTAIN
ISM Services PMI Eases to 54.0 in June as Hiring Jumps and Price Pressures Cool (ISM, Mon, Jul 6)
What they’re saying:The ISM Services PMI eased to 54.0 in June from 54.5, matching consensus. Business Activity slowed to 55.4 from 57.7 and New Orders eased to 55.1 from 57.3. The Employment Index jumped to 51.2 from 47.9 — its largest increase since 2024 and the first expansion in four months — while the Prices Index eased to 67.7 from 71.3, a four-month low.
The context:The report cuts both ways for the week’s macro debate: decelerating services growth alongside the sector’s first hiring expansion in months complicates any clean “labor is cooling” read, while the cooler prices component offers the Fed modest reassurance even as Thursday’s Williams remarks and Friday’s Monetary Policy Report kept the tone hawkish (see Section C).
What to watch:July ISM Services PMI due Aug. 5, for whether the hiring rebound holds against this week’s other mixed labor signals.
BULLISH
Initial Jobless Claims Fall to 215K, Beating Estimates as the Labor Market Holds Resilient (Dept. of Labor, Thu, Jul 9)
What they’re saying:Initial jobless claims for the week ended July 4 came in at 215,000, below the 218,000 consensus and down from the prior week’s revised 217,000. The four-week moving average eased to 218,750 from 222,500, continuing a gradual downtrend.
The context:The beat reinforces labor-market resilience even as pockets of softness show elsewhere (ADP’s weekly pulse, participation concerns below); landing the same day as Williams’ hawkish AI-inflation remarks, it added to the case the Fed sees no urgency to ease, reinforcing the week’s hawkish repricing (see the macro synthesis above).
What to watch:Continuing claims (1.814M, still cycle-elevated) for signs re-employment is slowing; the July nonfarm payrolls report due in early August.
UNCERTAIN
Existing Home Sales Fall to 4.09M in June, Missing Estimates as Median Price Hits Record $440,600 (NAR, Thu, Jul 9)
What they’re saying:Existing home sales fell 2.4% month-over-month to a seasonally adjusted annual rate of 4.09 million units, below the 4.20 million consensus and down from May’s 4.19 million pace. The median existing-home price climbed to a record $440,600, up 1.8% year-over-year.
The context:NAR’s own affordability index actually improved to 102.3 from 95.5 a year ago and sales remain up 2.8% year-over-year — a two-speed housing market of improving affordability but rate-sensitive month-to-month demand. Realtor.com separately trimmed its 2026 sales and price-growth forecasts this week, citing Middle East-driven rate pressure (see Iran arc in Section C).
What to watch:New and pending home sales over the next two weeks; the 30-year mortgage rate (6.49% as of Thursday) for any relief that could unlock demand.
BEARISH
Pantheon Warns of Unemployment “Snapback” Risk as Labor-Force Participation Hits a 50-Year Low (Pantheon Macroeconomics, Wed, Jul 8)
What they’re saying:Pantheon Macroeconomics flagged that the labor-force participation rate’s slide to 61.5% — the lowest outside the pandemic since 1976, after a 720,000 drop in the labor force in June concentrated among prime-age workers — leaves the job market vulnerable to a “snapback” in unemployment in the second half of 2026 if discouraged workers re-enter.
The context:A falling participation rate has been artificially flattering the headline unemployment rate; any reversal would mechanically push unemployment higher even without net job losses, complicating the Fed’s read on labor-market slack precisely as hike odds are rising (see the macro synthesis above and the Fed thread in Section C).
What to watch:July’s employment report (Aug. 1) for early signs of a participation rebound.
UNCERTAIN
May Trade Deficit Widens to $77.6B, Biggest Gap Since March 2025, as Import Surge Weighs on Q2 GDP (BEA, Tue, Jul 7)
What they’re saying:The trade deficit widened to $77.6 billion from a revised $54.6 billion in April, roughly in line with the $78.5 billion estimate. Imports climbed 3.3% to a more-than-one-year high of $395.3 billion — led by pharmaceuticals, cell phones, crude oil, and passenger cars — while exports fell 3.2% to $317.7 billion.
The context:A widening deficit subtracts directly from GDP’s net-exports component; the Atlanta Fed’s GDPNow eased to 1.3% from 1.4% partly reflecting the drag, even as the deficit remains 40.6% narrower than the same period in 2025 — tariff-driven import front-running remains the dominant, ongoing distortion rather than a new structural shift.
What to watch:The BEA’s advance Q2 GDP estimate (late July) for confirmation of the net-export drag; June trade data due mid-August.
— Know the probability before the market prices in the risk. Apply for membership at join.recessionalert.comE. WEEK IN EARNINGS -> TOP
TOP EARNINGS OF THE WEEK
UNCERTAIN
1. PepsiCo (PEP): -3.26% | Beats on EPS and Revenue, But Margin Contraction and a Cautious North America Outlook Weigh
The Numbers:Revenue of $24.18B beat the $23.95B estimate (+0.98% surprise); adjusted EPS of $2.20 beat the $2.19 estimate; GAAP EPS of $2.18 beat the $2.16 estimate. Released BMO, Thursday, Jul 9. The company reaffirmed full-year 2026 guidance of 2-4% organic revenue growth and 4-6% core constant-currency EPS growth.
The Problem/Win:Despite the top- and bottom-line beat, core operating margins contracted roughly 40 basis points and North American demand stayed weak as inflation-pressured consumers pulled back, offsetting stronger international volume growth; investors focused on the margin pressure and cautious tone rather than the headline beat.
The Ripple:The reaction extends a pattern visible across the week’s consumer names — Costco (-4.24% Thursday on a comp-sales deceleration) and Netflix (-2.78% Friday on engagement concerns, see Section C) were both marked down on demand/margin softness even where headline metrics cleared the bar.
What It Means:Reaffirmed guidance suggests management doesn’t see structural deterioration, but the market is signaling reduced tolerance for margin softness in staples names amid a still-pressured North American consumer.
What to watch:Commentary on North American pricing and volume trends at the next earnings call; whether input-cost inflation pressures margins further in H2.
WEEK AHEAD PREVIEW:
Q1 2026 earnings season is complete. Q2 2026 earnings season opens Tuesday, July 14, with the four largest U.S. banks reporting before the bell — the traditional kickoff that sets the tone for the broader season.
JPMorgan Chase (JPM) — BMO, Tue Jul 14 — net interest income guidance, trading and investment-banking revenue trends, and credit-provision levels across consumer and commercial books will set the tone for the sector.
Bank of America (BAC) — BMO, Tue Jul 14 — net interest income trajectory and consumer-banking margin trends as rate-cut expectations continue to shift.
Goldman Sachs (GS) — BMO, Tue Jul 14 — whether the firm’s investment-banking and M&A momentum (global deal-making tracked roughly $1.2 trillion in Q2) extends into results, alongside Global Banking & Markets and Asset & Wealth Management growth; the firm’s board is also expected to act on a previously announced quarterly dividend increase to $5.00 from $4.50 per share.
Wells Fargo (WFC) — BMO, Tue Jul 14 — net interest income guidance and expense discipline following the lifting of its asset cap.
Citigroup (C) — BMO, Tue Jul 14 — progress on its multi-year restructuring alongside capital-markets and international consumer-banking trends.
The money-center banks’ results will set the tone for broader S&P 500 reporting, which accelerates through late July.
— US market commentary trusted by family offices and institutions. Apply for membership at join.recessionalert.comF. NEXT WEEK SETUP -> TOP
UPCOMING RELEASES:
| Date | Event | Why It Matters |
|---|---|---|
| Mon, Jul 13 | Monthly Budget Statement (prior -$293B) | Tracks the federal fiscal-deficit trajectory heading into the second half of the fiscal year. |
| Tue, Jul 14 | ADP Employment Change Weekly (prior 21.0K) | High-frequency hiring pulse after two straight weeks of deceleration. |
| Tue, Jul 14 | Core & Headline CPI MoM/YoY (prior 0.2% / 2.9% core; 0.5% / 4.2% headline) | The week’s single most important print — decisive for whether this week’s hawkish Fed repricing (hike odds to 59%) holds or reverses. |
| Tue, Jul 14 | Fed Chair Warsh House Testimony | First congressional testimony of his tenure, landing the same day as CPI — a live test of the week’s unsettled Fed communication framework. |
| Tue, Jul 14 | Fed Goolsbee Speech; Net Long-term TIC Flows (prior $103.1B) | Additional Fed voice on the rate path; TIC flows gauge foreign demand for US assets amid this week’s hawkish repricing. |
| Wed, Jul 15 | Core & Headline PPI MoM/YoY (prior 0.4% / 4.9% core; 1.1% headline) | Pipeline inflation pressure feeding into the Fed’s preferred PCE gauge. |
| Wed, Jul 15 | Fed Chair Warsh Senate Testimony; Fed Williams Speech; Fed Beige Book | A second day of Fed testimony plus the Beige Book’s qualitative regional read ahead of the July 28-29 FOMC meeting. |
| Wed, Jul 15 | NY Empire State Manufacturing Index (prior 5.70); MBA 30-Year Mortgage Rate (prior 6.58%); EIA Crude Oil & Gasoline Stocks | Regional manufacturing health, housing-affordability, and oil-supply gauges amid the still-fragile Iran de-escalation (see Section C). |
| Thu, Jul 16 | Initial Jobless Claims (prior 215K); Philly Fed Manufacturing Index (prior 10.3) | Weekly labor-market pulse and a second regional manufacturing read, both feeding into the Fed’s data-dependent posture. |
WHAT TO WATCH NEXT WEEK:
1. Does Tuesday’s CPI validate or reverse the week’s hawkish repricing? After hike odds jumped to 59% on Fed rhetoric alone, a cool print would force a rapid unwind heading into the July 28-29 FOMC, while a hot one would cement it.
2. Can Chair Warsh’s testimony reconcile the Fed’s still-unsettled communication framework? Waller’s “more art than science” stance, Williams’ AI-inflation warning, and Warsh’s own data-only posture produced three different signals in one week; his House and Senate testimony is the first chance to unify them.
3. Does the AI-infrastructure conviction trade survive contact with money-center bank earnings? JPMorgan, Bank of America, Goldman Sachs, Wells Fargo, and Citigroup kick off Q2 season Tuesday; trading-revenue commentary tied to this week’s volatility (Iran, SK Hynix’s debut) is an early test of whether the rally’s breadth extends into financials.
4. Does the SpaceX credit-stress signal spread to other AI-capex-heavy balance sheets? With SpaceX bonds trading at junk-equivalent spreads, similar strain surfacing elsewhere would validate the tension this week’s Chart of the Week (below) flagged between AI equity euphoria and credit-market skepticism.
— US market commentary trusted by family offices and institutions. Apply for membership at join.recessionalert.comG. CHART OF THE WEEK -> TOP
WHY THIS CHARTThis chart’s warning that AI credit markets are pricing an exit even as equities price the upside proved directly prescient this week — SpaceX’s bonds traded at junk-equivalent spreads by Friday (see Section C, Story 6), while the same AI-infrastructure trade delivered SK Hynix’s record Nasdaq debut and Broadcom’s expanded Apple chip deal (Story 1). No other candidate this week captured both halves of that central tension as cleanly.
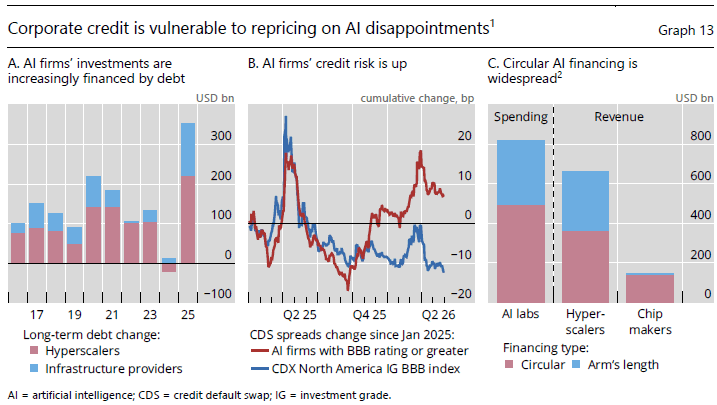
ORIGINAL CHART ANALYSIS — FROM MONDAY’S MIBEquity markets and credit markets are reading the same AI balance sheets and reaching opposite conclusions — and history says the bond desk is the one to believe. Since January 2025, five-year CDS on investment-grade AI names has decoupled from the broad CDX IG BBB index, swinging to roughly +5bp and widening while the benchmark grinds ~15bp tighter — a 20bp gap that opened even as equity indices printed records (Panel B). Two structural facts argue it has further to run. First, the leverage is new and unrepriced: after a net ~$40bn paydown in 2024, AI-linked issuers levered up by a record ~$340bn in 2025, roughly double the 2020 peak (Panel A). Second, the plumbing is reflexive: circular financing accounts for ~58% of lab and ~57% of hyperscaler commitments — and an extraordinary ~96% of chip-maker commitments, the most-exposed link, whose forward book is almost entirely equity-for-purchase deals struck with their own customers. Their demand has no independent buyer of last resort; it evaporates the quarter one hyperscaler throttles capex, and with the same collateral potentially pledged twice, the true leverage stays unmappable until it crystallizes. Credit is the wire through which this reaches the real economy — the only precedents for synchronised equity-and-credit corrections are the GFC and March 2020. Equity is pricing the upside; credit is pricing the exit — and the credit line has not finished moving.
MIB Weekly Digest Ver. 1.70
For professional investors only. Not investment advice.
© 2026 RecessionALERT.com

Comments are closed.