
MARKET INTELLIGENCE BRIEF (MIB)
Monday, July 13, 2026
Trump reinstated a Strait of Hormuz blockade on Iran, sending WTI up 9%, S&P 500 down 0.79%, Nasdaq 1.88%, and VIX up 14%. Fed’s Waller reopened rate-hike odds ahead of Tuesday’s CPI, lifting 10Y yields to 4.626%. Oracle (-6.47%) hit a 52-week low on a credit downgrade over OpenAI concentration risk, while SK Hynix cratered 15% in Seoul and SanDisk (-12.63%) led a NAND selloff. Gold fell 2.55% despite the escalation, dollar strength overriding safe-haven demand.
TABLE OF CONTENTS
A. EXECUTIVE SUMMARY
B. MARKET DATA
C. HIGH-IMPACT STORIES (5)
D. MODERATE-IMPACT STORIES (5)
E. ECONOMY WATCH (2)
F. EARNINGS WATCH (0)
G. WHAT’S NEXT
H. CHART OF THE DAY
A. EXECUTIVE SUMMARY -> TOP
Equities sold off broadly Monday (S&P 500 -0.79%, Nasdaq 100 -1.88%, Dow -0.26%) after Trump reinstated a Strait of Hormuz naval blockade on Iran, with enforcement beginning Tuesday under an explicit 20% transit toll — a materially more aggressive posture than prior sanctions pressure that opens an extended flashpoint for retaliation. The 9% WTI spike collided with Fed Governor Waller’s warning that a rate hike is back on the table if Tuesday’s CPI runs hot, pushing the 10-year yield to 4.626% and the VIX up 14% — a combination markets have historically struggled to price with a single policy tool: a supply-side energy shock layered onto an already-hawkish inflation debate. Gold’s failure to catch a safe-haven bid — falling 2.55% as the dollar firmed — signals rates, not geopolitics, are currently driving cross-asset positioning. The selloff was narrow and tech-concentrated: Energy was the lone sector gainer, while Oracle, SanDisk, and Intel separately absorbed AI-capex credit and NAND-oversupply concerns, deepening the large-cap/small-cap breadth divergence.
• S&P 500 -0.79%, Nasdaq 100 -1.88%, Dow -0.26% as Trump reinstates the Hormuz blockade; WTI +9.13% to $77.93, VIX +14.11% to 17.15.
• Fed’s Waller says a rate hike is “back on the table” ahead of Tuesday’s CPI; July hike odds rise to 43.3%, 10Y yield to 4.626%.
• Oracle (-6.47%) hits a fresh 52-week low after S&P Global downgrades to BBB- on OpenAI concentration risk and a projected -$42B FY2027 FCF deficit.
• SK Hynix plunges a record 15.37% in Seoul (Kospi trading halted) on a profit-miss call; SanDisk (-12.63%), Intel (-6.12%), and Lam Research (-5.83%) lead a broad NAND/semiconductor selloff.
• Gold falls 2.55% to $4,008.65/oz despite the Iran escalation, decoupling from its traditional safe-haven role as dollar strength dominates.
• Citi lifts Apple’s target to $365 and JPMorgan upgrades American Express to Overweight, both citing insulation from an Iran-driven energy shock ahead of earnings.
1. Energy shock meets a hawkish Fed — The Hormuz blockade’s 9% oil spike lands the same week as Waller’s rate-hike warning and Tuesday’s CPI, raising the odds a supply-side price shock gets read as confirmation of sticky inflation rather than a one-off geopolitical premium — a combination the Fed has historically struggled to address with a single tool.
2. AI-capex financing scrutiny is widening beyond hyperscalers — Oracle’s credit downgrade and the SK Hynix/SanDisk NAND selloff are separate events, but both show the market now pricing credit and memory-supply risk into the AI-infrastructure trade, not just growth assumptions.
3. Breadth keeps deteriorating beneath calm headline indices — The large-cap-over-small-cap gap widened again today, and Technology’s outsized decline against a narrow, Energy-only sector advance shows today’s modest index moves mask a far more concentrated rotation underneath.
 — Leading economic indicators. Accurate market forecasts. Apply for membership at join.recessionalert.com
B. MARKET DATA -> TOP
Markets sold off after Trump reinstated a Strait of Hormuz blockade on Iran late Sunday, sending WTI crude up 9.13% to $77.93 and pulling the S&P 500 down 0.79% and Nasdaq 100 down 1.88% as tech retreated. This was an energy-vs-growth rotation — Energy (+2.73%) was the lone sector gainer while Technology (-2.39%) led losses, with Consumer Defensive and Utilities also catching a modest defensive bid. The standout anomaly: gold fell 2.55% despite the escalation, pressured by a firming dollar rather than acting as a safe haven, while SanDisk cratered 12.63% on a NAND pricing/guidance cut. Rising yields alongside VIX’s 14.11% spike signal inflation-fear positioning as crude’s surge threatens price expectations.
CLOSING PRICES – Monday, July 13, 2026:
MAJOR INDICES
Nasdaq 100’s 1.88% drop dwarfed the Dow’s 0.26% dip — a concentrated tech selloff, not a market-wide rout. Dow Theory bull confirmation extends into a second session: both DJIA and DJTA sit within 1% of their 10-session highs, with DJTA (+0.15%) actually outpacing DJIA (-0.26%) today despite the tech carnage. Large-cap leadership over small-caps deepened to a 3.8-point 10-session gap (S&P +2.21% vs Russell -1.60%) — breadth continues deteriorating beneath the index-level calm.
| Index | Close | Change | %Move | Why It Moved |
|---|---|---|---|---|
| S&P 500 | 7,515.84 | -59.55 | -0.79% | Broad risk-off on renewed Iran/Hormuz blockade; tech-led decline |
| Dow Jones | 52,498.82 | -138.19 | -0.26% | Blue-chip resilience; Energy components offset tech-adjacent weakness |
| DJ Transportation | 22,210.4 | +32.6 | +0.15% | Held up despite broader selloff; Dow Theory bull confirmation intact |
| Nasdaq 100 | 29,264.10 | -561.01 | -1.88% | Tech-heavy index hit hardest; SanDisk, Oracle, Intel led sector declines |
| Russell 2000 | 2,954.50 | -23.31 | -0.78% | Small-caps tracked broader market lower; mega-cap leadership persists |
| NYSE Composite | 23,896.05 | -29.02 | -0.12% | Broadest measure showed a more modest decline than headline indices |
VOLATILITY & TREASURIES
VIX’s 14.11% spike arrived alongside rising yields (10Y +5.7bps, 2Y +7.8bps) — an inflation-fear signature, not recession fear, as crude’s 9% surge threatens to filter into price expectations. The 2Y outpacing the 10Y modestly steepens curve pressure from the front end. DXY’s 0.32% gain confirms a genuine dollar bid rather than a broad flight to Treasuries, which sold off alongside equities.
| Instrument | Level | Change | Why It Moved |
|---|---|---|---|
| VIX | 17.15 | +2.12 (+14.11%) | Volatility spike on Iran conflict escalation and blockade renewal |
| 10-Year Treasury Yield | 4.626% | +5.7 bps | Inflation-fear repricing as oil surge threatens price expectations |
| 2-Year Treasury Yield | 4.286% | +7.8 bps | Front-end led the move higher, steepening curve pressure |
| US Dollar Index (DXY) | 101.24 | +0.32 (+0.32%) | Firmed on flight-to-quality bid amid Iran conflict escalation |
COMMODITIES
Gold fell 2.55% despite the Iran escalation — a genuine anomaly, pressured by dollar strength rather than behaving as a safe haven. Silver (-3.62%) and platinum (-1.07%) followed lower while copper was roughly flat (-0.10%), showing precious metals moving together on FX rather than splitting on demand signals. Bitcoin’s 2.78% decline tracked the broader risk-off tape rather than decoupling.
| Asset | Price | Change | %Move | Why It Moved |
|---|---|---|---|---|
| Gold | $4,008.65/oz | -$105.05 | -2.55% | Fell despite escalation; pressured by dollar strength, defying safe-haven pattern |
| Silver | $57.985/oz | -$2.180 | -3.62% | Tracked gold lower on dollar strength |
| Copper | $6.2758/lb | -$0.0062 | -0.10% | Roughly flat; industrial metals shrugged off the geopolitical headline |
| Platinum | $1,611.65/oz | -$17.35 | -1.07% | Followed the precious metals complex lower |
| Bitcoin | $62,152 | -$1,779 | -2.78% | Tracked the broader risk-off equity tape |
ENERGY
WTI surged 9.13% on the reinstated Hormuz blockade while Brent’s screen print showed no change, likely an artifact of Brent already gapping up over the weekend on Sunday’s CENTCOM strikes. Oil rising while equities fell is the stagflationary read — a supply shock, not a demand signal. Henry Hub eased 1.50% even as Dutch TTF jumped 5.45%, underscoring a European-specific gas risk premium the US market isn’t pricing.
| Asset | Price | Change | %Move | Why It Moved |
|---|---|---|---|---|
| Crude Oil (WTI) | $77.93/bbl | +$6.52 | +9.13% | Surged after Trump reinstated the Strait of Hormuz blockade on Iran; US strikes on Iranian targets over the weekend |
| Crude Oil (Brent) | $83.22/bbl | $0.00 | 0.00% | Flat print — likely already reflected the weekend’s escalation in Friday’s close |
| Natural Gas (Henry Hub) | $2.896/MMBtu | -$0.044 | -1.50% | Decoupled from crude; US gas market unaffected by Hormuz-specific disruption |
| Natural Gas (Dutch TTF) | $17.11/MMBtu | +$0.88 | +5.45% | European gas jumped on Middle East supply-route risk premium |
S&P 500 SECTORS
Energy’s 2.73% surge and 6.55% weekly gain mark a sharp reversal — the sector was the past month’s biggest laggard (-2.20%) before today’s supply shock snapped it back toward its YTD leadership (+26.20%). Technology, the 3- and 12-month leader, sat out today’s rally entirely (-2.39%), while Consumer Defensive and Utilities caught a modest defensive bid beneath the broader risk-off tape.
| Sector | 1-Day | 1-Week | 1-Month | 3-Month | 6-Month | YTD | 12-Month |
|---|---|---|---|---|---|---|---|
| Energy | +2.73% | +6.55% | -2.20% | -3.07% | +23.93% | +26.20% | +29.14% |
| Real Estate | +0.44% | +0.42% | +0.59% | +5.10% | +9.09% | +10.31% | +8.14% |
| Consumer Defensive | +0.40% | +0.31% | -1.29% | -0.05% | +6.82% | +7.46% | +5.45% |
| Utilities | +0.30% | +0.72% | +3.84% | -4.10% | +7.61% | +6.86% | +13.48% |
| Financial | +0.20% | -0.44% | +7.79% | +10.61% | +3.39% | +5.53% | +13.32% |
| Healthcare | -0.20% | -1.24% | +6.74% | +8.75% | +2.18% | +4.94% | +18.89% |
| Consumer Cyclical | -0.74% | -0.94% | +2.95% | +2.26% | -7.32% | -4.11% | +3.37% |
| Basic Materials | -1.08% | -3.40% | -0.98% | -10.04% | +0.68% | +6.65% | +26.68% |
| Communication Services | -1.09% | -1.43% | +0.64% | +5.38% | +2.34% | +3.89% | +33.36% |
| Industrials | -1.44% | -4.74% | +2.25% | +1.84% | +9.68% | +14.31% | +19.24% |
| Technology | -2.39% | -1.20% | +2.34% | +20.45% | +18.84% | +19.07% | +31.58% |
TOP MEGA-CAP MOVERS:
GAINERS
| Company | Ticker | Close | Change | Why It Moved |
|---|---|---|---|---|
| ExxonMobil Holdings Corp | XOM | $144.51 | +4.05% | Oil major rallied on WTI’s 9% surge following the Iran blockade news |
| Chevron Corp | CVX | $182.20 | +3.29% | Tracked crude higher on Hormuz blockade escalation |
| Palantir Technologies Inc | PLTR | $130.04 | +2.56% | Defense-tech beneficiary bid amid Iran conflict escalation; recent Army/Nvidia AI contract momentum |
| Visa Inc | V | $357.75 | +2.52% | Defensive mega-cap rotation amid the broader tech-led selloff |
| Mastercard Incorporated | MA | $537.70 | +2.08% | Tracked Visa higher in defensive payments rotation |
DECLINERS
| Company | Ticker | Close | Change | Why It Moved |
|---|---|---|---|---|
| Sandisk Corp | SNDK | $1,673.97 | -12.63% | NAND flash prices declining faster than expected; lowered revenue guidance on softer data-center demand |
| Oracle Corp | ORCL | $131.54 | -6.47% | AI-capex credit stress deepens — S&P Global flagged a $42B FY2027 FCF deficit and OpenAI revenue-concentration risk; fresh 52-week low |
| Intel Corp | INTC | $103.12 | -6.12% | Tracked sector-wide chip weakness alongside SK Hynix’s 15% slide in South Korea |
| Lam Research Corp | LRCX | $329.92 | -5.83% | Semiconductor equipment names hit hardest in the tech-led decline |
| Applied Materials Inc | AMAT | $575.39 | -4.50% | Chip equipment sector pressured by the broad tech selloff and NAND pricing concerns |
— Institutional-grade intelligence for serious investors. Apply for membership at join.recessionalert.comC. HIGH-IMPACT STORIES -> TOP
BEARISH
1. Trump Reinstates Strait of Hormuz Blockade on Iran, Oil Surges 9% as Equities Sell Off Broadly
The core facts:President Trump announced Sunday night that the US is reinstating a naval blockade on Iranian shipping through the Strait of Hormuz, with CENTCOM confirming enforcement begins Tuesday, July 14 at 4:00pm ET. The move follows a weekend escalation: Iran fired on a commercial vessel transiting the Strait Saturday and declared the waterway closed; the US retaliated with strikes on multiple Iranian targets overnight, and Iran counter-struck US-linked facilities in Jordan, Qatar, Kuwait, and Oman Sunday. Under the new policy, Iranian vessels are barred outright while other nations will pay a 20% toll on cargo transiting the strait, with Trump declaring the US the “Guardian of the Hormuz Strait.” WTI crude surged 9.13% to $77.93/bbl while Brent held flat at $83.22 (already reflecting Friday’s pricing). The S&P 500 fell 0.79% to 7,515.84, the Nasdaq 100 dropped 1.88% to 29,264.10, and the VIX jumped 14.11% to 17.15. Energy was the only S&P sector to advance (+2.73%), lifting ExxonMobil (+4.05%) and Chevron (+3.29%), while Technology led decliners (-2.39%).
Why it matters:A reinstated blockade with an explicit toll structure is a materially different posture than prior sanctions-based pressure — it inserts the US Navy directly into contested shipping lanes and creates an open-ended flashpoint for further escalation. The 9% oil spike alongside a 14% VIX jump signals markets are pricing real supply-disruption risk, not just headline noise, and the broad equity selloff led by Technology shows the risk-off impulse is overwhelming the AI-infrastructure rally that dominated last week’s gains. The energy-only sector advance highlights how narrowly concentrated the “winners” are in this scenario.
What to watch:Enforcement of the blockade beginning Tuesday, July 14 at 4:00pm ET, and any Iranian response to the toll regime or further attacks on shipping and regional US assets.
BEARISH
2. Oracle Falls to Fresh 52-Week Low as S&P Downgrade Deepens AI-Capex Credit Stress
The core facts:Oracle shares fell 6.47% to a fresh 52-week low of $132.27, extending the stock’s decline to 28% over the past month. The move followed S&P Global’s downgrade of Oracle’s credit rating to BBB-, one notch above junk, on concerns over extreme customer concentration — OpenAI accounts for roughly half of Oracle’s $638 billion remaining performance-obligations backlog — and a projected free cash flow deficit of negative $42 billion in fiscal 2027. Oracle’s FY2026 free cash flow came in at negative $23.69 billion against $55.66 billion of capital expenditure, with total liabilities swelling to $218.7 billion.
Why it matters:A credit-rating downgrade one notch above junk for a company this large is a genuine stress signal on the AI-capex buildout, not routine volatility — it echoes the same concentration and cash-burn concerns already flagged in SpaceX’s bond spreads in recent sessions. Because Oracle’s backlog is so heavily dependent on a single customer whose own competitive standing versus Anthropic has reportedly weakened, the market is questioning whether Oracle’s committed AI infrastructure spending can be sustained without further credit deterioration — a read-through for financing conditions across the broader AI-infrastructure supply chain.
What to watch:Any further rating action from Moody’s or Fitch, and Oracle’s next quarterly disclosure of OpenAI-related backlog and cash flow trends.
BEARISH
3. SK Hynix Suffers Record 15% Seoul Plunge on Profit-Miss Call, Triggers Kospi Trading Halt
The core facts:SK Hynix shares plunged 15.37% in Seoul — the largest single-day decline in the company’s history — triggering a 20-minute trading halt as the Kospi fell roughly 9% on the day. The collapse came one trading day after SK Hynix’s blockbuster Nasdaq debut Friday, when its ADRs (ticker SKHY) priced at $149 and popped 14% in a $26.5 billion listing. The trigger was a research note from Korea Investment & Securities forecasting SK Hynix’s Q2 operating profit will miss consensus (65 trillion won) by roughly 8%, citing HBM long-term contract pricing pressure. Foreign and institutional investors sold a combined 2.88 trillion won of stock, while SK Hynix’s US-listed ADRs fell roughly 8% in sympathy.
Why it matters:The reversal is a sharp reminder that Friday’s oversubscribed listing does not immunize the stock from fundamental scrutiny — a single brokerage profit-miss call was enough to erase much of the IPO euphoria and drag the broader Kospi into a trading halt. Because SK Hynix supplies 56-58% of the world’s HBM memory to Nvidia and other AI hyperscalers, a profit miss raises questions about near-term pricing power in the AI-memory supply chain just as the broader AI trade is already under pressure from the NAND-led selloff in the next story.
What to watch:SK Hynix’s actual Q2 earnings release for confirmation or denial of the profit-miss call, and whether the ADR (SKHY) stabilizes or extends its slide in Tuesday’s session.
BEARISH
4. SanDisk Guidance Cut Triggers Broad Semiconductor Selloff on NAND Oversupply Fears
The core facts:SanDisk fell 12.63% to $1,673.97 after management cut revenue guidance, citing faster-than-expected NAND flash price declines and softening data-center demand. The move led a broader semiconductor selloff: Intel fell 6.12% to $103.12, Lam Research fell 5.83% to $329.92, and Applied Materials fell 4.50% to $575.39. The Roundhill Memory ETF (DRAM) fell roughly 9%, with Western Digital and Micron also down sharply. The selloff coincided with SK Hynix’s historic Seoul decline (previous story) and compounded broader concern that global NAND manufacturing is approaching full utilization — a level that has historically preceded an oversupply cycle and aggressive price compression.
Why it matters:The breadth of the decline across NAND, DRAM, and semiconductor-equipment names shows this is a sector-wide repricing of AI-memory demand assumptions, not an isolated company miss. Combined with SK Hynix’s collapse, it signals the market is actively questioning whether memory pricing can support the capex assumptions embedded in hyperscaler AI spending plans — directly relevant to the same capex-durability debate raised by Oracle’s credit downgrade.
What to watch:Micron’s next quarterly report for confirmation of NAND/DRAM pricing trends, and whether the selloff broadens to semiconductor-equipment names beyond Lam Research and Applied Materials.
UNCERTAIN
5. Fed’s Waller Puts Rate Hike Back on the Table, Treasury Yields Jump Ahead of Tuesday’s CPI
The core facts:Fed Governor Christopher Waller said Monday the FOMC may need to “consider tightening monetary policy in the near term” if this week’s core inflation data comes in hot, warning against the Fed “fighting the last war” on inflation. Waller said the balance of risks has tilted “more toward high inflation than labor market weakness” — a reversal from the Fed’s posture a year ago. The comments pushed the 2-year Treasury yield to a multi-year high of 4.286% (+7.8 bps) and the 10-year to 4.626% (+5.7 bps); the Nasdaq extended losses to session lows following the remarks, and July hike odds rose to 43.3%.
Why it matters:A sitting Fed governor putting a rate hike explicitly back on the table — contingent on Tuesday’s CPI — raises the stakes materially for that print and for new Chair Warsh’s testimony to Congress later this week. Combined with today’s Iran-driven oil spike, the hawkish repricing compounds the risk that inflation expectations become entangled with a supply-side energy shock, a combination the Fed has historically found difficult to address with a single policy tool.
What to watch:Tuesday’s core CPI print, and Chair Warsh’s House Financial Services Committee testimony Tuesday and Senate Banking testimony Wednesday for confirmation of whether the hawkish tone broadens beyond Waller.
— Quantifying recession risk so you don’t have to guess. Apply for membership at join.recessionalert.comD. MODERATE-IMPACT STORIES -> TOP
UNCERTAIN
6. Gold Decouples From Safe-Haven Pattern as Dollar Strength Overrides Iran Risk
The core facts:Gold fell 2.55% to $4,008.65/oz even as the Iran conflict escalated over the weekend, defying its traditional safe-haven role. Silver fell 3.62% and platinum fell 1.07%. The decline tracked a firming US Dollar Index (+0.32% to 101.24) and rising Treasury yields, with markets reasoning that oil-driven inflation expectations reinforce a higher-for-longer Fed rather than triggering pure flight-to-safety demand. Gold has now fallen more than 20% since the Iran conflict began escalating in late February.
Why it matters:Gold’s failure to catch a safe-haven bid during an active military escalation is a notable divergence — it suggests markets are currently weighting “higher rates for longer” more heavily than geopolitical tail risk in pricing the metal, consistent with today’s Waller-driven yield spike. A continuation of this pattern would mark a shift in how gold trades relative to geopolitical shocks going forward.
What to watch:Whether gold’s correlation with the dollar and real yields continues to override safe-haven demand if the Iran conflict escalates further.
BULLISH
7. Citi Raises Apple Price Target to $365, Citing Resilient Market-Share Gains Ahead of Earnings
The core facts:Citi raised its price target on Apple to $365 from $315 ahead of the company’s July 30 earnings report, maintaining its Buy rating. Analyst Asiya Merchant cited Apple’s continued market-share gains in a slowing device market, aided by selective pricing power and strong positioning in the mid-range smartphone segment via promotions and subsidies. The new target implies roughly 16% upside from Friday’s close.
Why it matters:A meaningful target increase from a major bank just ahead of earnings signals growing Street confidence that Apple’s share gains can offset broader smartphone-market softness — a relevant data point for how the market is discriminating between AI-infrastructure-exposed names (under pressure today) and traditional mega-cap hardware names seen as more insulated.
What to watch:Apple’s July 30 earnings report for confirmation of market-share trends and margin resilience from pricing actions.
BULLISH
8. JPMorgan Upgrades American Express, Citing Affluent-Customer Insulation From Iran-War Fallout
The core facts:JPMorgan upgraded American Express to Overweight from Neutral, raising its price target to $400 from $328 — implying roughly 14% upside. Analyst Richard Shane argued Amex’s valuation premium is warranted given the defensive nature of its revenue, noting the company’s affluent customer base is “relatively shielded” from the disproportionate impact an Iran-driven energy price spike would have on lower- and middle-income consumers.
Why it matters:The upgrade is a direct read on how a major bank is positioning credit-card exposure against today’s geopolitical and energy backdrop — rewarding names with defensive, high-income customer bases while broader risk sentiment sours. It’s a useful signal for how the market is differentiating consumer-discretionary exposure amid an active oil shock.
What to watch:Whether other analysts follow with similar affluent-consumer-resilience arguments across the payments and card-issuer space.
UNCERTAIN
9. OPEC Cuts 2026 Oil Demand Growth Forecast to 780,000 B/D, Third Straight Downward Revision
The core facts:OPEC’s July Monthly Oil Market Report lowered its 2026 global oil demand growth forecast to 780,000 barrels per day, from 970,000 b/d previously — the third consecutive downward revision — citing weaker consumption in advanced economies and moderating demand in China (-110,000 b/d) and India (-60,000 b/d). For 2027, OPEC raised its demand growth forecast slightly to 1.94 million b/d. The report lands the same day as the Strait of Hormuz blockade announcement, creating a split narrative between near-term supply-driven price spikes and medium-term demand deceleration.
Why it matters:The divergence between today’s supply-shock-driven price spike and OPEC’s structurally weaker demand outlook is an important tension for portfolio managers to track — it suggests today’s oil rally may be more of a geopolitical risk premium than a durable repricing of fundamentals, with downside risk if the Hormuz situation de-escalates.
What to watch:OPEC’s August Monthly Report for confirmation of the demand-growth trajectory, and whether the Hormuz blockade materially disrupts realized shipping volumes.
BEARISH
10. AppLovin Tumbles 11% to Lead S&P Decliners as Ad-Growth Slowdown Data and Insider Selling Compound Broad Risk-Off
The core facts:AppLovin shares fell roughly 11% to lead S&P 500 decliners, with no single confirmed catalyst but several compounding factors: a Bank of America tracking analysis showed slower e-commerce advertising growth in June (roughly 750 new ad “pixels” added versus 950 in May); continued investor scrutiny of the late-June global rollout of its AXON ad-targeting engine, which shifted from a referral-only model to an open self-serve system that some worry could dilute ad-ecosystem quality; and SEC filings showing CEO Adam Foroughi sold approximately $51 million of shares in June. The decline also tracked the broader AI/semiconductor risk-off tape, with Nvidia, Broadcom, and AMD all lower.
Why it matters:The combination of slowing growth-rate data, unproven platform-transition risk, and insider selling is pressuring a stock that trades at an elevated valuation — a pattern where a high-multiple name gets marked down on several soft signals simultaneously rather than one clear trigger, similar to other premium-multiple names under pressure this earnings season.
What to watch:AppLovin’s next quarterly report for AXON rollout metrics and e-commerce advertiser trends, and whether insider selling continues.
— Separating signal from noise since 2007. Apply for membership at join.recessionalert.comE. ECONOMY WATCH -> TOP
Monday’s data underscored a widening gap between monetary and fiscal policy: Fed Governor Waller warned a rate hike is back on the table if Tuesday’s CPI print stays hot, even as Treasury’s own books show the government still borrowing at a roughly $2 trillion annual pace despite a narrower-than-expected June deficit. Waller’s remarks, a further hawkish tilt under new Chair Warsh, pushed July hike odds to 43.3% just as tariff-driven customs revenue and falling corporate tax receipts reshape federal cash flows. The takeaway for a PM: a Fed leaning toward tightening while fiscal policy keeps adding stimulus regardless of the cycle. Tuesday’s CPI is now the swing factor for both threads.
Fed’s Waller warns rate hike may be needed if core inflation stays hot (Federal Reserve / Bloomberg, July 13, 2026)
What they’re saying:In a speech on the economic outlook, Fed Governor Christopher Waller said the FOMC will need to consider tightening policy in the near term if another hot core inflation reading arrives this week. He noted core inflation has climbed steadily from 3% in December 2025 to 3.4% in May, pointing to AI-driven demand as a contributor to the stickiness. Futures markets now price 43.3% odds of a quarter-point hike at the July 29 FOMC meeting.
The context:The remarks mark a further hawkish tilt from a governor previously associated with the Fed’s easing wing, reinforcing new Chair Kevin Warsh’s more inflation-focused posture since June’s FOMC meeting removed its rate-cut bias. Waller tempered the warning by cautioning against “fighting the last war,” noting a resilient labor market gives the Fed room to wait for more data before acting.
What to watch:June CPI, due Tuesday, July 14 — a hot print would sharply raise the odds of the July 29 hike Waller flagged.
June budget deficit narrows but FY2026 borrowing pace still worsening (U.S. Treasury / CRFB, July 13, 2026)
What they’re saying:Treasury’s June Monthly Treasury Statement showed a $120 billion deficit for the month, narrower than the $132.8 billion consensus estimate and well below the prior month’s pace. Still, the cumulative FY2026 deficit reached $1.4 trillion through nine months — $35 billion wider than the same period last fiscal year, per CRFB’s analysis of the Treasury data.
The context:Higher tariff-driven customs revenue (+$55 billion, or 51%) and payroll tax receipts partially offset a 24% drop in corporate income tax collections and continued growth in mandatory spending (Social Security, Medicare, and Medicaid outlays up $169 billion, or 7%). CBO projects a $1.9 trillion FY2026 deficit (5.8% of GDP), and CRFB warns the government is on pace to borrow $2 trillion or more this fiscal year — a trajectory it calls “unsustainable,” with major trust funds now projected to face insolvency within seven years.
What to watch:The August Monthly Treasury Statement and ongoing FY2027 appropriations negotiations, given Congress has not yet funded the government for the upcoming fiscal year.
— Know the probability before the market prices in the risk. Apply for membership at join.recessionalert.comF. EARNINGS WATCH -> TOP
YESTERDAY AFTER THE BELL (Markets Reacted Today)
No major earnings yesterday after the bell from companies with >$100B market cap.
TODAY BEFORE THE BELL (Markets Already Reacted)
No major earnings before the bell from companies with >$100B market cap.
TODAY AFTER THE BELL (Markets React Tomorrow)
No major earnings after the bell from companies with >$100B market cap.
WEEK AHEAD PREVIEW:
Q2 2026 earnings season begins in earnest Tuesday, July 14, with five of the largest US banks reporting before the bell — the first real test of how Iran-war volatility and the SpaceX IPO flowed through to trading and investment-banking revenue.
JPMorgan Chase (JPM) — BMO, Tue Jul 14 — Consensus EPS +11.3% y/y; options market pricing a 4.4% move. Focus: net interest margin trends and whether trading/IB revenue (sector-wide seen +26% y/y on IB, +14% on trading) confirms the SpaceX-IPO and Iran-volatility tailwind.
Bank of America (BAC) — BMO, Tue Jul 14 — Consensus EPS $1.12 on $30.7B revenue, +25% y/y; options pricing a 4.5% move. Focus: consumer-banking net interest margin and deposit costs.
Goldman Sachs (GS) — BMO, Tue Jul 14 — Options market pricing the largest expected move of the group at 6.0%. Focus: trading and investment-banking revenue given elevated Iran-war-driven volatility and the SpaceX IPO’s advisory fees.
Wells Fargo (WFC) — BMO, Tue Jul 14 — Consensus EPS +12.3% y/y on +4.7% revenue growth; estimates trimmed roughly 1% over the past month. Focus: net interest margin pressure as the bank pivots toward balance-sheet expansion.
Citigroup (C) — BMO, Tue Jul 14 — Consensus EPS +38.8% y/y, the fastest growth of the group; estimates have moved modestly higher over the past three months. Focus: markets-division revenue and continued progress on the multi-year restructuring plan.
Morgan Stanley (MS) — BMO, Wed Jul 15 — Rounds out big-bank earnings week one day after its five peers; watch for confirmation of the same trading/IB revenue tailwind from Iran-war volatility and the SpaceX IPO.
Beyond these six banks, no additional >$100B US-domiciled reporters are confirmed for the remainder of the week.
— US market commentary trusted by family offices and institutions. Apply for membership at join.recessionalert.comG. WHAT’S NEXT -> TOP
UPCOMING RELEASES:
| Date | Event | Why It Matters |
|---|---|---|
| Tue, Jul 14 | June CPI Report (Core MoM +0.2%e / YoY +2.9%e; Headline MoM -0.1%e / YoY +3.8%e) | Directly tests Waller’s hawkish warning; a hot print could sharply raise July 29 hike odds beyond today’s 43.3% |
| Tue, Jul 14 | Fed Chair Warsh Testimony (House Financial Services Committee) | First public test of Warsh’s inflation-focused posture following Waller’s hawkish remarks and same-day CPI print |
| Tue, Jul 14 | Fed Speeches: Barr, Goolsbee, Cook, Bowman | Multiple Fed voices react to the CPI print same-day; watch for consistency with Waller’s hawkish tilt |
| Wed, Jul 15 | June PPI Report (Headline MoM -0.1%e / YoY 6.2%e; Core MoM 0.3%e / YoY 5.2%e) | Confirms or complicates Tuesday’s CPI read on pipeline price pressure ahead of the July 29 FOMC meeting |
| Wed, Jul 15 | Fed Chair Warsh Testimony (Senate Banking Committee) | Second day of testimony; watch for any tone shift after Tuesday’s CPI market reaction |
| Wed, Jul 15 | Fed Beige Book | Qualitative read on regional economic conditions heading into the July 29 FOMC decision |
| Wed, Jul 15 | NY Empire State Manufacturing Index (expected 8.9) | First manufacturing sentiment read of the week; watch for spillover from the Iran-driven energy shock |
| Wed, Jul 15 | Fed Speeches: Williams, Cook, Musalem | Additional Fed commentary following two days of inflation data and Warsh’s testimony |
KEY QUESTIONS:
1. Does Tuesday’s CPI print validate Waller’s hawkish tilt enough to push July 29 hike odds meaningfully above 43.3%, or does a benign core reading defuse the rate-hike threat?
2. Does the Strait of Hormuz blockade actually disrupt shipping volumes once enforcement begins Tuesday, or does WTI’s 9% spike prove to be a fading geopolitical risk premium against OPEC’s weaker 2026 demand outlook?
3. Does the AI-capex credit stress spreading from Oracle’s downgrade to the SK Hynix/SanDisk NAND selloff mark the start of a broader AI-infrastructure financing repricing, or a contained memory-market correction?
H. CHART OF THE DAY -> TOP
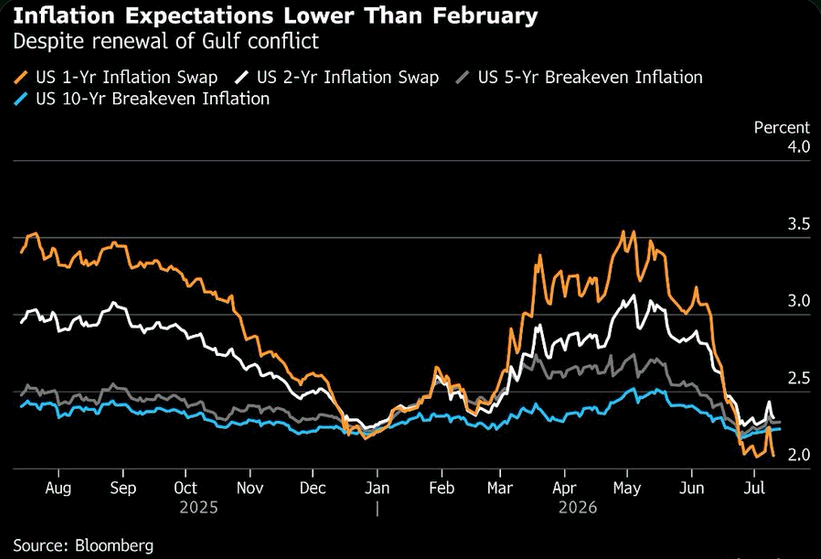
Front-end inflation swaps run on oil, so a fresh Gulf war should have torched the 1-year first — instead it fell furthest and fastest. That is the whole story. The series that led the entire complex higher has re-inverted to the bottom of the stack: the US 1-Yr swap, top of the curve at roughly 3.5% in May, has round-tripped the spring reflation scare down to about 2.0% — printing beneath even the 10-Yr breakeven near 2.15%, which never left its ~2.1–2.4% band. Read that literally: the market now prices less inflation over the next year than over the next decade, straight through a live oil-shock catalyst. The mechanics explain the shape. The front end carries the market’s oil beta; the long end reflects the Fed’s anchor. A conflict only reprices inflation if it actually removes barrels — and the market judges this one contained, no sustained outage, spare capacity absorbing it. Stack demand-side softness on top and pass-through dies at the pump. Households, anchored to gasoline, still brace for higher prices; the traded market disagrees, and the traded market clears. An inverted expectations curve hands the Fed cover to cut — but it is also how a growth scare announces itself. Those two look identical until one of them arrives.
Market Intelligence Brief (MIB) Ver. 18.42
For professional investors only. Not investment advice.
© 2026 RecessionALERT.com

Comments are closed.