
MIB WEEKLY DIGEST
Week of May 26–29, 2026
Dell Technologies’ AI server blowout (+32.8%, $51.3B backlog, FY27 guide raised $27B above consensus) drove the Dow above 51,000 for the first time and confirmed the AI infrastructure super-cycle as structurally contracted demand — not narrative. Iran’s Hormuz ceasefire progression sent WTI down 9% for the week and oil to its largest monthly loss in six years, with Trump’s “final determination” still undecided at Friday’s close. Against both bull catalysts, stagflation-lite fundamentals accumulated: Q1 GDP revised to 1.6%, corporate profits ‑0.4% QoQ, PCE confirmed at 3.8%, and four Fed officials — culminating in Bowman’s hawkish pivot — escalated June FOMC rate-hike risk from noise to genuine debate. The S&P’s ninth consecutive weekly gain priced all three bull-case assumptions simultaneously.
TABLE OF CONTENTS
A. WEEK AT A GLANCE
B. WEEK IN MARKETS
C. WEEK’S TOP STORIES (10)
D. WEEK IN THE ECONOMY (5)
E. WEEK IN EARNINGS (3)
F. NEXT WEEK SETUP
G. CHART OF THE WEEK
A. WEEK AT A GLANCE -> TOP
The S&P 500 extended its winning streak to nine consecutive weekly gains and the Dow crossed 51,000 for the first time — yet both milestones rest on a structurally narrow foundation. Technology led all 11 sectors with a 5.27% weekly gain while 8 of 11 sectors declined on Friday alone, and the NYSE Composite’s +0.29% WoW against the Nasdaq’s +2.89% quantifies the AI concentration story: the broad exchange barely moved while growth indices hit records. Beneath the record tape, the week produced an explicit stagflation-lite configuration — Q1 GDP revised to 1.6%, corporate profits down ‑0.4% QoQ, PCE confirmed at 3.8%, four Fed officials escalating hike risk — while simultaneously delivering AI infrastructure earnings so large they systematically reset analyst models for the entire sector. The market ended the week pricing three bull-case assumptions simultaneously: an Iran deal driving oil deflation, AI-driven Q2 earnings recovery, and a Fed on hold. All three remain live and unverified entering the weekend.
• Dow above 51,000 for the first time; S&P ninth consecutive weekly gain: DELL +32.8% on Friday drove the largest single-session mega-cap gain of 2026; IBM +12.71% on $10B quantum commitment added a second catalyst; S&P +1.43% WoW, NDX +2.89% WoW.
• WTI ‑9.35% WoW, Brent ‑11.83% WoW — Iran ceasefire arc ran all four sessions: US airstrikes (Tue) → fake framework crash ‑4.69% (Wed) → 60-day MOU (Thu) → Trump Situation Room undecided (Fri); oil posted its largest monthly loss in six years with the deal still unconfirmed at week’s close.
• MU +27.41% WoW on three bank upgrades in four sessions: UBS (×3 PT to $1,625), Barclays (+74% to $1,175), Susquehanna ($1,750); HBM4 sold out through 2026; Nasdaq crossed 30,000 for the first time on Tuesday.
• Thursday’s data barrage: Q1 GDP 1.6%, corporate profits ‑0.4% QoQ, PCE 3.8%, income flat: Worst corporate profit miss in six quarters; real per-capita DPI ‑1.4% YoY; GDPNow trimmed to 3.8%; markets priced the mild core PCE undershoot (+0.2% vs +0.3%) as the dominant takeaway.
• Fed hawkish arc all four sessions — Bowman pivot the defining move: Waller (last Fri baseline) → Cook “prepared to hike” (Wed) → Williams patient (Thu) → Bowman hawkish pivot + Schmid QT proposal (Fri); June FOMC shifted from consensus hold to genuine debate; hike odds ‑11pp WoW to ~32% on core PCE undershoot.
• Chicago PMI 62.7 — 37-month high, demolished consensus by 12 points (Fri): Largest single-month increase since 2020; national ISM Manufacturing on Monday June 1 is the immediate confirmation test; trade balance beat ‑$82.4B on record oil exports.
1. AI Infrastructure Super-Cycle Achieves Institutional Legitimacy — Dell’s $51.3B backlog spanning 5,000+ enterprise customers, Marvell’s $11.5B FY27 AI guide, Micron’s three-upgrade week, and Snowflake’s record sequential growth collectively confirm that AI demand is structural, contracted, and multi-layer — reaching hardware, memory, custom silicon, and data infrastructure simultaneously. Analyst models for every AI-adjacent peer were proven systematically too conservative; a revision wave into Q2 reporting is likely.
2. Triple-Assumption Pricing Elevates Correction Risk — Friday’s record S&P close simultaneously priced an Iran deal, Chicago PMI growth acceleration, and no June rate hike — all three unconfirmed. Q1 corporate profits down ‑0.4% QoQ at all-time equity highs, four hawkish Fed voices, and a consumer sector bleeding across every data point provide the fundamental counterweight the tape has not yet absorbed. After nine consecutive weekly gains without a corrective session, any single leg of the bull-case triad failing — Iran deal collapses, ISM disappoints, Bowman-Schmid language hardens into committee guidance — creates meaningful downside risk at current multiples.
3. Stagflation-Lite Narrows the Fed’s Options While Iran Runs in the Opposite Direction — Q1 GDP 1.6%, PCE 3.8%, income flat, and housing in structural decline describe the classic stagflation configuration where the Fed can neither cut (inflation too high) nor easily hike (growth too weak). The Iran energy channel runs counter: WTI at $80/bbl post-deal would remove 60–80 bps from 2026 PCE and give the Fed the disinflation cover it needs to stay patient. The policy outcome at June FOMC is thus directly conditional on the deal outcome — making the next week the highest-stakes window for portfolio positioning since the conflict began.
 — Leading economic indicators. Accurate market forecasts. Apply for membership at join.recessionalert.com
B. WEEK IN MARKETS -> TOP
The holiday-shortened week ran one dominant story through four sessions: AI infrastructure is a structural, contracted demand cycle, not a narrative. Dell’s record $43.8B quarter with AI server revenue up 757% validated enterprise breadth (5,000+ customers), Micron’s +27% weekly surge followed consecutive Street-high price target upgrades confirming HBM4 memory sold out through 2026, and Snowflake’s +34% earnings blowout confirmed the cycle has reached the software and data pipeline layer. Against this, a stagflation-lite cross-current ran simultaneously: Q1 GDP revised to 1.6%, corporate profits fell ‑0.4% QoQ, PCE held at 3.8%, and four Fed officials escalated June FOMC rate-hike risk from background noise to genuine debate — Bowman’s hawkish pivot on Friday was the most significant individual committee shift of the week. Oil’s 9% weekly decline (Iran ceasefire progression pricing Hormuz normalization) provided inflation relief that partially offset the hawkish Fed signal, leaving equity markets simultaneously pricing all three bull-case assumptions at record closes.
FRIDAY CLOSE & WEEK-ON-WEEK CHANGE — Fri, May 29, 2026:
MAJOR INDICES
Dow Theory’s directional signal fired differently this week: DJTA +3.09% outpaced DJIA +0.90% by 2.19pp — just above the 2% same-week divergence threshold — transports pulling ahead of industrials on WTI ‑9% fuel relief, not traditional industrial-led confirmation. The bull signal is intact but the driver is energy deflation, not growth demand. NDX +2.89% vs NYSE Composite +0.29% is the breadth tell: the broad exchange barely moved while growth indices hit records — AI hardware concentration carried cap-weighted indices while equal-weight breadth stalled. RUT +1.82% tracking NDX at roughly two-thirds the rate confirms narrow leadership without full small-cap participation.
| Index | Fri Close | WoW Change | WoW % | Why It Moved (Week) |
|---|---|---|---|---|
| S&P 500 | 7,580.08 | +106.63 | +1.43% | AI infrastructure wave (DELL +32.8%, MU +27% week, ORCL +19%) drove cap-weighted gain; ninth consecutive weekly close and six consecutive record daily closes by week-end. |
| Dow Jones | 51,032.65 | +452.95 | +0.90% | First-ever 51,000 close driven by DELL’s record AI quarter and IBM quantum commitment on Friday; mid-week Iran oil crash lifted consumer/transport names (Dow hit 50,670 Wednesday). |
| DJ Transportation | 21,410.4 | +643.0 | +3.09% | Week’s largest index gain: WTI ‑9% on Iran ceasefire progression delivered direct fuel savings to airlines, truckers, and logistics names; transport-vs-industrial Dow Theory outperformance is energy deflation, not growth acceleration. |
| Nasdaq 100 | 30,333.18 | +851.54 | +2.89% | AI semiconductor re-rating (MU +27% week, SOX +5% Tuesday on UBS upgrade) and DELL AI blowout on Friday; enterprise software beats (SNOW +34%, MRVL beat+raised) added breadth; first-ever 30,000 close on Tuesday. |
| Russell 2000 | 2,920.93 | +52.15 | +1.82% | Domestic small-caps rode Iran de-escalation optimism and risk-on sentiment through the week; AI infrastructure enthusiasm lifted broad sentiment even as mega-cap leadership was narrow. |
| NYSE Composite | 23,292.17 | +66.42 | +0.29% | Minimal weekly gain as energy sector (‑5.08% week) dragged on the broad composite; the 0.29% WoW vs. NDX +2.89% WoW is the clearest single stat for the week’s concentration story. |
VOLATILITY & TREASURIES
Both yields fell more at the short end (2Y ‑12.1 bps vs 10Y ‑11.5 bps), producing a marginal steepening — the market’s subtle hint that near-term rate optionality improved slightly on core PCE +0.2% MoM (below the +0.3% consensus). The curve steepening is modest; four consecutive hawkish Fed speeches kept rate expectations anchored. VIX ‑8.26% WoW reflects Iran de-escalation and AI earnings euphoria. The defining divergence: 10Y yields down 11.5 bps while gold rose +1.89% — real rate compression on inflation hedge demand, not a growth-optimism bid.
| Instrument | Fri Level | WoW Change | Why It Moved (Week) |
|---|---|---|---|
| VIX | 15.32 | ‑1.38 (‑8.26%) | Iran ceasefire progression and AI earnings euphoria reduced hedging demand all week; VIX rose intraday Tuesday on IRGC airstrike news before receding as the MOU extended and DELL blowout dominated Friday sentiment. |
| 10-Year Treasury Yield | 4.436% | ‑11.5 bps | Core PCE +0.2% MoM (slight undershoot vs +0.3% expected) and Iran crude relief reduced long-run inflation expectations; four hawkish Fed speeches capped the yield decline, limiting bond market enthusiasm for the equity rally. |
| 2-Year Treasury Yield | 4.002% | ‑12.1 bps | Short end fell slightly more than long end — curve steepening; marginal near-term rate-cut optionality priced on the core PCE undershoot, despite Cook (prepared to hike), Bowman (pivot), and Schmid (QT) all signaling tightening risk. |
| US Dollar Index (DXY) | 98.92 | ‑0.38 (‑0.38%) | Mild dollar softness on geopolitical relief (Iran ceasefire reducing safe-haven demand) and marginal yield decline; not a growth-driven dollar weakness — the character is geopolitical unwind rather than risk-on rotation. |
COMMODITIES
Gold +1.89% and copper +0.53% rose together, but the character differs: gold’s gain carried throughout the week on dual inflation-hedge and geopolitical-uncertainty demand (persistent 3.8% PCE + unresolved Iran), while copper’s modest gain arrived primarily Friday on the Chicago PMI 62.7 surge. Precious metals led industrial metals for most of the week — the classic stagflation-hedge divergence. Bitcoin ‑3.30% declined as institutional flows rotated into AI hardware equities; the AI trade absorbed the marginal dollar that might otherwise have found crypto.
| Asset | Fri Price | WoW Change | WoW % | Why It Moved (Week) |
|---|---|---|---|---|
| Gold | $4,593.00/oz | +$85.25 | +1.89% | Dual bid sustained all week: PCE confirmed at 3.8% (inflation hedge) + Iran resolution unconfirmed as of Friday close (geopolitical premium). Gold rising alongside equities flags the market is hedging inflation persistence, not just risk-off. |
| Silver | $76.173/oz | +$0.345 | +0.45% | Modest gain tracking gold’s safe-haven bid; industrial demand component muted relative to gold’s 1.89% move — silver’s underperformance vs gold confirms precious-metals-specific rather than industrial-demand driver. |
| Copper | $6.4195/lb | +$0.034 | +0.53% | Late-week lift from Chicago PMI 62.7 manufacturing surge; China demand background supportive; underperformed gold for most of the week, with the gap closing only Friday on growth data confirmation. |
| Platinum | $1,929.50/oz | ‑$2.70 | ‑0.14% | Near-flat; automotive demand uncertainty persisted as Iran energy narrative crowded out industrial metals catalysts; lagged both gold and copper on both precious and industrial demand dimensions. |
| Bitcoin | $73,452 | ‑$2,510 | ‑3.30% | Declined as institutional flows rotated into AI hardware equities; tracked risk sentiment (declining with small caps, not with AI mega-caps); no independent catalyst — risk-proxy behavior confirmed across the full week. |
ENERGY
WTI ‑9.35% and Brent ‑11.83% WoW were the week’s defining commodity story — Iran ceasefire progression (US airstrikes → fake framework → 60-day MOU → Trump Situation Room meeting) drove oil’s largest monthly loss in six years. Brent fell more than WTI because it carries the Hormuz/Middle East geopolitical premium, confirming this is supply-risk unwinding, not demand collapse. Henry Hub +12.75% is structurally independent: EIA storage undershoots plus summer cooling demand plus IEA’s $330B AI data center gas infrastructure forecast. The gas-rises/crude-falls split — US-specific tightening running against geopolitical crude easing — is the energy cross-asset signal that names what the week actually delivered.
| Asset | Fri Price | WoW Change | WoW % | Why It Moved (Week) |
|---|---|---|---|---|
| Crude Oil (WTI) | $87.36/bbl | ‑$9.01 | ‑9.35% | Iran ceasefire progression priced Hormuz supply normalization all week; WTI ‑4.69% on Wednesday alone when Iran state media reported a framework (later denied). North American crude fell less than Brent on geopolitical premium differential. |
| Crude Oil (Brent) | $91.12/bbl | ‑$12.23 | ‑11.83% | Larger WoW decline than WTI because Brent carries the Hormuz supply-risk premium; 60-day ceasefire MOU signed Thursday and energy sector de-rated ‑5.08% for the week pricing Iranian crude re-entry. |
| Natural Gas (Henry Hub) | $3.290/MMBtu | +$0.372 | +12.75% | Fully decoupled from crude: EIA Thursday storage build came in smaller than expected; summer cooling demand rising; IEA World Energy report flagged AI data center power demand driving $330B in gas infrastructure investment in 2026. |
| Natural Gas (Dutch TTF) | $15.72/MMBtu | ‑$0.83 | ‑5.02% | European gas followed crude lower on Hormuz reopening prospects reducing LNG substitution needs; diverged sharply from Henry Hub (down vs up), confirming the US storage tightening is a domestic supply-demand story, not a global LNG market signal. |
S&P 500 SECTORS — WEEKLY ROTATION
Technology +5.27% WoW is regime leadership in its purest form: dominant across all six horizons (1W, 1M, 3M, 6M, YTD, 12M) without a single negative reading. Consumer Defensive ‑3.23% WoW and ‑8.39% 3M qualifies as structural laggard deepening — the sector is not merely rotating out; it is being sold across every timeframe as capital concentrates into AI infrastructure plays. Single-name dominance check: DELL (+66.5% week) drove much of Technology’s single-week leadership — strip DELL and Technology’s 5.27% weekly gain compresses materially, though MU (+27%), ORCL (+19%), and IBM (+18%) confirm the move was broad within the AI supply chain rather than single-stock-driven.
| Sector | 1-Week | 1-Month | 3-Month | 6-Month | YTD | 12-Month |
|---|---|---|---|---|---|---|
| Technology | +5.27% | +15.14% | +29.33% | +27.32% | +25.38% | +54.24% |
| Basic Materials | +3.19% | +4.31% | ‑7.00% | +26.10% | +17.48% | +48.99% |
| Industrials | +2.26% | +3.22% | ‑0.09% | +17.92% | +15.11% | +27.74% |
| Consumer Cyclical | +1.37% | +3.09% | +3.80% | +2.09% | +0.29% | +11.07% |
| Healthcare | +0.82% | +4.48% | ‑5.40% | ‑3.99% | ‑2.21% | +16.11% |
| Financial | ‑0.37% | +0.97% | +1.03% | +2.39% | ‑2.42% | +10.43% |
| Communication Services | 0.00% | +3.67% | +8.04% | +6.64% | +7.04% | +35.34% |
| Real Estate | ‑0.87% | +0.80% | ‑0.13% | +5.15% | +7.69% | +7.46% |
| Utilities | ‑1.36% | ‑3.27% | ‑6.37% | +1.74% | +4.90% | +14.18% |
| Energy | ‑5.08% | ‑5.55% | +2.59% | +27.03% | +26.08% | +38.85% |
| Consumer Defensive | ‑3.23% | ‑1.61% | ‑8.39% | +5.79% | +5.68% | +2.54% |
TOP WEEKLY MOVERS:
DELL +66.50% and MU +27.41% topped the gainers table with structurally identical theses: contracted, multi-year AI hardware demand from hyperscalers, both with supply sold out through 2026–2028. Both are momentum continuations — DELL +234% YTD and MU +240% YTD — not reversals, and both sit in the Technology sector that led all 11 sectors across every horizon this week. On the loser side, XOM (‑6.46%), GEV (‑7.23%), and COST (‑8.96%) are each bleeding into structural multi-month downtrends visible in the sector rotation table: Energy (‑5.55% 1M), Consumer Defensive (‑8.39% 3M). The losers cluster confirms the week’s rotation: old-economy defensives and energy are funding the AI infrastructure concentration trade.
TOP 5 WEEKLY GAINERS
| Ticker | Week | YTD | Year | Why It Moved |
|---|---|---|---|---|
| DELL | +66.50% | +234.37% | +270.42% | Record Q1 FY2027 blowout — revenue $43.8B (+88% YoY), AI server revenue +757% to $16.1B, $24.4B orders, $51.3B backlog; EPS $4.86 vs $2.96 est. (+64% beat); FY27 guide raised to $167B / $60B AI servers; best single-session gain in stock history (+32.76% Friday). |
| MU | +27.41% | +240.21% | +903.10% | Three analyst upgrades in four sessions: UBS tripled PT to $1,625 (Tue, HBM4 sold out through 2026), Barclays +74% to $1,175 (Wed), Susquehanna raised to $1,750 (Fri) — collectively framing Micron as an AI-native infrastructure platform with NVIDIA-like earnings visibility through 2029. |
| APP | +26.18% | ‑9.01% | +59.56% | Meta unlikely to pursue non-IDFA iOS traffic (expanding AppLovin’s addressable market); upcoming AXON e-commerce platform launch in June; residual Q1 beat strength; broad AI advertising platform sentiment in a week dominated by AI infrastructure enthusiasm. |
| ORCL | +18.98% | +15.84% | +38.60% | JPMorgan initiated “Overweight” at $210 (Thu) calling Oracle a scaled AI “fourth hyperscaler” backed by a $30B US government cloud contract; Oppenheimer raised PT to $235 and Wedbush to $275; DELL AI capex read-through drove continuation on Friday (+10.84%). |
| IBM | +17.72% | +0.54% | +15.12% | $10B quantum computing commitment over five years announced Friday; $1B CHIPS Act grant for “Anderon” — first US quantum chip foundry; $5B open-source security investment with Red Hat; DELL sector read-through amplified the move (+12.71% Friday). |
TOP 5 WEEKLY DECLINERS
| Ticker | Week | YTD | Year | Why It Moved |
|---|---|---|---|---|
| COST | ‑8.96% | +10.90% | ‑5.20% | Q3 FY2026 (AMC May 28) — revenue beat but gross margin contracted 21 bps on higher transportation/energy costs; slight EPS miss ($4.93 vs ~$4.91); sell-on-earnings reaction at P/E ~49; management flagged further tariff-driven nonfood inflation ahead. |
| GEV | ‑7.23% | +48.16% | +105.51% | Bearish analyst report (May 28) challenged AI power demand valuation as disconnected from physical turbine manufacturing limits and grid interconnection timelines; insider selling added supply pressure; two consecutive days of profit-taking after +124% trailing-12-month run. |
| XOM | ‑6.46% | +20.71% | +41.45% | Iran ceasefire progression (airstrikes → MOU → Trump meeting) priced future Iranian crude re-entry (1–2 mbpd); integrated US oil majors de-rated as markets look through the current Brent premium to post-normalization supply economics. |
| PM | ‑5.88% | +10.59% | ‑0.28% | EU Commission formal “Call for Evidence” (Tuesday) targeting heated tobacco and nicotine pouch restrictions by Q4 2026 — threatens PM’s primary growth segment (iQOS/IQOS ILUMA); CFO succession effective August 1 adds execution risk during active regulatory response. |
| WMT | ‑4.61% | +3.90% | +19.21% | Consumer defensive rotation as AI-infrastructure flows dominated the week; Walton Family Trust sold 2.1M shares; escalating energy costs pressuring core low-income customers; analyst downgrade (Erste Group to Hold); C-suite shakeup follow-on and prior guidance miss overhang. |
— Institutional-grade intelligence for serious investors. Apply for membership at join.recessionalert.comC. WEEK’S TOP STORIES -> TOP
Three threads dominated the week. The first — Iran–Hormuz de-escalation (#1) — ran all four sessions and drove oil’s largest monthly loss in six years while leaving the actual deal unsigned entering the weekend. The second — the AI infrastructure super-cycle achieving institutional legitimacy — arrived in three waves: AI memory re-rated on analyst upgrades (#3), enterprise AI software/silicon confirmed through earnings (#5), and Dell’s record AI server quarter validating enterprise breadth on Friday (#2). The third thread — a stagflation-lite tightening risk — ran in counterpoint: four Fed officials escalated hike risk across the week (#4) against deteriorating macro fundamentals (#6) and deepening consumer stress (#8). All three threads are live and unresolved.
UNCERTAIN
1. Iran–Hormuz Arc: US Airstrikes → Ceasefire Breach → Fake Framework → 60-Day MOU → Trump Undecided — WTI ‑9% for the Week, Brent’s Biggest Monthly Loss in Six Years
The core facts:Tuesday (May 26): Overnight US airstrikes on IRGC mine-laying vessels near Bandar Abbas accused of ceasefire breach; Iran reserved the right to retaliate; Brent surged to near $99.50. Wednesday (May 27): Iranian state TV reported a draft Hormuz peace framework — the White House immediately called it a “complete fabrication”; WTI crashed ‑4.69% to $89.49 regardless. Thursday (May 28): US and Iranian negotiators signed a 60-day ceasefire MOU with a framework for gradual energy export restoration; WTI near-flat at $88.70. Friday (May 29): Trump convened a Situation Room “final determination” meeting that concluded without a decision; WTI fell another ‑1.73% to $87.36. For the week: WTI ‑9.35%, Brent ‑11.83%, May’s 17% monthly crude decline was the largest since 2020. The energy sector fell ‑5.08% for the week — pricing Iranian supply re-entry ahead of any formal Hormuz reopening.
Why it matters:The Iran arc is the week’s #1 story because it ran every session, touched every asset class, and remains unresolved entering the weekend — creating a binary gap-risk for Monday’s open. The market has fully front-run the deal: WTI at $87/bbl and the energy sector down 5% for the week both price Iranian crude re-entry before the MOU is signed or the Strait reopened. If Trump approves a deal, the oil decline may extend toward $80/bbl — delivering structural PCE relief that reduces the Fed’s hike urgency. If the deal collapses, the monthly crude decline reverses in days, Bowman and Schmid’s hawkish case is simultaneously validated, and the rate-hike risk reprices sharply. The Iran outcome is the single highest-impact binary event facing portfolios this weekend. (WTI ‑9% WoW — see Energy table in Section B; Energy sector ‑5.08% WoW — see sector rotation table in Section B.)
What to watch:Trump’s formal announcement — likely weekend or early next week — as the critical binary catalyst; Iran’s domestic political response to the nuclear and Hormuz conditions as the feasibility test; Monday oil futures open as the first real-time market verdict on any weekend announcement; Oman’s public posture as the designated ceasefire monitoring coordinator.
BULLISH
2. Dell AI Blowout + IBM Quantum: DELL +32.8%, Dow 51,000 — Enterprise AI Infrastructure Achieves Institutional Legitimacy; $51.3B Backlog Validates the Super-Cycle
The core facts:Thursday AMC: Dell reported Q1 FY2027 revenue $43.8B (+88% YoY), AI server revenue $16.1B (+757% YoY), $24.4B in AI orders, and a record $51.3B AI backlog. EPS $4.86 vs $2.96 consensus — a 64% beat at record scale. FY27 guide raised to $165–$169B revenue / $60B AI servers / $17.90 EPS (vs $13.09 consensus). Friday: DELL surged +32.8% — the largest single-session gain for any S&P 500 mega-cap in 2026 — lifting the Dow above 51,000 for the first time in history. Simultaneously, IBM announced a $10B quantum computing commitment over five years, a $1B CHIPS Act grant for “Anderon” (first US quantum chip foundry in Albany, NY), and a $5B open-source security investment — driving IBM +12.71% on Friday. Technology sector +5.27% for the week.
Why it matters:Dell’s $51.3B backlog spanning 5,000+ enterprise customers (neoclouds, sovereign governments, corporations) transforms the AI infrastructure thesis from hyperscaler-optionality to contracted structural demand — the same de-risking that HBM memory LTAs provided Micron. The 64% EPS beat at $43.8B scale means analyst models for every AI-adjacent peer are systematically too low; with FY27 guidance raised by $27B above prior consensus, the gap between what the street modeled and what AI infrastructure is actually delivering is widening. IBM’s quantum CHIPS Act win adds a second dimension: US government is expanding industrial policy from classical semiconductors into quantum — the same playbook that re-rated Oracle and drove the broader AI government infrastructure theme all week (PLTR +8%, ORCL +6.67% Thursday). (Technology +5.27% WoW — see sector rotation table in Section B.)
What to watch:PANW earnings June 2 for enterprise IT security spending corroboration; NVDA mid-August earnings for GPU shipment volume confirmation of the $51.3B Dell backlog; IBM Q2 for first Anderon commercialization signals; IonQ and Rigetti for quantum supply chain re-rating breadth.
BULLISH
3. AI Memory Re-Rating: Micron +27% Weekly on Three Analyst Upgrades, SOX +5%, Nasdaq First-Ever 30,000 Close — HBM4 Sold Out Through 2026
The core facts:Tuesday (May 26): UBS analyst Timothy Arcuri raised Micron’s price target from $535 to $1,625 — a 204% increase — citing HBM4 sold out through year-end 2026, multi-year LTAs with major hyperscalers, and projected $400B+ FCF through 2029. MU surged +19.29%, crossed $1 trillion market cap for the first time. SOX +5%, AMD +7.8%, KLAC +6.5%, SNDK +7.5%, MRVL +10% in sympathy. Nasdaq crossed 30,000 for the first time, with S&P hitting a record. Wednesday (May 27): Barclays raised its MU target 74% to $1,175, adding institutional weight to Tuesday’s re-rating. Friday (May 29): Susquehanna raised to $1,750 — three upgrades in four sessions from three separate banks. MU +27.41% for the week.
Why it matters:The three-upgrade sequence in a single week is the memory industry’s transition moment from cyclical-commodity valuation to contracted-infrastructure valuation. UBS’s framing — Micron as an “AI-native infrastructure platform” with Nvidia-like visibility through LTAs — is the most significant re-framing of a commodity semiconductor company since the market first re-rated Nvidia as an AI platform rather than a GPU maker in 2023. Barclays and Susquehanna’s rapid follow-on upgrades confirm institutional consensus is forming. Portfolio implication: the AI hardware supply chain is bifurcating between contracted infrastructure plays (MU, MRVL) and deal-specific/execution-risk plays (QCOM), with the former commanding structural premiums that compress only if LTA pricing is revealed to be below street estimates at the next earnings cycle.
What to watch:Micron’s next earnings for HBM4/HBM5 pricing confirmation and 2027 LTA expansion signals; hyperscaler Q2 capex guidance in late July as the revenue flow test for the $400B FCF projection; whether additional banks follow with comparable AI memory re-rating thesis upgrades.
BEARISH
4. Fed Hawkish Pivot Arc: Four Officials Escalate June FOMC Risk — Waller Drops Easing Bias, Cook Hike-Ready, Bowman Pivots, Schmid Raises QT — Rate Hike Now ~32% Probability
The core facts:Last Friday (May 22, baseline context): Governor Waller dropped the easing bias, called rate cuts “crazy,” drove 2Y yields to their highest since February 2025; hike odds jumped to ~43%. Tuesday (May 26, this week): Those odds remained elevated as markets processed Waller’s signal. Wednesday (May 27): Governor Cook delivered the most explicit hike signal of the 2026 cycle: “I am prepared to raise rates” if disinflation fails to materialize; April PCE tracking at 3.8% cited. Thursday (May 28): NY Fed Williams called policy “well-positioned,” providing the lone patient voice; St. Louis Fed Musalem warned AI productivity cannot rescue the Fed from 3.8% PCE — rejecting the soft-landing escape valve. Friday (May 29): Fed Vice Chair Bowman signaled a potential hawkish pivot if Iran inflation effects persist; Kansas City Fed Schmid called inflation “too hot for five years” and explicitly raised additional QT as a policy tool. Polymarket rate-hike probability: ~43% (last Fri) → ~32% (this Fri, reflecting mild core PCE undershoot).
Why it matters:Bowman’s pivot is the most significant single committee development of the week. She was previously the clearest patient voice; her “could change my view” language removes the last identifiable easing backstop. The FOMC now presents four documented hawkish voices from this week alone (Cook, Musalem, Bowman, Schmid), with only Williams explicitly patient. Schmid’s balance sheet tightening proposal is qualitatively new — using both rate increases AND accelerated QT simultaneously would be more restrictive than any combination deployed in the 2022–2023 hiking cycle and is not priced by markets. The June 11–12 FOMC has shifted from consensus hold to genuine debate, with the outcome depending critically on the Iran deal (oil deflation = patient) or collapse (oil re-spike = hike accelerated). (10Y yield ‑11.5 bps WoW despite hawkish Fed — see Vol & Treasuries table in Section B.)
What to watch:FOMC blackout begins approximately June 3; June 11–12 FOMC statement for formal rate-hike language or hawkish bias formalization; 2Y Treasury yield for sustained break above 4.80% as the market’s signal that a hike is being actively priced; May NFP (June 5) as the final pre-meeting data point.
BULLISH
5. Enterprise AI Layer Confirmed: Snowflake +34%, Marvell Beat+Raised ($11.5B FY27 Guide), Synopsys Beat+Raised — AI Demand Has Reached Software and Custom Silicon
The core facts:Wednesday AMC: Snowflake reported Q1 FY2027 product revenue +34% YoY — “strongest sequential dollar growth in company history” — plus a $6B five-year AWS infrastructure commitment; SNOW surged +34%. Marvell Technology reported Q1 FY2027 revenue $2.418B (+28% YoY, record), EPS +6.7% beat, and raised FY27 full-year AI custom silicon guide to ~$11.5B (∼40% growth). MRVL +5.07% AH. Synopsys reported Q2 FY2026 revenue $2.276B (+42% YoY including Ansys), organic EDA growth +8%, and raised FY2026 EPS guidance — the first post-Ansys acquisition integration beat. Oracle received JPMorgan’s “fourth hyperscaler” initiation at $210 (Thursday), backed by a $30B US government cloud contract; ORCL +6.67% Thursday and +10.84% Friday.
Why it matters:Snowflake’s reversal from deceleration to “strongest sequential growth in history” confirms AI demand has reached the enterprise data pipeline — the layer between foundation models and application deployment. Marvell’s $11.5B FY27 AI guide at 40% growth institutionalizes custom silicon (XPU/ASIC) as a multi-year contracted revenue stream, independent of whether any single hyperscaler’s capex moderates. Synopsys’s organic EDA +8% confirms AI chip design activity is running at full capacity — the supply chain from design (EDA) to fabrication to deployment is accelerating simultaneously. Read across to Salesforce (CRM, 31% EPS beat, record margins): even in enterprise software with aggressive AI agents monetization ambitions, the market is demanding revenue acceleration, not just margin efficiency — signaling that AI software monetization proof points remain the next de-risking event.
What to watch:Marvell’s next earnings for expansion of hyperscaler XPU programs beyond Google and Amazon partnerships; Broadcom custom ASIC updates for competing pipeline disclosures; Databricks (private) for enterprise data pipeline confirmation in the Snowflake cohort; Cadence for EDA demand cross-check.
BEARISH
6. Stagflation-Lite Confirmed: Q1 GDP 1.6%, Corporate Profits ‑0.4%, PCE 3.8%, Real Disposable Income ‑1.4% YoY — Record Equity Highs on Deteriorating Fundamentals
The core facts:Thursday (May 28) — a single data barrage delivered the week’s most consequential macro signal. Q1 2026 GDP revised to 1.6% SAAR (vs 2.0% consensus and 0.5% advance estimate), driven by genuine downward revisions in consumer spending and investment. Simultaneously, Q1 corporate profits fell ‑0.4% QoQ against a +5.7% consensus — the worst single-quarter miss in six years. April PCE confirmed at 3.8% YoY (+0.4% MoM, in-line), while core PCE MoM came in at +0.2% (slightly below the +0.3% expected). Personal income growth was flat (0% vs +0.4% consensus); real per-capita disposable income is running ‑1.4% year-over-year. Atlanta Fed GDPNow trimmed from 4.3% to 3.8% for Q2.
Why it matters:The combination — Q1 corporate profits ‑0.4% QoQ at the moment the S&P 500 is printing all-time highs on elevated forward earnings multiples — defines the week’s central paradox. Markets are pricing an AI-driven Q2/H2 earnings recovery that no current fundamental data supports. The income-spending gap is the consumer risk: households spending +0.5% MoM while income is flat and real DPI is ‑1.4% YoY signals savings drawdown — a pattern that historical Fed research flags as a leading indicator of consumption deceleration within 6–9 months. The corporate profit miss also directly contradicts the “84% of S&P beat in Q1” scorecard narrative: aggregate profits can fall ‑0.4% QoQ even when most companies beat individually, because the distribution skews toward smaller misses from large-cap cyclicals. The June–July Q2 corporate guidance season is the next test of whether the all-time equity high is front-running a recovery or discounting a deterioration.
What to watch:Q2 2026 GDP advance estimate (late July) for whether 1.6% is a floor or a trend; Q2 corporate earnings guidance in July for explicit acknowledgment of margin compression; Atlanta Fed GDPNow for real-time Q2 tracking — a further decline below 3.0% would significantly accelerate recessionary concern.
BULLISH
7. Chicago PMI Surges to 62.7 — 37-Month High, Demolished Consensus by 12 Points; Manufacturing Rebound Forces ISM Reassessment Monday
The core facts:Friday (May 29): The MNI Chicago Business Barometer surged 13.5 points in May to 62.7 — the largest single-month increase since 2020 and the highest reading in 37 months. The prior reading was 49.2 (contraction); consensus stood at 50.5. The 12.2-point beat-to-estimate gap is one of the largest in the indicator’s modern history. The reversal from two consecutive sub-50 months to 62.7 in a single reading is the sharpest contraction-to-boom turnaround since pandemic reopening. The April goods trade balance also beat on Friday at ‑$82.4B vs ‑$86.5B consensus, driven by record oil exports.
Why it matters:The Chicago PMI is a regional leading indicator for the national ISM Manufacturing PMI (releasing Monday June 1, consensus 52.6). A 37-month high in Chicago argues for a meaningful national ISM beat — which would force rapid unwinding of short positions in industrials and basic materials and remove the “manufacturing hard data cracking” narrative that had been building since Thursday’s core capex ‑1.1% miss. The surge likely reflects two forces: tariff front-running (accelerated orders ahead of potential escalation) and sustained AI-related capital expenditure driving demand for industrial components. If front-running, the May spike will reverse sharply in June. If genuine demand recovery, it creates the full “triple-assumption” bull case the market priced Friday: Iran deal (oil deflation) + Chicago PMI (growth acceleration) + no rate hike = record S&P simultaneously. Any single leg failing creates correction risk after nine consecutive weekly gains.
What to watch:ISM Manufacturing PMI Monday June 1 (consensus 52.6) — a national confirmation above 52 validates Chicago; a sub-50 miss exposes the regional reading as an outlier and immediately challenges the growth-acceleration thesis; ISM Prices sub-index as the most relevant Fed-policy input from the same release.
BEARISH
8. Consumer Stress Deepens Across Every Dimension: Beige Book “Slight Decline,” Costco Margin Compression, Two-Thirds Cutting Spending, Mortgage Rates 9-Month High
The core facts:Tuesday: Conference Board Consumer Confidence 93.1 (headline beat, but two-thirds of consumers cutting spending due to rising prices; Present Situation Index fell 3.2 points). Wednesday: Federal Reserve Beige Book described economic activity as experiencing “a slight decline” across all 12 districts — first such characterization since early 2024. Thursday: New home sales 622K (vs 670K consensus, ‑11.3% YoY); mortgage rates at 6.65%, a 9-month high; MBA applications ‑8.5% WoW (5th consecutive decline). Thursday: Personal income flat (vs +0.4% expected); real per-capita disposable income ‑1.4% YoY; consumers spending out of savings not income. Friday: Costco Q3 FY2026 earnings — gross margin contracted 21 bps on Iran-driven energy/transportation costs, despite 9.8% comparable sales growth; COST ‑3.91% on sell-on-earnings at P/E 49.
Why it matters:The consumer stress arc is the week’s most durable structural bearish signal because it compounds across every time horizon and every measurement methodology: surveys (CB, UMich from last Friday), behavioral data (Walmart sub-10-gal fills, CB two-thirds cutting), hard data (new home sales miss, income flat), Beige Book qualitative (“slight decline” for first time since early 2024), and earnings signals (Costco margin compression, WMT guidance miss). The Fed cannot cut rates into 3.8% PCE to relieve this consumer pressure — the stagflation trap operates precisely as the textbook describes. Costco’s margin contraction on transportation/energy costs is particularly notable: at P/E 49, even operationally resilient businesses face sell-on-earnings discipline when margins disappoint, signaling that defensives at current multiples carry downside risk even on beats.
What to watch:May NFP (June 5) as the first hard employment confirmation of the Beige Book’s “wait-and-see hiring” signal; June retail sales for first hard-data confirmation that spending cuts are reaching register-level consumption; Q2 homebuilder earnings in July for order cancellation rates and incentive disclosure.
UNCERTAIN
9. SpaceX $1.75T IPO Fast-Entry Eligibility + OpenAI IPO $852B Taking Shape — Two Historic Offerings Reshape Passive Flows and AI Sector Allocation
The core facts:Tuesday (May 26): FTSE Russell confirmed SpaceX appears eligible for fast-track inclusion in the Russell US Equity Indexes and FTSE Global Equity Index Series following its May 20 S-1 filing. SpaceX’s $1.75T IPO would qualify for the Russell Top 50, Russell 1000, FTSE All-World, and FTSE World Index. Passive fund analysis estimated ~19% of public float would need to be purchased by index-mandated buyers — the largest single mechanical index-entry demand event in equity history. Nasdaq listing expected June 2026. Friday (May 29): Bloomberg reported OpenAI added Citigroup and JPMorgan to its IPO underwriting syndicate alongside Goldman Sachs and Morgan Stanley — a four-bank lead syndicate targeting a September 2026 public listing at approximately $1 trillion valuation (current private mark: $852B).
Why it matters:SpaceX’s $1.75T forced passive demand event is the largest single index-driven mechanical buying event in market history — disconnected from valuation, it creates a structural price floor at IPO. More importantly, SpaceX’s classification as a top-10 global company by market cap immediately upon listing will force sector weight realignment and rebalancing across every Russell and FTSE benchmarked portfolio. The OpenAI IPO supply pipeline — OpenAI ($852B) plus Anthropic (near $1T private) plus SpaceX ($1.75T) — is the largest concentrated capital market event since the dotcom era. Institutional portfolio managers face a genuine allocation problem: all three trillion-class AI/Space offerings arriving within 6–18 months requires selling existing positions to fund, creating near-term rotation pressure on current AI mega-caps (MSFT, GOOGL, AMZN) whose implied valuations would be challenged by the private market benchmarks.
What to watch:SpaceX Nasdaq listing date and final IPO pricing; OpenAI’s confidential S-1 draft filing timeline (targeted late May); Russell Index reconstitution calendar for SpaceX’s earliest addition date and passive AUM volume estimate.
BULLISH
10. Eli Lilly +4.05%: CVS Caremark Restores Zepbound + Approves Oral GLP-1 Foundayo — 100M Covered Lives; Healthcare Sector Re-Rating Signal
The core facts:Thursday (May 28): CVS Caremark, one of the largest PBMs in the US (managing benefits for approximately 100 million Americans), reversed its prior formulary exclusion and restored commercial insurance coverage for Eli Lilly’s GLP-1 injection Zepbound. Simultaneously, CVS approved coverage for Foundayo — Lilly’s newly FDA-approved oral GLP-1 weight-loss drug, the first of its class. LLY surged +4.05% to $1,126.80, pushing market capitalization above $1.06 trillion. Healthcare sector +1.27% on the session, second-best of the day. Anthropic also raised $65B at a $965B private valuation (Thursday) — the largest private AI capital raise on record — benchmarking private AI companies at near-trillion valuations.
Why it matters:CVS’s formulary reversal is a direct near-term revenue catalyst: 100 million covered lives gaining access to Zepbound unlocks the largest single PBM’s patient population for Lilly’s primary revenue driver. Foundayo’s simultaneous approval is strategically significant — oral GLP-1 eliminates injection barriers, expanding the addressable market to patients unwilling to use injectables. Lilly now owns both the injectable and oral GLP-1 segments through the same PBM with 100M covered lives. The +4.05% on a $1T+ market cap represents ~$42B in value creation in a single session — demonstrating that GLP-1 formulary access decisions remain among the highest market-impact events in large-cap healthcare. Anthropic’s $965B valuation simultaneously provides a private market benchmark: if AI foundational models command trillion-dollar private valuations, the implied premium for public AI infrastructure plays (NVDA, MSFT, GOOGL) is validated rather than challenged.
What to watch:Express Scripts (Cigna) and OptumRx (UnitedHealth) formulary coverage decisions for Zepbound and Foundayo — if both follow CVS, the commercial access expansion is comprehensive; Q2 LLY earnings (July) for Zepbound prescription volume and net realized pricing to determine if coverage came at margin cost; OpenAI next funding round for whether it prices above or below Anthropic’s $965B benchmark.
— Separating signal from noise since 2007. Apply for membership at join.recessionalert.comD. WEEK IN THE ECONOMY -> TOP
The week delivered a textbook stagflation pulse: Thursday’s data dump simultaneously produced Q1 GDP revised to 1.6% (growth weakening) and April PCE confirmed at 3.8% (inflation persistent) — the worst-of-both-worlds configuration that eliminates the Fed’s room to maneuver in either direction. Corporate profits ‑0.4% QoQ cemented the signal: US earnings power is contracting at the exact moment the S&P 500 trades at all-time highs, pricing an AI-driven recovery that no current fundamental data supports. The mild core PCE undershoot (+0.2% MoM vs +0.3% expected) gave equity markets a one-session reprieve, but 10Y yields barely moved — bonds refused to accept the disinflation read as durable. The counterweight arrived Friday: Chicago PMI surged 13.5 points to 62.7 (37-month high), the most dramatic single-month manufacturing rebound since pandemic reopening, and the trade balance narrowed on record oil exports. Two readings, opposite implications, one economy — a data contradiction that Monday’s ISM Manufacturing will begin to resolve. The forward-policy bridge: if ISM confirms above 52, the dual-acceleration scenario (growth re-accelerating + inflation sticky) is the cleanest possible argument for Bowman and Schmid’s hawkish case at the June 11–12 FOMC.
POLYMARKET ODDS — WEEK-ON-WEEK SHIFT:
| Market | Last Friday | This Friday | Δ |
|---|---|---|---|
| US Recession by end-2026 | N/A | 19% | N/A |
| Fed rate hike in 2026 | ~43% | ~32% | ‑11 pp |
| Fed rate cuts ≥1 in 2026 | N/A | N/A | N/A |
BEARISH
Q1 GDP Revised to 1.6%; Corporate Profits ‑0.4% QoQ vs. +5.7% Consensus — Worst Profit Miss in Six Quarters (BEA, May 28, 2026)
What they’re saying:Q1 2026 real GDP revised to 1.6% SAAR — 40 bps below the 2.0% advance estimate and a full miss against the 2.0% consensus. The preliminary corporate profits figure fell ‑0.4% QoQ against a +5.7% consensus — the largest single-quarter profit miss in six years. Atlanta Fed GDPNow cut its Q2 tracking estimate from 4.3% to 3.8% in response. Separately, April personal income came in flat (0% MoM vs +0.4% consensus), with real per-capita disposable income running ‑1.4% year-over-year.
The context:The corporate profit collapse is the more significant signal: it suggests S&P 500 earnings power may have peaked even as equities trade at all-time highs on forward multiples pricing an AI-driven H2 recovery. The income-spending gap — consumers spending +0.5% MoM while income is flat — implies savings drawdown as the current consumption funding mechanism. Historical Fed research flags this pattern as a leading indicator of consumption deceleration within 6–9 months. The market’s Friday reaction (S&P +0.22%, Nasdaq records) reflects an AI-driven override of the fundamental signal — a divergence that Q2 corporate guidance in July will begin to resolve. (10Y yields barely moved on this data — see Volatility & Treasuries table in Section B.)
What to watch:Q2 GDP advance estimate (late July); Q2 corporate earnings guidance season for explicit margin compression acknowledgment; Atlanta Fed GDPNow — a decline below 3.0% would significantly accelerate recessionary concern.
BEARISH
April PCE Confirmed 3.8% YoY; Core MoM +0.2% (Slight Undershoot); Personal Income Flat — Real Disposable Income ‑1.4% YoY (BEA, May 28, 2026)
What they’re saying:April headline PCE +0.4% MoM / +3.8% YoY — in-line with consensus and explicitly meeting the level Governor Cook cited in her “prepared to raise rates” statement Wednesday. Core PCE MoM +0.2% (vs +0.3% consensus) — a slight positive surprise that markets seized on. Personal income 0% MoM (vs +0.4% expected); real per-capita disposable personal income ‑1.4% year-over-year; personal spending held at +0.5% MoM.
The context:The +0.2% core MoM is the data point equity markets used to justify Friday’s rally — but it is not disinflation. PCE headline at 3.8% is nearly double the 2% target. One below-consensus monthly reading against a backdrop of 3.8% headline, Bowman and Schmid’s explicit hawkish signals, and an unresolved energy supply shock does not constitute the “timely disinflation” that Cook cited as the condition for staying on hold. The income gap — spending outpacing income by 50bps monthly — means consumption resilience is being funded by savings drawdown, a mechanism with a finite runway. (Polymarket hike odds fell ‑11pp WoW on the core undershoot — see table above.)
What to watch:May PCE (released late June) for whether the +0.2% core MoM is the start of a deceleration trend or a one-month artifact; June FOMC statement for any modification to the hawkish framing given the slight core undershoot; credit card delinquency data from major bank Q2 earnings in July for the savings-drawdown rate signal.
BULLISH
Chicago PMI Surges to 62.7 (37-Month High) + Trade Balance Beats at ‑$82.4B — Strongest Week-End Growth Signal Since 2023 (MNI & Census Bureau, May 29, 2026)
What they’re saying:Chicago PMI surged 13.5 points to 62.7 in May — the largest single-month increase since 2020 and the highest reading in 37 months; prior was 49.2 (contraction). Consensus stood at 50.5; the 12.2-point beat is among the largest in the indicator’s modern history. Simultaneously, April advance goods trade balance narrowed to ‑$82.4B vs ‑$86.5B consensus, driven by record US oil and petroleum exports as domestic production captured Middle Eastern market share during Hormuz disruption.
The context:The Chicago PMI’s magnitude defies simple interpretation: a 13.5-point single-month swing from contraction to near-boom conditions reflects either genuine tariff front-running (orders pulled forward ahead of potential escalation — a one-quarter surge that reverses) or real demand recovery anchored in AI capex — in which case it is durable. The trade balance improvement is partially mechanical: record oil exports are a Hormuz-disruption artifact that partially normalizes if Iran’s supply returns. GDPNow’s June 1 update will incorporate both data points — the model likely revises back toward 4%+, providing the growth-acceleration leg of the triple-assumption bull case the market was pricing at Friday’s close. (GDPNow at 3.8% as of May 28 — update pending.)
What to watch:ISM Manufacturing PMI Monday June 1 (consensus 52.6) — the national confirmation or refutation; ISM Prices sub-index as the Fed-relevant inflation input from the same release; GDPNow June 1 update incorporating today’s trade data.
BEARISH
Housing Cluster: New Home Sales 622K (‑11% YoY Miss), Case-Shiller 10th Consecutive Negative Real Month, Mortgage Rates 9-Month High 6.65%, MBA ‑8.5% (Census / S&P / MBA, May 26–28, 2026)
What they’re saying:Tuesday: Case-Shiller national home price index +0.7% YoY in March (vs 1.0% consensus), the 10th consecutive month of negative real returns with more than half of major metro areas posting year-over-year nominal declines. Wednesday: MBA mortgage applications ‑8.5% WoW; 30-year fixed rate 6.65%, a 9-month high, fifth consecutive weekly increase. Thursday: April new home sales 622K SAAR (vs 670K consensus, ‑6.2% MoM, ‑11.3% YoY) — weakest print since late 2024; April durable goods headline +7.9% (Boeing distortion) but core capex ‑1.1% (second consecutive monthly decline in business investment).
The context:The housing data cluster confirms that rate-sensitive sectors are absorbing the full impact of Warsh’s hawkish Fed inheritance. The transaction market is being closed down by affordability constraints, not merely slowed: the ‑11.3% YoY decline in new home sales alongside the ‑8.5% MBA purchase application decline in the same week are twin demand-destruction signals. Homebuilders face mounting forward guidance risk — their Q2 earnings in July are a high-risk event where order cancellation rates and incentive packages will either validate or invalidate the “housing recovery” thesis. Core capex’s second consecutive monthly miss (‑1.1%) is consistent with the Beige Book’s “wait-and-see” corporate posture — the Boeing aircraft distortion flatters the headline but strips out to genuine business investment contraction.
What to watch:Homebuilder Q2 earnings in July for explicit order cancellation rates; MBA purchase application data (June 4) for whether the fifth consecutive weekly decline extends; 30-year mortgage rate behavior around the 6.65% level as the threshold where affordability becomes acute demand destruction.
BEARISH
Beige Book: First “Slight Decline” Since Early 2024 Across All 12 Districts; CB Consumer Confidence Two-Thirds Cutting Spending (Federal Reserve & Conference Board, May 27–26, 2026)
What they’re saying:Wednesday: The Federal Reserve Beige Book described a “slight decline” in overall economic activity across all 12 Federal Reserve Districts — the first such characterization since early 2024, stepping down from the prior “slight to modest growth.” Regional business contacts across all districts cited “elevated levels of economic and policy uncertainty” from the Iran war and tariff changes, describing a defensive wait-and-see posture on hiring, capital investment, and pricing. Tuesday: Conference Board Consumer Confidence 93.1 (slight headline beat vs 91.9 consensus), but two-thirds of consumers reported actively cutting spending due to rising prices; Present Situation Index fell 3.2 points.
The context:The Beige Book’s “slight decline” characterization is institutionally significant: it is the Fed’s own qualitative read on what businesses across all 12 districts are actually experiencing. Combined with two-thirds of CB respondents cutting spending and the UMich all-time-low of 44.8 (from last Friday), the demand-destruction signal is comprehensive — spanning surveys, behavioral data, and the Fed’s own ground-level reporting. The universal “wait-and-see” hiring posture across all 12 districts is the leading indicator for the June employment report. A 9-of-11 sector bearish sweep on Friday (only Technology positive) confirms the Beige Book’s portrait is being expressed in equity sector positioning as capital concentrates into AI infrastructure at the expense of everything else.
What to watch:May Non-Farm Payrolls (June 5) as the first hard-data confirmation of the Beige Book’s hiring freeze signal; June Beige Book (ahead of July FOMC) for whether “slight decline” deepens toward “modest decline”; June retail sales for behavioral spending-cut confirmation in register-level consumption data.
— Know the probability before the market prices in the risk. Apply for membership at join.recessionalert.comE. WEEK IN EARNINGS -> TOP
TOP EARNINGS OF THE WEEK
BULLISH
1. Dell Technologies (DELL): +32.8% week | Q1 FY2027 — Every Financial Metric at Record; Revenue +88%, AI EPS +214%, FY27 Guide Raised $27B Above Prior Consensus
The Numbers:Q1 FY2027 (ended May 1, 2026): Revenue $43.84B (vs $35.43B est., +88% YoY, record). Non-GAAP EPS $4.86 (vs $2.96 est., +64% beat, diluted EPS +214% YoY, record). GAAP diluted EPS $5.24 (+282% YoY). Operating income $4.2B (+154% YoY) on 9% opex growth. Operating cash flow $4.1B (record). ISG (Infrastructure Solutions Group) $29.01B (+181% YoY). AI server revenue $16.13B (+757% YoY); AI orders $24.4B; AI backlog $51.3B (record). FY27 guide: revenue $165–169B (vs $142.5B prior consensus), EPS $17.90 (vs $13.09), AI server revenue ~$60B.
The Problem/Win:The financial print specifics reveal the structural magnitude: operating income +154% YoY on only 9% opex growth means AI server margin is expanding at scale — this is not a revenue-for-margin trade. ISG’s $29.01B (+181% YoY) alone exceeds Dell’s entire quarterly revenue from two years ago. The pipeline: management described forward AI demand as “multiples” of the existing $51.3B backlog, with memory and components as the only supply constraint — a demand-is-not-the-problem statement that eliminates the primary bear case. GAAP EPS +282% YoY at this revenue scale is not an adjusted-metric artifact; the cash generation is real.
The Ripple:DELL’s print is the week’s most consequential sector read-through. XLK advanced +2.2% on Friday alone. SuperMicro, Vertiv, Arista, and power/cooling infrastructure names face a structural positive demand signal. Nvidia’s H100/H200/Blackwell ecosystem is implicitly confirmed as a $60B Dell AI server delivery pipeline for FY27. The $51.3B backlog directly implies sustained GPU procurement. (“Why it matters” for the enterprise AI super-cycle narrative is in Section C story #2 — this box focuses on the financial-print specifics that C did not surface.)
What It Means:Dell’s FY27 guidance raise of $27B above prior consensus means sell-side models were systematically wrong by a margin that rivals NVDA’s 2024 estimate-miss period. This implies analyst models for every peer company with AI infrastructure exposure (SMCI, HPE, Vertiv) remain too conservative — a potential earnings revision wave into the Q2 reporting cycle.
What to watch:Q2 FY27 AI orders intake for whether the $24.4B Q1 pipeline sustains or accelerates; SMCI and Vertiv Q2 for supply-chain read-through; NVDA August earnings for GPU shipment volume corroboration of the $51.3B backlog; operating margin trajectory as AI server mix continues to expand as a share of total revenue.
BULLISH
2. Marvell Technology (MRVL): +5.07% AH | Q1 FY2027 Record Revenue +28% YoY; Full-Year AI Custom Silicon Guide Raised to $11.5B (~40% Growth)
The Numbers:Q1 FY2027 revenue $2.418B (record, +28% YoY; consensus $2.41B, beat). Non-GAAP EPS $0.80 (vs $0.75 consensus, +6.7% beat). Non-GAAP gross margin 58.9%. Q2 FY27 guide: revenue $2.700B ±5%, EPS $0.93 ±$0.05. Full FY27 guide: revenue ~$11.5B (~40% growth YoY). Released AMC May 27; MRVL +5.07% AH, confirming the beat-and-raise was read as genuine AI acceleration.
The Problem/Win:The $11.5B FY27 guide at 40% growth institutionalizes custom silicon (XPU/ASIC) as a multi-year contracted revenue stream — the same de-risking milestone that LTA-based HBM pricing provided Micron. Marvell’s AI custom chip programs (hyperscaler ASIC designs for Google, Amazon, and expanding partners) are the primary growth engine, and the Q2 guide of $2.7B implies sequential acceleration into H2 FY27 — the opposite of deceleration risk that weighed on MRVL through 2025. The 58.9% non-GAAP gross margin on a $2.4B revenue quarter demonstrates that AI custom silicon carries premium economics, not commodity economics.
The Ripple:Positive for the AI custom ASIC supply chain: Broadcom faces renewed investor pressure to match Marvell’s FY27 guide ambition at its next earnings update. EDA software companies (Synopsys — also beat this week — and Cadence) see upstream design demand validated. The MRVL beat combined with SNPS’s organic EDA +8% confirms the AI chip design-to-deployment pipeline is running at full capacity simultaneously.
What It Means:Marvell’s $11.5B FY27 revenue guide positions it as a $100B+ revenue-trajectory company in AI infrastructure — a re-rating event that is structurally similar to what NVDA experienced in 2023–2024 when contracted AI demand was first proven. The AI custom silicon market (non-Nvidia alternative accelerators) is no longer speculative; it is guidanced and contracted.
What to watch:Marvell’s next earnings for expansion of hyperscaler XPU partnerships beyond known Google and Amazon programs; Broadcom custom ASIC disclosure for competitive pipeline comparison; Q2 FY27 revenue vs $2.7B guide as the first in-quarter test of whether the acceleration is durable.
UNCERTAIN
3. Costco Wholesale (COST): ‑4.6% Friday | Q3 FY2026 Revenue Beat and +9.8% Comps Cannot Overcome Gross Margin Compression at P/E 49
The Numbers:Q3 FY2026 (ended May 11, 2026): Revenue $70.53B (+12% YoY, vs $69.81B estimate — beat). GAAP EPS $4.93 (vs ~$4.91 consensus — slight beat). Comparable sales +9.8% globally; digital comps +21.5%. Membership renewal rate 89.7%; total cardholders 148.5M. Gross margin 11.04%, down 21 bps YoY (higher transportation costs and energy prices flowing through logistics). Management flagged further tariff-driven inflation in nonfood categories (resin costs) for Q4. AH reaction: flat to slight negative; Friday session ‑4.6% (sell-on-earnings at P/E ~49).
The Problem/Win:The win is structural and consistent: 9.8% comparable sales growth in a “wait-and-see” consumer environment (Beige Book) confirms Costco’s membership model is capturing wallet-share as consumers trade down to value. The 89.7% renewal rate is structurally robust — the membership flywheel is intact. The problem is financial: at P/E ~49, the market prices perfection. The 21-bps gross margin contraction — driven by Iran-related energy and transportation costs — removes the “margin stability” pillar of the Costco bull case. Management’s explicit Q4 warning on nonfood tariff pass-through signals the margin pressure is not one-quarter; it is structural under the current tariff and energy environment.
The Ripple:Consumer Defensive sector ‑3.23% for the week; Costco’s reaction reinforced valuation-discipline selling in high-multiple defensive names. BJ’s Wholesale, Target, and Walmart face the same margin-compression-at-premium-multiple question. Separately, reports emerged Costco may announce a special dividend — a potential near-term catalyst that partially offsets the margin narrative headwind.
What It Means:The Costco result illustrates a broader valuation discipline problem in Consumer Staples at current multiples: operationally solid results trigger selling when margins disappoint at elevated P/E, because the market requires both operational resilience AND margin stability to justify premium defensive multiples in a stagflation-lite environment. An Iran deal that reduces energy/transportation costs could restore the Costco margin thesis by Q4 FY2026.
What to watch:Q4 FY2026 Costco earnings (August) for gross margin trajectory and tariff cost quantification; special dividend announcement timing as a near-term catalyst; Walmart’s next quarterly for comparable comps and margin compression signals across big-box.
WEEK AHEAD PREVIEW:
Q1 2026 earnings season is functionally complete (~92% of S&P 500 reported; blended +27.7% YoY EPS growth — highest since Q4 2021). The coming week’s spotlight shifts to a single major reporter — cybersecurity’s bellwether — before the June FOMC decision and May Non-Farm Payrolls define the macro direction for summer.
Palo Alto Networks (PANW) — AMC, Tuesday, June 2 — Key focus: NGS Annual Recurring Revenue (ARR) guidance of $7.94–7.96B (+56% implied YoY) vs Q2’s $6.33B actual (+33%); platformization momentum (1,550 customers, +35% YoY) for acceleration signals; integration cost headwinds from the CyberArk acquisition; EPS consensus $0.80, revenue consensus $2.94B (+28.6% YoY). PANW is the high-watermark cybersecurity name — guidance commentary on enterprise IT security spending will be read as a direct corroboration or challenge to Dell’s AI capex super-cycle thesis from Thursday’s blowout.
Beyond earnings, the week’s defining events are macro: ISM Manufacturing PMI (Monday, June 1) as the first national confirmation or refutation of Friday’s Chicago PMI 62.7 surge; and May Non-Farm Payrolls (Friday, June 5) as the highest-impact remaining data point ahead of the June 11–12 FOMC meeting — a print above 200K locks the Fed on hold; below 150K deepens the stagflation-lite dilemma. Q2 2026 earnings season begins mid-July.
— US market commentary trusted by family offices and institutions. Apply for membership at join.recessionalert.comF. NEXT WEEK SETUP -> TOP
UPCOMING RELEASES:
| Date | Event | Why It Matters |
|---|---|---|
| Mon, Jun 1 | ISM Manufacturing PMI — May (exp. 52.6, prior 52.7) | The highest-stakes release of the week: Friday’s Chicago PMI exploded to 62.7, a 37-month high. A national ISM above 52 confirms the manufacturing rebound and forces short-covering in industrials; a miss below 50 would expose the Chicago reading as a regional outlier and revive the Q3 industrial slowdown thesis. |
| Mon, Jun 1 | ISM Manufacturing Prices — May (exp. 85.3, prior 84.6) | Input price inflation at 85.3 alongside persistent 3.8% PCE would add directly to the Bowman-Schmid hawkish case at the Fed; a sustained elevation above 80 in the prices component is the transmission channel from manufacturing demand to consumer inflation. |
| Mon, Jun 1 | ISM Manufacturing New Orders — May (exp. 54.1, prior 54.1) | New orders stability at 54.1 would confirm forward demand visibility for US manufacturers; a surprise jump consistent with Chicago’s blowout would signal Q3 order books are filling ahead of potential tariff escalation. |
| Mon, Jun 1 | Construction Spending MoM — Apr (exp. 0.3%, prior 0.6%) | A deceleration to 0.3% would reflect the softening in residential investment visible in recent housing data; watch for AI data center and semiconductor fab construction offsetting residential weakness. |
| Tue, Jun 2 | JOLTs Job Openings — Apr (exp. 6.8M, prior 6.866M) | A decline toward 6.8M would suggest modest labor demand cooling consistent with gradual jobless claims increases; the openings-to-unemployed ratio is the Fed’s preferred labor tightness gauge ahead of the June FOMC — any sharp drop below 6.5M would shift the committee’s balance toward caution. |
| Tue, Jun 2 | PANW Earnings AMC | Palo Alto Networks is the week’s only major earnings reporter; NGS ARR guide and platformization momentum will be read as a direct test of enterprise AI capex durability following Dell’s blowout — if PANW confirms accelerating enterprise IT security spend, the AI infrastructure thesis gains another sector dimension. |
| Wed, Jun 3 | ADP Employment Change — May (exp. 110K, prior 109K) | The private sector payroll preview for Friday’s NFP; consensus at 110K implies steady but unspectacular hiring; a print above 150K would reinforce the labor resilience narrative and lock the June FOMC on hold, while a sub-80K miss deepens the stagflation-lite concern. |
| Wed, Jun 3 | ISM Services PMI — May (exp. 53.6, prior 53.6) | Services sector stability is the core underpinning of the 3.8% GDPNow Q2 estimate; a beat combined with Monday’s ISM Manufacturing above consensus would present a fully re-accelerating economy to Fed hawks at precisely the wrong time — June FOMC rate-hike odds would re-price sharply higher. |
| Wed, Jun 3 | Fed Beige Book | The anecdotal district-level survey is the last Fed communication before the June 3 blackout period; watch for language on consumer spending durability, regional manufacturing conditions, and any early inflation pass-through from tariffs or energy costs that would validate the Schmid hawkish view. |
| Fri, Jun 5 | May Non-Farm Payrolls | The single highest-impact upcoming data point: a strong print (+200K+) locks the Fed on hold and supports the risk-on equity narrative; a weak print (<150K) deepens the stagflation-lite dilemma — soft growth with inflation still at 3.8% is the worst-case FOMC input ahead of the June 11–12 meeting. |
WHAT TO WATCH NEXT WEEK:
1. Did Trump approve the Iran deal over the weekend? This is the binary event the entire market was pricing at Friday’s close. A signed framework means WTI toward $80/bbl, structural PCE relief, and Fed patience extended through summer. A collapse reverses May’s 17% crude decline in days, simultaneously validates Bowman and Schmid’s hawkish case, and creates a dual macro headwind heading into June FOMC. Monday oil futures open is the first real-time verdict — the gap between a signed deal and a collapsed framework could easily be 10%+ in crude.
2. Can Monday’s ISM Manufacturing confirm Chicago PMI’s 37-month high at 62.7, or does the national number expose a regional distortion? A sub-50 ISM immediately challenges the growth-acceleration thesis that drove the S&P’s ninth consecutive weekly gain and forces re-evaluation of whether the AI capex super-cycle is broad enough to sustain the triple-assumption bull case (growth accelerating + Iran deal + no rate hike) that markets priced simultaneously on Friday.
3. Will May Non-Farm Payrolls resolve the Beige Book’s “wait-and-see hiring” signal into a real labor market cooling? The Beige Book flagged a universal defensive hiring posture across all 12 districts. If the Beige Book is right and NFP comes in below 150K, the FOMC faces the worst possible input ahead of its June 11–12 meeting: stagflation-lite (growth softening + inflation at 3.8%) with no good policy option. If NFP is strong (+200K+), the Beige Book’s qualitative warning is overridden and the Fed has cover to hold.
4. Does PANW’s Tuesday earnings confirm or challenge Dell’s enterprise AI capex narrative? PANW is the week’s only major earnings reporter, and its NGS ARR guidance will be read as the enterprise IT security counterpart to Dell’s infrastructure blowout. If Palo Alto confirms accelerating enterprise security spend tied to AI deployment, the AI super-cycle extends from hardware (DELL, MU) through software infrastructure (PANW, CRM) — a sector rotation catalyst for the security complex.
— US market commentary trusted by family offices and institutions. Apply for membership at join.recessionalert.comG. CHART OF THE WEEK -> TOP
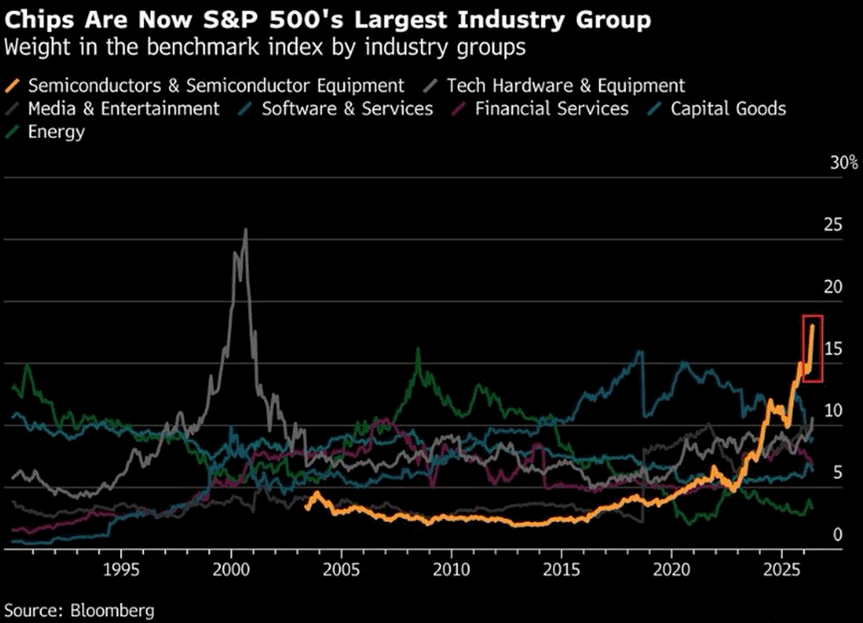
Chart of the Week: In a week when Dell (+66.5%), Micron (+27%), Oracle (+19%), and IBM (+18%) delivered the largest single-week concentration of AI infrastructure wealth creation in equity history, the semiconductor sector’s share of the S&P 500 reached approximately 17% — deepening the fourth historical precedent in which a single industry’s extreme index weight has coincided with market peaks (Media 24% in 2000, Financials 22% in 2007, Energy 16% in 2008, each followed by 25–55% drawdowns). The falsification condition is not whether the concentration exists but whether the AI earnings cycle — now evidenced by contracted LTAs, $51B backlogs, and $11.5B forward guides — delivers the return on invested capital that would make today’s multiples rational rather than historical.
MIB Weekly Digest Ver. 1.64
For professional investors only. Not investment advice.
© 2026 RecessionALERT.com

Comments are closed.