
MARKET INTELLIGENCE BRIEF (MIB)
Wednesday, July 1, 2026
META +8.85% on AI cloud reports; global semi selloff (KLAC -11.8%, MU -10.57%, SOX -7%) split Q3’s opening session. Atlanta Fed cut GDPNow to 1.2% from 2.5% — 2026’s largest single-day revision — as ADP missed at 98K; Thursday’s NFP is the binary risk event. Warsh at ECB Sintra refused July guidance with hike odds at 54%; 10Y +6 bps to 4.48%. WFC +3.99% on Goldman upgrade and 11% dividend raise as all 32 banks cleared stress tests; Financials +1.61%.
TABLE OF CONTENTS
A. EXECUTIVE SUMMARY
B. MARKET DATA
C. HIGH-IMPACT STORIES (5)
D. MODERATE-IMPACT STORIES (5)
E. ECONOMY WATCH (6)
F. EARNINGS WATCH (0)
G. WHAT’S NEXT
H. CHART OF THE DAY
A. EXECUTIVE SUMMARY -> TOP
Q3 2026 opened on a split screen: META’s AI cloud business announcement — transforming $50B+ in unmonetized capex into a revenue stream competing with AWS, Azure, and Google Cloud — drove Communication Services to the session’s top sector (+2.61%), while a global semiconductor selloff (KLAC -11.8%, MU -10.57%, SOX -7%) pushed the Nasdaq 100 down -1.54% against a flat Dow. The macro backdrop darkened simultaneously: Atlanta Fed GDPNow collapsed from 2.5% to 1.2% — the largest single-day revision of 2026 — as ADP missed at 98K and the 10-year yield rose 6 bps to 4.48% after Fed Chair Warsh refused any July rate guidance at the ECB Sintra forum. VIX gained only 0.73% despite tech’s rout, confirming orderly selling — but Q3 begins with a stagflationary backdrop: growth at 1.2%, inflation “too high” by Warsh’s own declaration, and no Fed backstop.
• META +8.85% on Bloomberg reports of a new AI cloud business to sell compute and models externally; Communication Services best sector (+2.61%); PLTR +7.73% on enterprise AI beneficiary sentiment; META added ~$130B in market cap in a single session.
• Global semiconductor rout: KLAC -11.8%, MU -10.57%, SNDK -10.50%, AMAT -9.97%, LRCX -9.71%; SOX opened -7%; KOSPI circuit breaker triggered in Asia. Technology worst S&P 500 sector at -2.35% — reversing its YTD leadership (+20.71%).
• Atlanta Fed GDPNow cut to 1.2% from 2.5% — the largest single-day revision of 2026 — after ADP June payrolls came in at 98K (vs. 113K consensus), the softest since late 2025. Thursday’s BLS Nonfarm Payrolls (consensus 110K, Pantheon 75K, prior 172K) is the week’s binary risk event.
• Warsh declines July guidance at ECB Sintra forum; July hike odds remain at 54%; 10Y rose 6 bps to 4.48%; no safe-haven Treasury bid. Utilities -1.38%, Industrials -2.28% as rate-sensitive sectors absorbed the higher-for-longer signal.
• WFC +3.99% on Goldman Sachs Conviction List addition and 11% dividend raise ($0.50/share Q3); all 32 banks cleared the 2026 Fed stress test; Financials +1.61%, second-best sector. JPMorgan and Goldman also announced capital returns.
• ISM Manufacturing Prices Paid -9.1 pts to 73.0 — largest single-month drop since July 2022; WTI -1.99% to $68.12 (2026 low) despite EIA 3.8M barrel crude draw; Goldman cuts 12-month US recession odds to 15%, citing Iran peace deal energy relief.
1. AI monetization fractures the chip trade — META’s pivot to an external cloud business simultaneously validates AI infrastructure investment and raises hyperscaler self-sufficiency risk, threatening addressable demand for third-party chip vendors. SK Hynix’s deliberate HBM4 slowdown — redirecting capacity to conventional DRAM where margins now exceed HBM premiums — confirms the demand inflection at the supply side itself. The 82% H1 SOX gain embedded the most optimistic scenario; today’s 7% single-session correction is the first real stress test of the AI capex supercycle thesis entering Q3.
2. Stagflation re-emerges as Q3’s defining portfolio tension — Today’s synchronized signals — GDPNow at 1.2%, ADP at 98K, ISM Prices Paid plunging 9.1 points, Warsh declining any guidance — construct the rarest investing environment: slowing growth, inflation “too high” by the Fed Chair’s own declaration, and a central bank explicitly without a policy backstop. The 10Y rising 6 bps while equities fell (no safe-haven bond bid) confirms markets are not treating decelerating growth as a bullish-for-bonds signal. Thursday’s NFP is the critical test of whether the labor market confirms this deterioration or provides a reprieve before the July 16–17 FOMC.
3. Financials as the structural rotation anchor — Banks entering Q3 fully capitalized (all 32 cleared stress tests), raising dividends, and positioned for NIM expansion in a higher-for-longer rate environment offer the clearest defensive growth trade in a stagflationary backdrop. Goldman’s Conviction List addition of WFC signals the bank upgrade cycle is early-stage; the OCC asset cap removal — not yet priced — remains the next major re-rating catalyst. On a day when the broad market drifted and tech sold off, Financials’ +1.61% session performance signals institutional rotation toward rate-beneficiary names as Q3’s inflation-hedge anchor.
 — Leading economic indicators. Accurate market forecasts. Apply for membership at join.recessionalert.com
B. MARKET DATA -> TOP
The opening session of Q3 2026 delivered a stark bifurcation: Meta Platforms surged 8.9% on Bloomberg reports of a new external AI cloud business — answering investor AI-capex ROI concerns — catapulting Communication Services (+2.61%) to the day’s top sector, while semiconductor equipment names (KLA -11.8%, Applied Materials -9.97%) deepened June’s chip-cycle sell-off and dragged Technology to -2.35%. The Nasdaq 100 fell -1.54% while the Dow barely moved (-0.02%) and DJ Transports gained +0.97% on crude’s continued slide, revealing a narrow, sector-specific rout beneath a resilient market surface. Wells Fargo jumped 3.99% after clearing the 2026 Fed stress test and raising its dividend 11%. The 10-year yield rose 6 bps to 4.48% as Fed Chair Warsh offered no rate guidance at the global central bank panel.
CLOSING PRICES – Wednesday, July 1, 2026:
MAJOR INDICES
The Nasdaq 100’s -1.54% loss against the Dow’s near-flat close (-0.02%) defines the day: this was a tech/semi rout, not a broad selloff. Russell 2000 (-0.30%) and NYSE (-0.41%) confirm the damage was concentrated. Dow Theory bull confirmation emerges today (first session): both DJIA and DJTA are within 1.1% of their 10-session highs. Russell 2000 has outpaced the S&P 500 over the trailing 10 sessions by 2.83% — an entrenched broad-participation pattern now in its 10th consecutive session.
| Index | Close | Change | %Move | Why It Moved |
|---|---|---|---|---|
| S&P 500 | 7,483.40 | -15.96 | -0.21% | Mixed session — META AI cloud story lifted Communication Services; semiconductor equipment rout dragged Technology -2.35%; net modest decline |
| Dow Jones | 52,306.22 | -12.98 | -0.02% | Virtually flat; blue-chip index absorbed the tech selloff while Financials and Consumer Cyclical added support |
| DJ Transportation | 21,959.7 | +209.9 | +0.97% | Crude oil fell -2%; lower fuel-cost expectations lifted freight and logistics names heading into Q3 |
| Nasdaq 100 | 29,809.13 | -467.22 | -1.54% | Semiconductor equipment names (KLA -11.8%, Micron -10.6%, Applied Materials -9.97%) led a concentrated chip-cycle sell-off dominating the tech-heavy index |
| Russell 2000 | 3,015.34 | -9.03 | -0.30% | Modest decline in a mixed session; small-cap broad-participation signal intact over 10-session window vs S&P 500 |
| NYSE Composite | 23,737.18 | -97.05 | -0.41% | Mixed breadth — 5 of 11 sectors gained, 6 declined; rotation from Technology into Communication Services and Financials |
VOLATILITY & TREASURIES
VIX rose just 0.73% despite the Nasdaq’s -1.54% decline — orderly selling, not panic. The 10Y jumped 6 bps to 4.48% while equities fell, with bonds declining to bid; Fed Chair Warsh offered no rate-cut signals at the global central bank panel, stranding the market without a policy backstop. The 10Y rising 6 bps vs the 2Y’s 3.7 bps steepens the curve modestly — a subtle reflationary tilt as Q3 begins.
| Instrument | Level | Change | Why It Moved |
|---|---|---|---|
| VIX | 16.57 | +0.12 (+0.73%) | Modest uptick on tech/semi declines; muted fear response signals selling is orderly; well below systemic-concern levels |
| 10-Year Treasury Yield | 4.482% | +6.0 bps | Fed Chair Warsh offered no rate-cut guidance; bonds declined alongside equities — no safe-haven flight to Treasuries despite equity weakness |
| 2-Year Treasury Yield | 4.176% | +3.7 bps | Short-end yields rose less than 10Y; modest curve steepening signal; markets not pricing near-term Fed action |
| US Dollar Index (DXY) | 101.39 | +0.20 (+0.20%) | Mild dollar strength on lack of Fed dovish guidance; DXY consolidating after Q2 softness |
COMMODITIES
Gold +0.31% while silver fell -0.36% — a minor precious metals split signaling mild safe-haven positioning; platinum’s +1.35% aligns with gold, not industrial metals. Copper’s -1.54% decline echoes the semiconductor capex-cycle concern narrative and a soft industrial demand backdrop. Bitcoin’s +2.05% decoupled from a broadly lower equity tape, testing the $60K threshold — crypto-specific positioning rather than risk sentiment.
| Asset | Price | Change | %Move | Why It Moved |
|---|---|---|---|---|
| Gold | $4,050.85/oz | +$12.35 | +0.31% | Mild safe-haven bid amid equity uncertainty; gold holding above $4,000 psychological level; rising yield pressure limits upside |
| Silver | $59.708/oz | -$0.214 | -0.36% | Industrial demand concerns weigh; diverging from gold reflects risk-off rather than inflation-hedge buying |
| Copper | $6.1575/lb | -$0.0965 | -1.54% | Soft industrial demand signal; decline aligns with semiconductor capex concerns and mixed global growth outlook |
| Platinum | $1,586.90/oz | +$21.10 | +1.35% | Moving with gold in safe-haven mode; autocatalyst demand steady; diverging from copper’s industrial weakness |
| Bitcoin | $59,979 | +$1,203 | +2.05% | Decoupled from equity weakness; crypto-specific positioning as BTC tests the $60K threshold; not tracking risk sentiment today |
ENERGY
WTI (-1.99%) and Brent (-2.34%) fell in near-identical lockstep — no spread widening — confirming a global demand and supply-dynamics story, not a regional disruption. Iran’s rejection of direct US talks failed to add a geopolitical premium; markets are pricing improved supply availability over political risk. Natural gas fell -2.26% alongside crude — broad energy deflation. Oil declining with equities signals soft demand expectations, not a supply shock.
| Asset | Price | Change | %Move | Why It Moved |
|---|---|---|---|---|
| Crude Oil (WTI) | $68.12/bbl | -$1.38 | -1.99% | Q2 2026’s largest quarterly crude decline since 2020 (~30% Q2 drop) carries into Q3; demand concerns outweigh Iran diplomatic tensions |
| Crude Oil (Brent) | $71.24/bbl | -$1.71 | -2.34% | Iran rejected direct US talks but market focused on demand weakness and OPEC supply dynamics; global benchmark extending June losses |
| Natural Gas (Henry Hub) | $3.201/MMBtu | -$0.074 | -2.26% | Broad energy complex weakness; mild Q3 seasonal demand outlook; moving in tandem with crude |
| Natural Gas (Dutch TTF) | $14.26/MMBtu | -$0.28 | -1.90% | European gas declining with US; Iran nuclear uncertainty reduced supply-risk premium; TTF/Henry Hub moving in tandem today |
S&P 500 SECTORS
Today’s headline divergence: Communication Services surged +2.61% on META’s cloud announcement yet sits -3.84% over the past month — a sharp single-day reversal of June’s laggard. Technology is today’s worst sector (-2.35%) despite leading YTD (+20.71%) and the 3-month period (+30.14%); the semi equipment rout corrects an historically extended run. Industrials’ session loss (-2.28%) stands out against +18.86% YTD strength — lower oil helps Transports, but broader industrial stocks face yield-pressure headwinds.
| Sector | 1-Day | 1-Week | 1-Month | 3-Month | 6-Month | YTD | 12-Month |
|---|---|---|---|---|---|---|---|
| Communication Services | +2.61% | +4.32% | -3.84% | +10.51% | +1.45% | +1.66% | +20.35% |
| Financial | +1.61% | +2.05% | +6.50% | +12.87% | +2.52% | +3.47% | +12.53% |
| Consumer Cyclical | +0.87% | +3.16% | -1.64% | +7.21% | -4.69% | -3.52% | +5.40% |
| Real Estate | +0.37% | -0.23% | +3.16% | +9.18% | +8.47% | +9.37% | +8.22% |
| Healthcare | +0.22% | +3.87% | +8.47% | +9.22% | +3.40% | +4.43% | +20.23% |
| Consumer Defensive | -0.49% | -2.31% | +1.14% | -0.35% | +4.95% | +5.75% | +3.38% |
| Basic Materials | -0.58% | -0.17% | -7.57% | -3.06% | +7.55% | +8.28% | +33.36% |
| Energy | -0.98% | -1.54% | -8.53% | -13.72% | +17.64% | +17.33% | +23.92% |
| Utilities | -1.38% | -1.72% | +2.61% | -2.62% | +4.46% | +4.84% | +11.47% |
| Industrials | -2.28% | +1.26% | +4.13% | +12.93% | +17.29% | +18.86% | +26.42% |
| Technology | -2.35% | +1.21% | -6.29% | +30.14% | +19.49% | +20.71% | +35.42% |
TOP MEGA-CAP MOVERS:
GAINERS
| Company | Ticker | Close | Change | Why It Moved |
|---|---|---|---|---|
| Meta Platforms Inc | META | $613.12 | +8.85% | Bloomberg reported Meta is building an external AI cloud business to sell compute and models to paying customers — directly monetizing $50B+ capex and challenging AWS, Azure, and Google Cloud |
| Palantir Technologies Inc | PLTR | $125.69 | +7.73% | AI/data platform rally on META cloud announcement; Palantir positioned as enterprise AI beneficiary of expanding cloud options and AI infrastructure buildout |
| Wells Fargo & Co | WFC | $85.94 | +3.99% | Passed 2026 Fed stress test; intends to raise Q3 dividend 11% to $0.50/share; Goldman Sachs added to US Conviction List with multiple analyst price target raises |
| Netflix Inc | NFLX | $74.19 | +3.91% | Communication Services sector surge lifted streaming names; Q2 consumer resilience narrative and AI content-generation tailwind |
| Palo Alto Networks Inc | PANW | $352.04 | +3.23% | Cybersecurity software bucked the broader tech selloff; AI-driven security demand tailwind; beneficiary of META cloud expansion increasing enterprise attack surface |
DECLINERS
| Company | Ticker | Close | Change | Why It Moved |
|---|---|---|---|---|
| KLA Corp | KLAC | $266.19 | -11.77% | Semiconductor equipment capex-slowdown concerns; chip fabricators reassessing spending plans; semi equipment sector in concentrated correction after extended Q2 run |
| Micron Technology Inc | MU | $1,032.28 | -10.57% | Memory chip demand weakness; DRAM/NAND pricing under persistent pressure; chip sector sell-off continuing post-Broadcom June guidance miss |
| Sandisk Corp | SNDK | $2,035.07 | -10.50% | NAND flash memory pricing under pressure; demand weakness in consumer electronics and data center storage; moving with Micron on sector-wide repricing |
| Applied Materials Inc | AMAT | $650.91 | -9.97% | Semiconductor deposition/etch equipment; chipmaker spending slowdown fears hit equipment suppliers disproportionately on order-reduction concerns |
| Lam Research Corp | LRCX | $391.26 | -9.71% | Etch and deposition equipment maker hit by same capex-slowdown concerns as KLAC and AMAT; semiconductor equipment sector in broad, concentrated correction |
— Institutional-grade intelligence for serious investors. Apply for membership at join.recessionalert.comC. HIGH-IMPACT STORIES -> TOP
BULLISH
1. Meta Platforms Plans Standalone AI Cloud Business to Sell Excess Compute — META +8.85%, Communication Services Tops All S&P 500 Sectors
The core facts:Bloomberg reported July 1 that Meta Platforms is developing a standalone cloud business to sell access to its AI computing power and models to external customers, directly challenging Amazon Web Services, Microsoft Azure, and Google Cloud. The service would allow enterprise developers to access Meta’s AI models — including Muse Spark — hosted on its infrastructure and pay for the compute required to run them. Meta is also considering selling raw AI computing capacity similar to neoclouds. Meta declined to comment and the plans remain in development. The market reaction was immediate and decisive: META surged 8.85% to a new high, adding approximately $130 billion in market capitalization in a single session. Communication Services was the day’s best-performing S&P 500 sector at +2.61%; Palantir gained 7.73% on enterprise AI beneficiary sentiment.
Why it matters:This announcement directly addresses the persistent investor critique of Meta’s $50B+ annual AI capex spend: that it was an unmonetized cost center with no clear revenue path beyond advertising. A cloud revenue stream would transform Meta’s AI infrastructure into a business unit that competes for the same enterprise AI services dollars as AWS, Azure, and Google Cloud — the three dominant players in a market growing at 30%+ annually. The strategic logic is sound: Meta has built one of the world’s most powerful compute clusters for its own AI training and inference, and monetizing excess capacity adds margin-accretive incremental revenue with minimal additional cost. For markets, the announcement reframes Meta from an AI capex risk to a potential AI cloud revenue story, compressing the valuation discount that had been applied to its infrastructure spending. The 8.85% single-session move on a $1.56 trillion market cap stock is a primary index driver, and Communication Services’ best-in-group session performance confirms the signal was read as broadly positive for platform AI monetization narratives.
What to watch:Meta’s formal confirmation of the cloud strategy in upcoming investor communications or Q2 earnings (expected late July) — unconfirmed Bloomberg reports carry higher reversal risk; AWS, Azure, and Google Cloud competitive pricing responses to a new $1.5T-market-cap entrant in enterprise AI services.
BEARISH
2. Global Semiconductor Selloff Triggers KOSPI Circuit Breaker — SK Hynix -12%, KLAC -12.3%, MU -10.57%, SOX -7% to Open Q3
The core facts:A coordinated global semiconductor selloff erupted July 1, beginning in Asia where SK Hynix and Samsung each fell more than 12%, triggering a 20-minute market-wide circuit breaker on the South Korean KOSPI. The selloff spread through Europe — ASML fell 5%, with Infineon, ASM International, and STMicroelectronics down 5-8% — before hitting US markets at open. The Philadelphia Semiconductor Index (SOX) opened down approximately 7%. US damage by close: KLAC -12.3%, MU -10.57%, SNDK -10.50%, AMAT -9.97%, LRCX -9.71%. Technology was the session’s worst S&P 500 sector at -2.35%, a sharp reversal for the sector that led the index with +39.24% in Q2. The proximate triggers: SK Hynix deliberately slowing its HBM4 production ramp to redirect capacity into conventional DRAM (where shortages have pushed margins above HBM levels); Meta’s AI cloud announcement raising fears of hyperscaler compute self-sufficiency reducing third-party demand; and profit-taking after the VanEck Semiconductor ETF gained 82% in H1 2026.
Why it matters:The semiconductor sector’s historic H1 outperformance rested on two consensus pillars: an AI capex supercycle sustaining unbounded chip demand and structural HBM/NAND scarcity maintaining pricing power. Both are now under pressure simultaneously. SK Hynix’s deliberate HBM4 ramp slowdown is a bearish demand signal from the supply side itself — the world’s leading HBM producer is signaling that conventional DRAM shortage premiums exceed HBM demand premiums at current pricing. Meta’s AI cloud announcement amplifies this: if the world’s third-largest compute buyer is now monetizing its own excess compute capacity, third-party GPU cloud providers and memory suppliers face structurally smaller addressable markets than the prior bull case assumed. The 82% H1 SOX gain had embedded the most optimistic demand scenario; a 7% single-day correction at the Q3 opening suggests the market is re-anchoring toward a more balanced supply-demand outlook. The global contagion — Asian circuit breakers, European cross-listing declines, US SOX -7% — confirms this is not a single-factor profit-take but a reassessment of the AI hardware demand thesis. NVDA’s relative outperformance (-3.6% vs -10-12% for memory names) may signal the market is differentiating between GPU demand (AI training, still strong) and memory demand (data center compute, now contested by Meta’s self-sufficiency narrative).
What to watch:SK Hynix’s conventional DRAM pricing updates and whether the HBM4 ramp resumes — a formal HBM4 demand reassessment would confirm the structural thesis; NVDA’s sustained relative strength as a market signal of GPU vs. memory demand differentiation; Thursday NFP weakness could amplify the selloff if growth concerns compound the supply-side story.
BEARISH
3. Warsh Makes Global Debut at ECB Sintra — “Prices Too High,” No July Guidance, No Forward Guidance Ever — 10Y +6 bps, Rate-Sensitive Sectors Hit
The core facts:Federal Reserve Chair Kevin Warsh made his first major international appearance at the ECB Forum in Sintra, Portugal on July 1, joining a panel with ECB President Christine Lagarde, Bank of England Governor Andrew Bailey, and Bank of Canada Governor Tiff Macklem. Warsh stated that “prices are too high” while also noting that inflation risks have come down. He explicitly declined to provide any signal about the July 16-17 FOMC meeting, consistent with his broader position that the Fed will abandon forward guidance in favor of real-time data dependence — a shift he described as taking 9-12 months to implement operationally. Warsh also announced five external task forces to reform Fed operations. Market reaction: the 10-year Treasury yield rose 6 basis points to 4.482%, bonds and stocks declined in tandem (no safe-haven bid), rate-sensitive sectors underperformed (Utilities -1.38%, Industrials -2.28%). Prediction market July FOMC hike odds remain elevated at approximately 54%. Seeking Alpha characterized the overall Fedspeak tone as “the most hawkish level since late 2023.”
Why it matters:Warsh’s Sintra debut is structurally significant on three dimensions. First, the elimination of forward guidance — announced before global central bank peers who universally practice some form of it — signals a fundamental restructuring of Fed-market communication. Without a dot-plot anchor or meeting-specific signals, every economic data print becomes a binary market event rather than an incremental update against a stated policy path. The result is structurally higher volatility in rates and rate-sensitive equities. Second, the “no guidance” stance with July hike odds at 54% means markets entered Q3 without a Fed backstop — the traditional “Fed put” for equities is explicitly unavailable under a data-dependent, no-guidance framework. Third, the international debut at Sintra signals Warsh is treating major global forums as primary communication platforms, elevating the future market-moving potential of Jackson Hole and similar events. The 10Y’s 6 basis point move (exceeding the HIGH IMPACT threshold of 5 bps) and the simultaneous decline in both bonds and stocks — the “no safe haven” pattern — confirms markets are processing the Warsh regime as a structurally more volatile, less backstopped environment than the Yellen-Powell era.
What to watch:July 16-17 FOMC meeting — 54% hike probability makes the outcome genuinely uncertain; Thursday July 2 NFP at 8:30 AM ET is the most likely data point to shift hike odds significantly before the Fed enters its blackout period; any FOMC member commentary in the pre-NFP window.
UNCERTAIN
4. ADP June Payrolls Miss at 98K — Softest Print Since Late 2025 Sets Thursday NFP as the Week’s Binary Risk Event
The core facts:ADP private payrolls for June came in at 98,000 — below the consensus of approximately 113,000 and materially softer than May’s 122,000. The 98K print is the softest ADP reading since late 2025 and the first below-100K reading in recent months. Hiring was concentrated in healthcare-related sectors; leisure and hospitality registered a sixth consecutive weak month. Market reaction was subdued ahead of Thursday’s official Bureau of Labor Statistics Nonfarm Payrolls report. Note: Section E covers the ADP data layer in full; this story addresses the market-impact and forward-implication angle.
Why it matters:The ADP miss creates a directional setup for Thursday’s NFP that is now skewed bearish for labor expectations. While ADP and NFP have historically low correlation, a sub-100K private payrolls print at minimum removes the upside surprise scenario and narrows the plausible NFP range toward the 75-110K band. For the Federal Reserve, the market-moving implication is asymmetric: a weak NFP (sub-75K) would collapse July FOMC hike odds from 54% toward near-zero, triggering a significant bond rally and equity re-rating as the rate path dramatically softens. Conversely, a strong NFP (above 130K) would validate Warsh’s “prices too high” framing and push July hike odds above 70%, extending the 10Y move from today. The ADP’s sub-100K print in the context of today’s GDPNow revision to 1.2% and yesterday’s Chicago PMI deceleration suggests the labor market soft-landing narrative entering Q3 has a narrower margin of error than at the start of Q2. For the Warsh Fed, a sub-75K NFP would create an explicit dual-mandate tension: inflation “too high” but employment cooling — forcing an unavoidable choice between tightening into a weakening labor market or conceding ground on inflation credibility.
What to watch:Thursday July 2 BLS Nonfarm Payrolls at 8:30 AM ET — sub-75K collapses July hike odds to near-zero; above 130K restores them to near-certainty. CME FedWatch July probability will reprice immediately at release.
BEARISH
5. Atlanta Fed GDPNow Slashes Q2 2026 Estimate From 2.5% to 1.2% — Largest Single-Day Revision in 2026, Stagflationary Setup Sharpens
The core facts:The Atlanta Federal Reserve’s GDPNow model for Q2 2026 real GDP growth was revised from 2.5% (as of June 25) to 1.2% on July 1 — a 1.3 percentage point single-day downward revision. Drivers: Q2 real gross private domestic investment growth fell from 8.5% to 6.5%, and the net exports contribution deteriorated from -0.59 percentage points to -1.62 percentage points. The revision incorporated today’s ISM Manufacturing PMI (53.3%, miss vs. 54.0% consensus), ADP payrolls (98K miss), and construction spending data. Note: Section E covers the GDPNow data layer; this story addresses the market-impact and forward-implication angle.
Why it matters:A 1.3 percentage point single-day GDPNow revision signals that the Q3 growth outlook is materially weaker than the market entered today assuming. The valuation premium that supported the S&P 500’s +14.9% Q2 was built on a 2.5%+ GDP growth baseline; repricing to 1.2% compresses the earnings growth justification for current multiples. More consequentially, the 1.2% GDPNow creates a stagflationary arithmetic problem for the Warsh Fed: inflation running at 4.1% headline PCE (Warsh: “prices are too high”), GDP tracking at 1.2%, and a 54% July hike probability. Historically, Fed tightening cycles launched into sub-2% GDP growth environments carry elevated recession risk — with the most famous example being the 2000 hiking cycle that preceded a 10-quarter growth slowdown. For rate-sensitive assets, the 2-year Treasury must now simultaneously price a possible July hike (hawkish short end) and sub-2% Q2 growth (dovish growth signal) — a compression of the yield curve that historically signals policy error risk. The primary investment risk for Q3 is not a binary growth-or-inflation outcome but a simultaneous deterioration in both: the ADP miss, GDPNow revision, and Warsh’s non-committal Sintra performance collectively raise the probability that the back half of 2026 features both slower growth and persistent inflation, leaving the Warsh Fed with no clean policy exit.
What to watch:Advance Q2 2026 GDP (BEA, expected late July) — whether official GDP confirms the 1.2% GDPNow trajectory or shows resilience from consumer spending; GDPNow’s next update incorporating Thursday’s NFP as the key Q2 data revision driver.
— Quantifying recession risk so you don’t have to guess. Apply for membership at join.recessionalert.comD. MODERATE-IMPACT STORIES -> TOP
BULLISH
6. WFC +3.99%: Goldman Adds Wells Fargo to Conviction List, 11% Dividend Raise — Financials Sector Second-Best as All 32 Banks Clear 2026 Stress Test
The core facts:Goldman Sachs added Wells Fargo (WFC) to its US Conviction List on July 1, with multiple analysts simultaneously raising price targets. WFC surged 3.99% — materially outperforming the Financial sector’s +1.61% gain, making Financials the session’s second-best performer behind Communication Services. The WFC-specific catalyst: Goldman’s Conviction List addition, the industry’s most notable high-conviction institutional endorsement, combined with WFC’s confirmed intention to raise its Q3 2026 dividend 11% to $0.50 per share from $0.45, subject to board approval. The backdrop: all 32 institutions tested in the Federal Reserve’s 2026 annual bank stress test maintained capital levels above regulatory minimums, with WFC’s Stress Capital Buffer holding at 2.5%. Other major banks including JPMorgan, Goldman Sachs, and Morgan Stanley also announced dividend increases following stress test clearance, though WFC’s Goldman upgrade was the session’s standout individual bank catalyst.
Why it matters:Goldman’s Conviction List is the firm’s highest-conviction, 12-month-horizon recommendation tier — an addition signals fundamental re-rating potential beyond the near-term stress test backdrop. WFC’s 3.99% outperformance against a 1.61% sector move confirms stock-specific catalyst strength. The 11% dividend raise (to $0.50) is accretive for income-oriented institutional holders and sends a capital strength signal. For the broader sector, all 32 banks clearing stress tests removes a systemic overhang and confirms the banking industry enters Q3 well-capitalized despite the Fed’s higher-for-longer rate environment. Financials’ second-best sector performance in a down tape further signals that institutional investors are rotating toward rate-sensitive financials as an inflation hedge — NIM expansion benefits accumulate as the Warsh Fed maintains elevated rates. WFC specifically carries idiosyncratic upside optionality: the OCC asset cap remains a headwind but its removal would be the next major catalyst for a WFC re-rating beyond the sector.
What to watch:WFC’s Fed asset cap removal timeline — any announcement would be the next material upside catalyst; Q2 2026 bank earnings starting ~July 11 for NIM trajectory and credit quality in the higher-for-longer rate environment; whether Goldman’s Conviction List thesis plays out ahead of or during Q2 reporting season.
BEARISH
7. Iran Refuses Scheduled Qatar Talks — WTI Falls 1.99% to $68.77, Lowest Since February, as Ceasefire Formalization Stalls
The core facts:Iran declined to meet US delegates for scheduled peace talks in Qatar on July 1, marking a deterioration from Tuesday’s structure where Iranian delegations at least participated separately at Doha. WTI crude fell 1.99% to $68.77 per barrel — the lowest level since late February 2026 — extending Q2’s dramatic unwinding of the Iran war risk premium. This occurred despite a bullish US Energy Information Administration weekly petroleum report showing a commercial crude inventory draw of 3.8 million barrels, a gasoline draw of 2.3 million barrels, and a distillate build of 2.5 million barrels for the week ended June 26. The ceasefire declared June 24 technically remains in force, but the absence of direct US-Iran diplomatic contact limits the pace of formal normalization.
Why it matters:Iran’s refusal of scheduled talks is a geopolitical setback that creates a “prolonged limbo” scenario: the ceasefire holds (no war premium) but formal normalization of Iranian crude exports is delayed (no peace dividend). The oil market’s reaction is telling — WTI fell 1.99% despite the EIA’s bullish 3.8M barrel draw. When a significant inventory draw fails to support prices, it signals demand-side pessimism is dominating the market narrative over short-term supply signals. JPMorgan and Citi’s structural 2026 oversupply thesis (~4M bbl/day surplus from Iranian normalization + OPEC+ capacity additions + demand softening) is asserting itself as the base case, capping oil’s recovery potential even as diplomatic uncertainty adds tail risk. For energy equities, the current environment is structurally challenging: Iran risk is no longer adding a price premium, but Iranian supply normalization is also not providing the supply relief that would formally confirm the oversupply thesis. The sector is range-bound between $67-72 WTI with no clear directional catalyst until either a diplomatic breakthrough or a demand data point (Thursday’s NFP, next month’s China PMI) resolves the narrative.
What to watch:Next scheduled US-Iran diplomatic engagement — whether Qatar reschedules talks or a different interlocutor (Pakistan) facilitates direct contact; WTI technical support at $67 as the February 2026 low; OPEC+ compliance with the July 188 kbpd incremental production increase.
UNCERTAIN
8. ISM Manufacturing Prices Paid Plunges 9.1 Points to 73.0 — Largest Monthly Drop Since July 2022, Challenging Fed’s Inflation-Too-High Narrative
The core facts:The ISM Manufacturing Prices Paid sub-index for June plunged 9.1 percentage points to 73.0, against a consensus of 79.0 and a prior reading of 82.1 — the largest single-month decline since July 2022. The ISM Manufacturing PMI headline for June was 53.3%, slightly below the 54.0% consensus and 0.7 points lower than May’s 54.0%, but the overall index remains in expansion for the 20th consecutive month. New Orders stayed firm at 56.0% (sixth straight month of expansion). Note: Section E covers the ISM data layer; this story addresses the market-impact and forward-implication angle.
Why it matters:The 9.1-point Prices Paid collapse to 73.0 is the clearest single-data disinflationary signal of July 1, directly challenging Warsh’s Sintra statement that “prices are too high.” While 73.0 remains elevated (above 50 signals prices still rising), the rate of deceleration is the most aggressive since mid-2022 — when the Fed’s initial rate hiking cycle began to bite into goods-sector inflation. Two interpretations compete: bullish (tariff-driven input cost pass-through is peaking, creating a durable disinflationary tailwind that makes July’s hike case weaker), or uncertain (the deceleration reflects demand destruction — manufacturers sourcing less because forward orders are weakening, consistent with today’s ADP miss and GDPNow revision). For sector implications, industrials and consumer staples companies with high input cost sensitivity stand to benefit from margin recovery if Prices Paid continues trending toward 65; materials exporters face a mixed signal (lower input costs, but potentially weaker demand-side pricing power). For the Fed, a Prices Paid trajectory below 70 in August would provide cover for a September hold even if June NFP surprises to the upside Thursday.
What to watch:August 1 ISM Manufacturing Prices Paid — a second consecutive drop below 75 would confirm a durable disinflationary trend; July PPI release for factory-gate price confirmation that the ISM Prices Paid signal is translating to actual producer prices.
UNCERTAIN
9. EIA Confirms 3.8M-Barrel Crude Draw — But Structural Oversupply Dominates as WTI Still Falls to New 2026 Low Despite Bullish Inventory
The core facts:The US Energy Information Administration’s weekly petroleum status report (week ended June 26) showed: commercial crude oil inventories drew 3.8 million barrels; gasoline inventories drew 2.3 million barrels; distillate inventories built 2.5 million barrels. The crude draw broadly confirmed the direction (if not the magnitude) of the American Petroleum Institute’s prior-session report which showed a 6.072 million barrel draw. Despite the bullish inventory signal, WTI crude fell 1.99% on the session to $68.77 per barrel — its lowest close since late February 2026.
Why it matters:The 3.8M barrel crude draw is the second consecutive week of significant inventory reduction — in a balanced market, that sequential draw pattern would support prices. WTI’s continued decline despite the draw reveals that the structural narrative (JPMorgan/Citi ~4M bbl/day 2026 surplus from Iranian normalization + OPEC+ additions + slowing demand) is dominating over weekly inventory snapshots. For energy equity investors, the EIA data provides two actionable signals at the sector level: (1) the 2.3M gasoline draw is constructive for refining crack spreads — refiners (VLO, MPC, PSX) may see margin support; (2) the 2.5M distillate build is a soft signal for industrial demand, consistent with today’s ADP miss and GDPNow revision and reinforcing the demand-weakness narrative for energy. The key behavioral insight: when multiple consecutive bullish inventory draws fail to prevent price declines, it signals that supply-side data has lost its near-term price-setting power and forward-looking demand expectations are the primary determinant of oil’s direction.
What to watch:Next week’s EIA petroleum status report (July 8) for continuation or reversal of the crude draw pattern; refining crack spreads as the near-term energy sector beneficiary signal from the gasoline draw; OPEC+ July 188 kbpd production addition and whether member compliance narrows before next month’s ministerial.
BEARISH
10. Sen. Warren Demands Fed IG Probe of VP Bowman Over BofA Dinner During Post-FOMC Blackout Period
The core facts:Senator Elizabeth Warren (D-MA) formally requested the Federal Reserve Inspector General to investigate Vice Chair for Supervision Michelle Bowman over her attendance at a private Bank of America dinner held during the Fed’s post-meeting blackout period — the window following an FOMC decision during which Fed officials are barred from making public policy statements or engaging in activities that could create appearance conflicts. Warren’s letter alleged the attendance raised concerns about central bank independence and regulatory capture of the nation’s top bank supervisor. Bank of America shares rose 2.42% on the session. Bowman is a voting FOMC member who has consistently taken a hawkish position on rates and favors less bank regulation than the previous supervisory framework.
Why it matters:The Bowman allegation arrives at a specifically sensitive moment for the Fed independence narrative. The Supreme Court’s June 29 ruling preserving Fed independence was identified as a primary catalyst for Q2’s equity records — any credibility event that reopens that narrative, even a contested allegation, could incrementally unwind the valuation premium that ruling established. Two specific risks: (1) If the IG investigation expands or produces findings, it adds an institutional drag on the Fed’s decision-making credibility at a moment when the Warsh Fed is already navigating a hawkish pivot without the traditional communication tools; (2) Bowman’s specific role as Vice Chair for Supervision creates a conflict-of-interest dimension — she is the Fed’s top bank regulator, and a dinner with the institution she supervises during a blackout period raises questions about the supervisory firewall. Practically, Warren’s IG letters historically generate institutional responses rather than disciplinary outcomes. But the symbolism is durable: a Senator challenging the integrity of a voting FOMC member compounds the governance-uncertainty backdrop at a moment when the Fed’s credibility is already being tested by the transition to a no-guidance, data-dependent framework.
What to watch:Fed Inspector General’s response and whether a formal investigation is opened; any Fed Board public statement defending Bowman’s attendance; further congressional scrutiny of Fed governance in the context of the Warsh-led restructuring.
— Separating signal from noise since 2007. Apply for membership at join.recessionalert.comE. ECONOMY WATCH -> TOP
ADP private payrolls printed at 98K in June — well below the 113K consensus — as the Atlanta Fed’s GDPNow collapsed 1.3 points to 1.2% in a single session, absorbing the soft labor, ISM, and construction data simultaneously. The ISM headline missed at 53.3 (vs. 54 expected), but the real signal was Prices Paid plunging to 73.0 from 82.1 — the steepest single-month drop since July 2022, suggesting tariff front-loading may have peaked. Chair Warsh reinforced a hawkish holding pattern at the ECB Forum, declaring inflation “too high” and declining any forward guidance just 24 hours before June payrolls. Goldman cut its 12-month recession probability to 15%, but the growth picture is clearly deteriorating; all eyes now pivot to Thursday’s NFP (consensus 110K).
ADP Private Payrolls Miss by 15,000 in June as Hiring Momentum Fades (ADP, July 1, 2026)
What they’re saying:The U.S. private sector added 98,000 jobs in June, missing the 113,000 consensus by 15,000 and falling below May’s 122,000 — the softest ADP print since late 2025. Education and health services led gains at 48,000 new positions, while leisure and hospitality recorded its sixth consecutive month of subpar hiring. The report precedes Thursday’s BLS nonfarm payrolls, which carries a 110,000 consensus.
The context:ADP’s miss was broad-based, suggesting labor market deceleration has moved beyond a few weak sectors. The print sent Treasury yields lower and gold higher as traders priced in a more cautious Fed path. While ADP historically diverges from BLS payrolls, the softness reinforces the Conference Board’s “jobs hard to get” measure — which hit a five-year high in June — making Thursday’s NFP the week’s critical binary risk event.
What to watch:BLS Nonfarm Payrolls for June, Thursday July 2 at 8:30 AM ET (consensus 110K, Pantheon 75K, prior 172K); Unemployment Rate (consensus 4.3%, prior 4.3%).
Atlanta Fed GDPNow Collapses to 1.2% from 2.5% as ADP, ISM, and Construction Data Hit (Federal Reserve Bank of Atlanta, July 1, 2026)
What they’re saying:The Atlanta Fed’s GDPNow model cut its Q2 2026 real GDP growth estimate to 1.2% (annualized) on July 1 from 2.5% on June 25 — a 1.3 percentage point single-session revision. The private investment nowcast fell from 8.5% to 6.5%, and the net exports contribution dropped from -0.59 to -1.62 percentage points, after absorbing today’s ADP miss, ISM PMI miss, and construction spending shortfall.
The context:At 1.2%, GDPNow sits well below the Bloomberg consensus of ~2.0% for Q2 and signals an economy decelerating sharply from Q1’s pace. The model has historically been a reliable leading indicator for the BEA’s advance GDP estimate. A sub-1.5% GDPNow heading into Thursday’s payrolls will intensify investor debate over whether the Fed’s hold is sustainable or whether the data is building the case for an easing pivot.
What to watch:BEA advance Q2 2026 GDP estimate (due late July); Thursday’s NFP as a further GDPNow model input.
Warsh Declines Forward Guidance at ECB Forum, Declares Inflation “Too High” and Vows Data-Driven Overhaul (Federal Reserve / CNBC, July 1, 2026)
What they’re saying:Fed Chair Kevin Warsh, speaking at the ECB Forum on Central Banking in Sintra, declined any forward guidance on the July rate decision, calling it part of “charting a new course.” He declared inflation “too high” and said the Fed will shift to real-time data tools and new technologies over the next 9–12 months. Warsh unveiled five external task forces to reform Fed practices and appointed a former Bank of England chief to lead a new communications task force.
The context:The speech is the most substantive policy signal Warsh has delivered since taking the chair role and reinforces a hawkish holding pattern even as the real-time growth picture deteriorates. Declining to signal July leaves the meeting live — markets price a ~54% probability of a 2026 rate hike. Seeking Alpha’s “Fedspeak hits most hawkish level since late 2023” captures the broader FOMC tone. Warsh’s data-reform ambition is structural: a shift away from conventional government statistics could materially alter how the Fed communicates and reacts to incoming data.
What to watch:July 16–17 FOMC meeting — no rate change expected but statement language will be closely scrutinized; ISM Services PMI (Thursday) as the next major macro input.
ISM Manufacturing PMI Slips to 53.3 in June as Prices Paid Posts Largest Monthly Drop Since July 2022 (ISM, July 1, 2026)
What they’re saying:The ISM Manufacturing PMI came in at 53.3 for June, below the 54.0 consensus and down from 54.0 in May — the sector’s 20th consecutive month of expansion. Within the report, the Prices Paid sub-index plunged 9.1 points to 73.0 (vs. 79.0 expected), the largest single-month decline since July 2022. New Orders eased to 56.0 from 56.8, and the Employment index ticked up to 49.7 from 48.6, remaining in contraction.
The context:The headline miss is modest — ISM’s 53.3 maps to roughly 2% annualized GDP growth and marks the 20th straight expansion month. The Prices Paid collapse is the more significant signal: tariff-driven input cost pressures that have dominated manufacturing surveys since late 2025 appear to be cresting. Whether this reflects genuine supply-side cooling or demand destruction (buyers cutting orders to reduce cost exposure) remains unclear. For the Fed, a sustained decline in Prices Paid would undercut the “inflation too high” rationale for further hikes — directly in tension with Warsh’s ECB Forum remarks.
What to watch:ISM Services PMI for June (Thursday July 3); further Prices Paid readings in Q3 to confirm whether the tariff-cost peak is genuine.
Goldman Sachs Cuts 12-Month U.S. Recession Probability to 15% as Iran-U.S. Peace Deal Reduces Energy Risk (Goldman Sachs, July 1, 2026)
What they’re saying:Goldman Sachs chief economist Jan Hatzius lowered the bank’s 12-month U.S. recession probability from 25% to 15%, citing the U.S.-Iran peace agreement’s effect on energy prices. Goldman’s commodities strategists see Brent crude settling near $80/barrel by year-end 2026, removing a key downside risk to consumer spending and corporate margins. The bank characterized geopolitical de-escalation combined with a robust labor market as meaningfully improving the near-term growth outlook.
The context:Goldman’s cut re-rates from its March 2026 peak of 30% (raised on oil-spike fears), but arrives on the same day GDPNow collapsed to 1.2% — a stark contrast between institutional model outputs. JPMorgan remains at 35% and Moody’s Analytics at 49%, reflecting a methodological split: Goldman weights geopolitical resolution and financial conditions; real-time flow models weight the deteriorating data. For PM decision-making, the near-term GDPNow signal likely carries more operational weight than a 12-month probability model.
What to watch:Thursday’s NFP — a sub-100K print would stress the Goldman narrative; above 150K would validate it. Brent crude trajectory through Q3 as the key Goldman model input.
Challenger Reports June Layoffs Plunge 53% from May to 45,849 — Lowest Since December 2025 as AI Leads Reduction Reasons (Challenger, Gray & Christmas, July 1, 2026)
What they’re saying:U.S. employers announced 45,849 job cuts in June, down 53% from May’s 97,006 and 4% below June 2025’s level of 47,999 — the lowest monthly total since December 2025. Through H1 2026, planned cuts total 443,604, down 40% from H1 2025’s 744,308. Artificial intelligence was cited as the primary reason for workforce reductions for the fourth consecutive month, led by the technology sector (15,503 cuts in June).
The context:May’s spike was likely elevated by government-related workforce actions and cyclical volatility — June’s normalization suggests those one-off factors have unwound. The 40% H1 improvement in announced layoffs is a constructive signal for the labor market heading into Thursday’s NFP, partially offsetting the ADP miss. However, AI as the persistent leading reason for cuts creates a structural undercurrent: AI-driven displacement tends to be permanent and concentrated in knowledge-worker roles that do not surface cleanly in aggregate payroll counts.
What to watch:Thursday’s June nonfarm payrolls (consensus 110K, prior 172K) and unemployment rate (consensus 4.3%) — the primary validation of whether Challenger’s improvement is reading through to net job creation.
— Know the probability before the market prices in the risk. Apply for membership at join.recessionalert.comF. EARNINGS WATCH -> TOP
YESTERDAY AFTER THE BELL (Markets Reacted Today)
No major earnings yesterday after the bell from companies with >$100B market cap.
TODAY BEFORE THE BELL (Markets Already Reacted)
No major earnings before the bell from companies with >$100B market cap. Notable BMO reporters today (all below threshold): General Mills (GIS, $20.2B), FactSet Research Systems (FDS, $9.0B), MSC Industrial Direct (MSM, $6.9B).
TODAY AFTER THE BELL (Markets React Tomorrow)
No major earnings after the bell from companies with >$100B market cap.
WEEK AHEAD PREVIEW:
Q1 2026 earnings season is nearing completion at 89% reported, with the final stragglers predominantly smaller-cap names. No mega-cap (>$100B market cap) reporters are scheduled for the remainder of this holiday-shortened week.
Thursday, July 2: Lindsay Corp (LNN, $1.26B) — BMO; below the $100B threshold. No qualifying mega-cap reporters.
Friday, July 3: NYSE closed — Independence Day observed. No trading.
Q2 2026 earnings season is expected to open around July 11, 2026, with major banks (JPMorgan, Wells Fargo, Citigroup) typically reporting in the first wave. Watch for Q2 guidance updates that incorporate the ADP miss, GDPNow deceleration, and tariff/USMCA uncertainty for the first institutional read on H2 2026 corporate confidence.
— US market commentary trusted by family offices and institutions. Apply for membership at join.recessionalert.comG. WHAT’S NEXT -> TOP
UPCOMING RELEASES:
| Date | Event | Why It Matters |
|---|---|---|
| Thu, Jul 2 | Nonfarm Payrolls — June (expected 110K, prior 172K) | The week’s binary risk event. ADP’s 98K miss and GDPNow’s collapse to 1.2% set a bearish frame: a sub-75K print would collapse July FOMC hike odds from 54% toward zero and trigger a significant bond rally; above 130K would validate Warsh’s “prices too high” stance and push hike odds toward near-certainty. Sub-100K likely locks in a September hold discussion. |
| Thu, Jul 2 | Unemployment Rate — June (expected 4.3%, prior 4.3%) | A tick up to 4.4% alongside weak payrolls would sharpen the dual-mandate tension for the Warsh Fed: explicit inflation concern vs. cooling labor market. Sahm Rule watch: a 0.2-point rise from the cycle trough would approach the 0.5-point threshold that has historically signaled recession onset. |
| Thu, Jul 2 | Average Hourly Earnings MoM/YoY — June (MoM expected +0.3%, prior +0.3%; YoY expected +3.5%, prior +3.4%) | Wage data provides the secondary inflation signal after payrolls. A YoY acceleration above +3.6% alongside weak headline payrolls would create the stagflationary wage-price tension the Warsh Fed most fears — warm wages, cooling hiring, no guidance cover. A deceleration below +3.3% would strengthen the case for a hold. |
| Thu, Jul 2 | Initial Jobless Claims — week ended Jun 27 (expected 220K, prior 215K) | A simultaneous leading labor indicator alongside NFP. Claims above 230K would reinforce the ADP miss signal and flag that the labor market deterioration is faster than the lagging headline payroll count reflects. Markets will cross-reference claims with the payrolls print to assess momentum. |
| Fri, Jul 3 | Independence Day Observed — NYSE Holiday (no trading) | Markets close Friday. Any NFP-driven repricing Thursday trades into a long weekend with no Friday safety valve. Positions established on Thursday’s NFP reaction carry over to Monday July 6 — amplifying the binary nature of Thursday’s release for short-term positioning. |
KEY QUESTIONS:
1. Will Thursday’s NFP confirm the ADP miss signal — and does a sub-75K print collapse July FOMC hike odds from 54% toward zero, marking the pivotal Q3 rate inflection point heading into a long weekend with no Friday trading to absorb the move?
2. Does META’s AI cloud announcement represent a structural inflection in hyperscaler compute self-sufficiency — and will Q2 earnings commentary from AWS, Azure, and Google Cloud (expected mid-to-late July) confirm demand erosion from large hyperscalers going self-sufficient on AI compute?
3. Will the ISM Prices Paid collapse (9.1 pts to 73.0, largest drop since July 2022) prove to be genuine disinflation or demand destruction — and can the Warsh Fed maintain its “inflation too high” rationale if August and September Prices Paid readings confirm a sustained deceleration below 70?
— US market commentary trusted by family offices and institutions. Apply for membership at join.recessionalert.comH. CHART OF THE DAY -> TOP
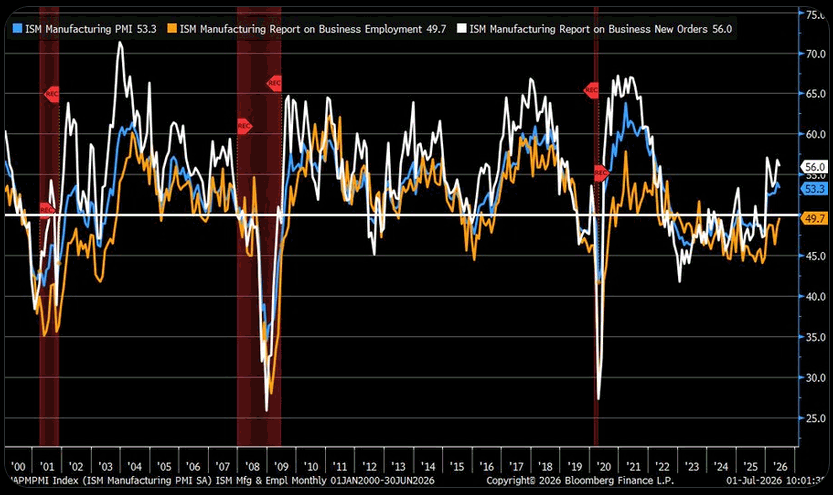
Employment is the recovery’s last unconvinced witness — the line that still won’t sign. Every deep manufacturing contraction on this chart was buried inside a recession: 2001, 2008-09, 2020, each troughed under a red bar. The 2023-2025 stretch broke that rule — 33 straight months of factory-payroll contraction, 41 of the last 42 since January 2023, the longest labor weakness here, and no recession bar covers it. Services and the consumer carried the load the factory floor dropped; this was a rolling sector recession the economy walked through, not into. Now the whole complex is inflecting, and the holdout is finally healing: Employment claws 1.1 points to 49.7, and the panel’s hiring-to-cutting comment ratio has near-reversed to 1.8:1 from 1:2 a year ago. The mechanism explains the lag. Firms met returning orders headcount-light — automation, productivity, post-2021 caution — while Prices at 73.0, propped by Section 232 tariffs and the Iran-war oil spike, froze the marginal hire; at 49.7, Employment still sits below the ~50.3 that maps to rising BLS payrolls, so mills shed workers, just slower. The forward risk is that the lead is already cresting: New Orders slipped -0.8 to 56.0, export orders back in contraction at 48.5. Anyone still short the goods cycle is positioned for a bottom that already passed.
Market Intelligence Brief (MIB) Ver. 18.40
For professional investors only. Not investment advice.
© 2026 RecessionALERT.com

Comments are closed.