
Intel landed Google’s 3M+ TPU order and NVIDIA 18A foundry trials Monday, validating its three-year transformation and sending INTC +11%, MU +10%, KLAC/AMAT +9%. Apple reversed a 52-week intraday high to close -1.87% after WWDC revealed Siri AI as a Google Gemini reskin. Wednesday’s May CPI (headline YoY exp. 4.2%) is the last major datapoint before Warsh’s debut FOMC; Israel-Iran re-escalation and WTI near $94 add a stagflationary dimension. Corning (GLW +5.55%) secured Amazon’s AI fiber buildout.
TABLE OF CONTENTS
A. EXECUTIVE SUMMARY
B. MARKET DATA
C. HIGH-IMPACT STORIES (5)
D. MODERATE-IMPACT STORIES (5)
E. ECONOMY WATCH (5)
F. EARNINGS WATCH (0)
G. WHAT’S NEXT
H. CHART OF THE DAY
A. EXECUTIVE SUMMARY -> TOP
Monday’s semiconductor sweep — Intel foundry validation via Google’s 3M+ TPU order and NVIDIA 18A trials — powered the Nasdaq +1.58% and SOX +5.99%, but 8 of 11 sectors closed red, confirming this was an AI-hardware trade, not a broad market rally. The bond market’s non-participation is the critical signal: the 10-year yield rose 2.6 bps to 4.567% alongside the equity gain, pricing AI capex enthusiasm as inflationary rather than endorsing the recovery. This week’s stakes are acute: Wednesday’s May CPI (headline YoY exp. 4.2% vs. 3.8% prior) and the June 16–17 FOMC arrive against Israel-Iran re-escalation that pushed WTI to $93–94 intraday before settling at $91.25 — a stagflationary headwind entering Warsh’s debut meeting. Technology’s bifurcation — +1.67% today vs. ‑5.81% on the week — illustrates the market’s condition precisely: a concentrated AI-infrastructure trade inside a broader environment of yield pressure, geopolitical risk, and record consumer stress.
• INTC +11.11% on Google’s 3M+ TPU manufacturing order and NVIDIA 18A foundry trials — Intel Foundry Services validation three years in the making; KLA +9.21%, AMAT +8.61%, MU +9.87% swept higher with it.
• AAPL ‑1.87% after WWDC 2026 revealed Siri AI as a Google Gemini partnership — intraday 52-week high reversed on a “sell on news” move as Apple concedes it cannot build frontier AI internally at the required pace.
• Israel-Iran re-escalation: missiles exchanged overnight, Mahshahr petrochemical complex struck; WTI hit $93–94 intraday before settling at $91.25 with OPEC+ adding 188K bpd for July — oil above $91 sustains the headline CPI overshoot into FOMC week.
• NY Fed May survey: 1-year inflation expectations eased to 3.5%, but perceived job loss probability hit a 6-month high (15.1%) and financial pessimism is the worst since July 2022 — sharpens Warsh’s debut FOMC dilemma ahead of Wednesday’s CPI.
• MRVL +9.34% as Marvell Technology joins the S&P 500 on June 22 — forced passive buying across all index funds and ETFs at ~$247B market cap; AI semiconductor cohort reshaping index composition.
• Corning (GLW +5.55%) secured a multibillion-dollar Amazon AI fiber supply agreement — its third major hyperscaler contract of 2026 (after Meta $6B and NVIDIA), confirming optical fiber as a strategic AI buildout bottleneck.
1. The AI Capex Cycle Is Structural, Not Speculative — Intel’s simultaneous Google TPU order and NVIDIA 18A trials are the strongest commercial validation of the AI infrastructure buildout to date. When the two most important AI hardware customers commit to Intel’s foundry roadmap, and Corning locks in Amazon, Meta, and NVIDIA for optical fiber, the picks-and-shovels layer is pricing multi-year capital deployment. Citigroup’s S&P 500 target upgrade to 8,100 (EPS $350/2026, $400/2027) makes the earnings-not-multiples bull case explicit — AI capex pays through to corporate profitability within 12–18 months.
2. The FOMC Week Is a Stagflationary Trap — Warsh enters his debut rate decision against simultaneous pressure from all directions: a 172K NFP blowout, WTI near $94 on Israel-Iran escalation, Wednesday’s CPI expected to show headline YoY accelerating to 4.2%, and a NY Fed consumer survey where wage satisfaction and job security hit record lows. Markets have resolved this as “skip now, decide later” (95%+ hold probability for June), but rate hike probability for 2H 2026 now exceeds 55%. Wednesday’s CPI print is the single most important number of the week.
3. Index-Level AI Concentration Is a Double-Edged Position — Monday’s 8-of-11 red sectors on an S&P +0.30% day shows AI hardware concentration providing a floor for indices without generating breadth. Apple’s WWDC reversal from a 52-week high on AI disappointment, GoHealth’s Chapter 11 signaling Medicare Advantage structural stress, and bond yields refusing to confirm the equity rally all underscore the same vulnerability: the AI premium requires continuous validation, and any narrative wobble — a missed foundry order, a hot CPI, a ceasefire repricing oil — carries asymmetric downside against a narrow breadth base.
B. MARKET DATA -> TOP
A sharp semiconductor rebound — driven by Intel’s blockbuster foundry wins (Google TPU order, NVIDIA 18A process trials) and broad AI capex enthusiasm — powered the Nasdaq +1.58% while the Dow declined -0.16%, the starkest index bifurcation of the week. Only 3 of 11 sectors closed positive: Technology reversed its worst weekly slump (-5.81%) to lead all sectors today (+1.67%), but Apple, Alphabet, and Palo Alto Networks all declined as capital rotated into hardware names. Rate-sensitive sectors absorbed yield pressure as the 10-year rose 2.6 bps to 4.567%, pushing Real Estate -1.30% and Utilities -1.70%. Eight of 11 sectors red on an S&P +0.30% day is a breadth warning signal a portfolio manager should track — this was an AI-hardware trade, not a broad risk rally.
CLOSING PRICES – Monday, June 8, 2026:
MAJOR INDICES
The Nasdaq (+1.58%) and Russell 2000 (+0.83%) rebounded from Friday’s selloff, but the Dow (-0.16%) sat out the rally — its lack of semiconductor weighting means the AI hardware trade passed it by entirely. Dow Theory bull confirmation extends to a third consecutive session: the DJ Transportation Average posted a new 10-session high today (22,133 vs. prior high of 21,914 on June 5), and the DJIA remained within 1.5% of its 10-session high — both averages confirming underlying trend strength despite Friday’s disruption. The NYSE Composite’s marginal -0.14% decline confirms the narrowness: beneath the Nasdaq headline, the broad market was flat-to-negative.
| Index | Close | Change | %Move | Why It Moved |
|---|---|---|---|---|
| S&P 500 | 7,405.62 | +21.88 | +0.30% | Narrow semiconductor rally; Nasdaq’s AI capex surge offset Dow weakness; 8 of 11 sectors declined |
| Dow Jones | 50,785.52 | -81.26 | -0.16% | No semiconductor weighting; Apple (-1.87%) and UnitedHealth dragged; blue-chip composition missed AI hardware trade |
| DJ Transportation | 22,132.9 | +219.3 | +1.00% | Cautious Middle East de-escalation reduced geopolitical risk premium on global trade; posted new 10-session high |
| Nasdaq 100 | 29,414.26 | +456.66 | +1.58% | Semiconductor sweep: INTC +11%, MU +10%, MRVL/KLAC/AMAT ~9%; Intel foundry wins + AI capex cycle enthusiasm |
| Russell 2000 | 2,856.98 | +23.48 | +0.83% | Small-cap recovery from Friday’s broad selloff; domestic focus insulates from geopolitical trade risk |
| NYSE Composite | 23,224.20 | -32.30 | -0.14% | Broad market was net negative; Nasdaq headline masked widespread sector weakness in broader NYSE universe |
VOLATILITY & TREASURIES
VIX dropped 12% to 18.92 on Monday’s semiconductor rebound, but still sits well above last week’s 15-16 range — Friday’s fear spike has not fully resolved. More revealing: the 10-year yield rose 2.6 bps to 4.567% while equities rallied, a bond non-participation signal indicating the market is pricing AI-capex enthusiasm rather than a broad macro-risk repricing. The 2Y barely moved (+0.2 bps to 4.164%), producing minimal curve steepening — the bond market is declining to endorse the equity bounce, which is the most cautionary signal in today’s fixed-income tape.
| Instrument | Level | Change | Why It Moved |
|---|---|---|---|
| VIX | 18.92 | -2.59 (-12.04%) | Semiconductor rebound reduced near-term fear; partial reversal of Friday’s spike from ~15 to 21.57; elevated vs. prior-week levels |
| 10-Year Treasury Yield | 4.567% | +2.6 bps | Bond market not confirming equity rally; AI capex optimism interpreted as inflationary/growth-positive rather than macro-risk relief |
| 2-Year Treasury Yield | 4.164% | +0.2 bps | Near-stable; minimal rate-path repricing; market holding near-term Fed outlook steady |
| US Dollar Index (DXY) | 100.02 | -0.05 (-0.05%) | Essentially flat; no safe-haven demand or meaningful risk-on currency move; Middle East de-escalation kept dollar anchored |
COMMODITIES
Gold’s -0.32% slip confirms reduced safe-haven demand as semiconductor optimism lifted sentiment, while platinum’s -2.33% decline reflects continued weakness in auto/industrial demand — a divergence worth tracking as industrial metals and precious metals send competing signals. Copper’s +0.77% gain counters platinum’s decline, suggesting AI infrastructure buildout is supporting industrial metals demand even as traditional manufacturing signals remain soft. Bitcoin’s +2.16% moved in line with the risk-on equity tape — tracking semis, not leading them.
| Asset | Price | Change | %Move | Why It Moved |
|---|---|---|---|---|
| Gold | $4,351.22/oz | -$14.08 | -0.32% | Risk-on tone reduced safe-haven bid; Middle East de-escalation eased geopolitical premium |
| Silver | $68.245/oz | -$0.858 | -1.24% | Followed gold lower; industrial demand signals mixed; underperformed copper suggesting selective industrial demand |
| Copper | $6.3328/lb | +$0.0483 | +0.77% | AI data center and infrastructure buildout supporting copper demand; diverged from silver/platinum complex |
| Platinum | $1,756.05/oz | -$41.85 | -2.33% | Auto/industrial demand weakness; no safe-haven or EV-catalyst support; worst performer in metals complex today |
| Bitcoin | $63,313 | +$1,339 | +2.16% | Tracking equity risk-on sentiment; no standalone crypto catalyst identified; move consistent with semiconductor-led market tone |
ENERGY
WTI and Brent rose in near-lockstep (+0.78%/+1.17%) alongside equity gains — a demand/growth signal, not a supply shock; rising oil with rising stocks is the bullish macro read. Henry Hub natural gas’s -2.91% decline fully decoupled from crude, confirming the oil move is geopolitically driven (Middle East de-escalation removing a downside floor) while gas trades on domestic storage dynamics. No WTI/Brent spread widening of note — disruption characterization remains global rather than regional.
| Asset | Price | Change | %Move | Why It Moved |
|---|---|---|---|---|
| Crude Oil (WTI) | $91.25/bbl | +$0.71 | +0.78% | Cautious Middle East de-escalation eased supply-disruption risk premium; demand-side growth optimism from semiconductor AI rally |
| Crude Oil (Brent) | $94.18/bbl | +$1.09 | +1.17% | Geopolitical risk premium partially intact; Brent outperformed WTI modestly on international supply uncertainty |
| Natural Gas (Henry Hub) | $3.135/MMBtu | -$0.094 | -2.91% | Domestic storage dynamics drove decline; fully decoupled from crude rally; no weather or LNG export catalyst |
| Natural Gas (Dutch TTF) | $16.39/MMBtu | -$0.07 | -0.43% | European gas prices modestly lower; mild divergence from crude; no significant LNG or storage event |
S&P 500 SECTORS
Technology’s +1.67% rebound today directly contradicts its -5.81% 1-week decline — the sharpest multi-horizon divergence in the table, driven entirely by semiconductor hardware rather than broad tech recovery (Communication Services -0.91% today, -6.56% 1-month). Rate-sensitive Real Estate and Utilities led losses as the 10Y yield climbed, connecting today’s sector dispersion directly to the treasury read: rising yields are capping recovery in interest-rate-sensitive names while AI hardware benefits from the same capex enthusiasm that keeps rates elevated.
| Sector | 1-Day | 1-Week | 1-Month | 3-Month | 6-Month | YTD | 12-Month |
|---|---|---|---|---|---|---|---|
| Technology | +1.67% | -5.81% | +6.15% | +24.95% | +19.82% | +21.63% | +46.33% |
| Energy | +0.94% | +0.90% | +1.51% | +3.81% | +25.95% | +29.43% | +41.68% |
| Consumer Cyclical | +0.49% | -3.09% | -5.01% | +1.15% | -4.91% | -4.79% | +7.92% |
| Consumer Defensive | -0.18% | +1.69% | -2.71% | -3.16% | +5.34% | +6.31% | +3.33% |
| Industrials | -0.21% | +0.14% | -0.08% | +3.07% | +14.56% | +14.27% | +25.66% |
| Financial | -0.34% | +0.60% | +0.63% | +4.71% | -0.01% | -2.27% | +10.31% |
| Healthcare | -0.51% | +1.81% | +2.88% | -1.63% | -1.67% | -1.93% | +13.99% |
| Basic Materials | -0.67% | -5.89% | -5.26% | -4.45% | +14.13% | +10.22% | +35.61% |
| Communication Services | -0.91% | -3.58% | -6.56% | +3.67% | +1.03% | +1.94% | +26.97% |
| Real Estate | -1.30% | +1.23% | -1.25% | +1.70% | +5.40% | +7.30% | +6.08% |
| Utilities | -1.70% | +0.05% | -4.97% | -6.54% | -0.19% | +2.21% | +11.28% |
TOP MEGA-CAP MOVERS:
GAINERS
| Company | Ticker | Close | Change | Why It Moved |
|---|---|---|---|---|
| Intel Corp | INTC | $110.18 | +11.11% | Google placed firm order for 3M+ TPUs to be manufactured on Intel’s foundry in 2028; NVIDIA running early trials on Intel’s 18A process for next-gen Feynman GPU; Wells Fargo and Barclays raised price targets to triple-digits |
| Micron Technology | MU | $949.28 | +9.87% | Semiconductor sector rebound from Friday’s sharp selloff; AI memory demand narrative strengthened by Intel foundry news; HBM capacity expansion tailwind |
| Marvell Technology | MRVL | $288.09 | +9.34% | Semiconductor rebound; custom AI ASIC chip design wins narrative; benefits from expanding AI data center buildout investment cycle |
| KLA Corp | KLAC | $2,106.94 | +9.21% | Semiconductor equipment rebound; Intel 18A foundry ramp-up directly benefits KLA’s process control equipment demand |
| Applied Materials | AMAT | $492.01 | +8.61% | Semiconductor equipment rebound; AI capex cycle and Intel foundry news signals continued equipment investment; direct beneficiary of advanced node manufacturing expansion |
DECLINERS
| Company | Ticker | Close | Change | Why It Moved |
|---|---|---|---|---|
| Palo Alto Networks | PANW | $266.24 | -2.14% | Cybersecurity software did not participate in hardware semiconductor bounce; rotation out of software/security into AI hardware names |
| Apple Inc | AAPL | $301.60 | -1.87% | Consumer electronics segment absent from AI foundry narrative; Intel foundry news may signal competitive shifts; capital rotated to semiconductor pure-plays |
| AbbVie Inc | ABBV | $223.07 | -1.83% | Healthcare sector declined -0.51%; defensive rotation reversed as risk appetite shifted to AI hardware; rising 10Y yield pressures rate-sensitive healthcare valuations |
| GE Aerospace | GE | $322.04 | -1.82% | Industrials sector soft (-0.21%); no Middle East de-escalation benefit for aerospace specifically; sector rotation away from cyclical industrials |
| Alphabet Inc | GOOGL | $363.31 | -1.42% | Communication Services sector declined -0.91%; Google’s large Intel foundry order raises AI capex concerns; sector rotation into hardware semis over internet/ad platforms |
C. HIGH-IMPACT STORIES -> TOP
BULLISH
1. Intel Lands Google TPU Manufacturing Order and NVIDIA 18A Trials — Foundry Transformation Validated; INTC +12%
The core facts:Google placed a firm order for more than 3 million tensor processing units (TPUs) to be manufactured by Intel Foundry in 2028, following extensive testing of Intel’s advanced packaging systems. Simultaneously, NVIDIA is running early trials of Intel’s 18A process node for its next-generation Feynman GPU architecture and evaluating complex multi-chip designs — though no firm contract has been signed with NVIDIA yet. Intel shares surged approximately 12% on the news, triggering a broad semiconductor equipment sweep: KLA (KLAC) +9%, Applied Materials (AMAT) +9%, with Wells Fargo and Barclays raising price targets to triple-digit levels. A separate Hitachi partnership on advanced interconnects was also disclosed. Q2 2026 marks the first major US hyperscaler manufacturing commitment to Intel Foundry Services.
Why it matters:For Intel, this is the validation its foundry business has needed for three years. Intel Foundry Services has been the central investment thesis driving INTC’s ~250% YTD rally — but manufacturing ambitions mean nothing without customer wins from credible counterparties. Google placing a 3M+ TPU order is exactly that: a world-class chip designer choosing Intel’s process over TSMC for a flagship AI accelerator at scale. The NVIDIA 18A trials add a second dimension: if NVIDIA’s Feynman architecture qualifies on 18A, Intel would be manufacturing chips for the two most consequential AI customers on the planet simultaneously. The CHIPS Act policy rationale — US semiconductor supply chain independence — receives its strongest commercial confirmation to date, as Google and NVIDIA effectively validate Intel’s technology with real production commitments. For the broader semiconductor equipment complex (KLAC, AMAT), Intel’s foundry ramp represents a multi-year capital expenditure cycle of the highest magnitude. The contrast with Friday’s -6.11% tech selloff is stark: today’s foundry wins confirm that AI capex demand is structural, not speculative, and that Intel’s 18A process is technically credible.
What to watch:Any announcement of a firm NVIDIA manufacturing contract for 18A — the upgrade from “early trials” to “signed order” would be the most significant single validation Intel Foundry has received. Watch for Intel’s next earnings call and any CHIPS Act funding disbursements as milestones.
BULLISH
2. AI Semiconductor Sector Fully Recovers Friday’s Rate-Shock Losses — SOX +5.99%, Nasdaq +0.9%; Rate-Overreaction Thesis Prevails
The core facts:The Philadelphia Semiconductor Index (SOX) surged 5.99% Monday, recovering the majority of Friday’s -6.11% sector collapse. Micron (MU) +10%, Marvell (MRVL) +9.63%, KLA (KLAC) +9%, Applied Materials (AMAT) +9%, NVIDIA (NVDA) rebounded from Friday’s -6.3% selloff. The Nasdaq Composite gained 0.9%, partially recovering Friday’s -4.77% decline. The S&P 500 added 0.30%, ending a 9-week winning streak that had been snapped on Friday. The VanEck Semiconductor ETF (SMH) gained approximately 5%. The recovery was concentrated in AI-exposed semiconductors — the same names that led Friday’s selloff. The DJ Transportation Average hit a new 10-session high (+1.00%), reflecting reduced geopolitical risk sentiment.
Why it matters:Friday’s semiconductor collapse was explicitly identified as macro-driven — the 172K NFP blowout drove real yield expansion, compressing high-multiple AI chip valuations that had been priced on rate-cut assumptions. Monday’s near-complete reversal delivers the market’s verdict on that interpretation: the rate shock warranted repricing, but not the magnitude of the selloff. The Intel foundry wins (story C1) provided the specific catalyst that reset the narrative — confirming AI capex demand is structural and that the Computex-week enthusiasm, while excessive, was not fundamentally wrong. The analytical significance extends beyond the daily move: a 5-6% sector selloff followed by a near-complete reversal in a single session is consistent with forced deleveraging (margin calls, risk-limit breaches) rather than a genuine fundamental reassessment. The institutions that sold into Friday’s panic are now facing a reset at essentially the same prices. For portfolio positioning, the message is that the AI semiconductor complex’s primary driver remains corporate capex conviction — which the Intel/Google/NVIDIA story confirmed today — not the rate environment’s marginal daily fluctuations.
What to watch:The SOX’s ability to hold above the pre-Computex level (~4,800) as the technical gauge separating “rate-adjustment correction” from “AI premium de-rating.” Watch CME FedWatch hike probability for any further move toward 70%+ that could re-pressure the sector before the June 17 FOMC decision.
UNCERTAIN
3. Israel-Iran Re-Escalation: Petrochemical Plant Struck, ~30 Missiles Fired — WTI +3.5% to $93.67 Despite Trump Ceasefire Claim; OPEC+ Adds 188K bpd
The core facts:Over the weekend, Israel and Iran exchanged their most serious missile fire since the April ceasefire — the Israeli Air Force struck military targets in western and central Iran, including damage to the Mahshahr petrochemical complex in Iran’s southwest, while Iran fired approximately 30 missiles at Israel. The exchange marks the most serious escalation since the ceasefire began roughly two months ago. President Trump posted on Truth Social that both Israel and Iran are “looking to do an immediate ceasefire,” and stated that final negotiations on “peace” are proceeding. Despite Trump’s claims, WTI crude surged 3.46% to $93.67/bbl and Brent advanced 3.18% to $96.05/bbl as traders priced in renewed supply disruption risk. Separately, seven OPEC+ nations approved a fourth consecutive monthly production increase of 188,000 bpd for July — adding Saudi Arabia (+62K), Russia (+62K), Iraq (+26K), Kuwait (+16K), Kazakhstan (+10K), Algeria (+6K) and Oman (+5K). The next OPEC+ review is July 5.
Why it matters:The UNCERTAIN classification reflects a genuine dual dynamic: the oil price surge from last week’s $90 toward $94 is a stagflationary headwind at the worst possible moment — entering the week of the June 16-17 FOMC decision, with FOMC blackout in effect and Chair Warsh unable to respond before the rate decision. From the Fed’s perspective, renewed oil-driven inflation pressure (Brent +3% in a day) directly complicates the calculus on whether to hike at Warsh’s inaugural meeting. The Mahshahr petrochemical strike is analytically significant: Iran’s petrochemical exports represent a meaningful portion of its foreign currency revenue, and damage to that infrastructure signals escalation beyond symbolic military exchange. However, Trump’s ceasefire claim injects genuine uncertainty — if a truce materializes before markets open Tuesday, oil could retrace sharply. The OPEC+ +188,000 bpd hike is described by analysts as “largely symbolic” given the Strait of Hormuz risk premium — at $93.67 WTI even after four consecutive monthly hikes, OPEC supply increases are being absorbed by conflict-driven demand uncertainty. The critical macro risk: global oil inventories remain historically depleted from the earlier conflict phase, meaning any renewed serious escalation would push WTI back above $96 with extraordinary speed.
What to watch:Any formal ceasefire announcement — Trump’s Truth Social post is not confirmed by either government. WTI’s $90/barrel level as the PCE-relief inflection point relevant to Fed policy; if oil sustains above $93, headline inflation is meaningfully higher than models that assumed the April ceasefire would hold.
UNCERTAIN
4. NY Fed May Survey: Inflation Expectations Ease to 3.5% But Consumer Stress Deepens — Hard/Soft Divergence Sharpens FOMC Dilemma
The core facts:The Federal Reserve Bank of New York released its May 2026 Survey of Consumer Expectations Monday. Headline one-year inflation expectations eased to 3.5% from 3.6% — a modest positive. However, beneath the headline: the perceived probability of job loss over the next year rose to 15.1%, the highest in six months; financial pessimism reached its worst reading since July 2022; and wage satisfaction fell to all-time lows in the survey’s history (since 2014). Three-year and five-year inflation expectations were unchanged at 3.1% and 3.0% respectively. CME FedWatch showed greater than 95% probability of no change at the June 16-17 FOMC meeting (3.50–3.75% target range), but hike probability for later in 2026 remains elevated following Friday’s blowout May NFP (172K, double consensus). The FOMC blackout period is in full effect (June 7–17) — no Fed speakers can respond to today’s data before Warsh’s first rate decision.
Why it matters:This survey is among the last major economic readings entering the June 16-17 FOMC meeting, and it presents the Fed with an unusually sharp hard/soft divergence: the aggregate labor market is running at 172K jobs/month with positive revisions, yet individual consumers report growing anxiety about job security, financial health, and wages at the lowest satisfaction point on record. The policy implication is deeply uncertain. The NFP blowout says the economy is robust enough to absorb a rate hike — Hammack’s “may be appropriate to act soon” remains on the table. The consumer sentiment data says the household sector is already feeling more stress than the headline numbers reveal, consistent with the K-shaped labor market signal (rising jobless claims despite strong aggregate hiring). For Warsh at his inaugural meeting, this creates a genuine dilemma: hike on the strength of the labor data and risk tipping an already-stressed consumer into recession, or hold and allow hike expectations to simmer through the summer. Markets have resolved this tension by pricing June as a near-certain hold but keeping later-2026 hike probability above 50% — a “skip now, decide later” framework. The UNCERTAIN classification reflects that neither the bull nor bear case for rates is conclusive today.
What to watch:Wednesday’s May CPI report (core MoM consensus 0.3%, core YoY 2.9%) — the single most important data point before the June 17 decision. A hot print reinforces the hike case; a soft print reopens the “hold for the summer” path. CME FedWatch hike probabilities for the September and November meetings as the secondary monitor.
BEARISH
5. Apple WWDC 2026: Siri AI Launches with Google Gemini Partnership — 52-Week High Intraday Reversed to -1.89% Close on AI Disappointment
The core facts:Apple held its annual Worldwide Developers Conference (WWDC 2026) Monday, unveiling the next generation of Apple Intelligence. The flagship announcement was a significantly revamped “Siri AI” powered in part by Google Gemini technology — Apple’s formal acknowledgment that it cannot build frontier AI internally at the pace required. The new macOS was named “Golden Gate,” featuring liquid-glass design updates. Apple shares initially rallied more than 3% intraday to a fresh 52-week high of $317.40, then reversed sharply during the keynote and closed -1.89% at $301.54 — a ~5% intraday swing from peak to close. Analyst assessments noted that Siri AI’s capabilities were comparable to Gemini on Android devices, with no clear differentiation advantage. The stock was down approximately 1.89% despite the 52-week high being set earlier in the session.
Why it matters:The BEARISH classification reflects what the market confirmed with the intraday reversal: Apple Intelligence, after three years of build-up, has not produced a proprietary AI capability that justifies the premium embedded in analyst earnings models. The Google Gemini partnership is a double-edged disclosure — it solves Apple’s near-term AI capability gap but explicitly concedes that Apple’s on-device AI cannot compete with frontier models at the required quality threshold. For the iPhone upgrade cycle thesis — the primary driver of estimates for a return to top-line revenue acceleration — the central question was whether Apple Intelligence would create enough differentiation to prompt a mass upgrade cycle. Today’s “sell on news” reversal from a 52-week high is the market’s answer: not yet. Apple’s position as the world’s largest company (~$4.5T market cap) means even a subdued upgrade cycle or multiple compression carries index-level consequences. The Communication Services sector fell 0.91% on the day, partly reflecting the Apple AI disappointment. The longer-term risk: if Siri AI is perceived as a Google Gemini reskin rather than a proprietary intelligence layer, Apple’s moat in the premium smartphone market narrows, and the “Apple Intelligence supercycle” premium in the stock compresses.
What to watch:iPhone 17 pre-order data in September as the first hard signal on whether WWDC AI features drive an upgrade cycle; any Wall Street analyst rating changes on AAPL in the next 48 hours citing AI strategy concerns; Apple’s September earnings call for updated guidance on Apple Intelligence adoption rates.
D. MODERATE-IMPACT STORIES -> TOP
BULLISH
6. White House Cuts Section 232 Tariffs on Agricultural Machinery and HVAC Equipment to 15% — Effective Today Through December 2027
The core facts:A White House proclamation effective June 8, 2026 reduces Section 232 tariffs on agricultural equipment (tractors, combines, planters), HVAC systems and components, and certain mobile industrial machinery from 25% to 15% through December 31, 2027. For mobile industrial equipment imported from allied trading partners — Argentina, Ecuador, El Salvador, Guatemala, Japan, South Korea, Switzerland, Taiwan, the UK, and the EU — the maximum tariff is capped at 15% inclusive of Section 232 and most-favored-nation rates. The revision follows strong lobbying from US farm equipment manufacturers (Deere, CNH Industrial, AGCO) and HVAC companies (Carrier, Trane Technologies, Lennox) citing cost inflation on steel and aluminum content in equipment. The tariff structure reduces but does not eliminate the Section 232 regime for these categories.
Why it matters:The targeted tariff relief for agricultural equipment arrives during US spring planting season when farmers are making or deferring capital equipment purchases. A 10-percentage-point tariff reduction on tractors and combines translates directly to lower input costs for farm machinery dealers and reduced price pressure on end-buyers — a modest but tangible demand stimulus for the agricultural equipment sector heading into summer. For HVAC manufacturers, the relief comes during the peak cooling-season demand period: Carrier, Trane, and Lennox have all cited material cost inflation from Section 232 steel/aluminum surcharges in prior quarters. The allied-partner cap at 15% for Japan, South Korea, and Taiwan additionally signals continued trade relationship management separate from broader tariff policy — a narrow but important signal that allied-partner industrial goods retain preferential access. The macro significance is limited: this does not represent a broad tariff rollback, and the 15% rate remains elevated relative to pre-2018 norms. The relief is surgical and time-bounded through December 2027.
What to watch:Deere (DE) and AGCO’s next earnings calls for any guidance revision attributable to the input cost relief; any expansion of Section 232 tariff relief to additional industrial categories as a signal of broader trade policy direction.
BULLISH
7. Marvell Technology to Join S&P 500 on June 22 — MRVL +10% on Forced Passive Buying Announcement
The core facts:S&P Dow Jones Indices announced Friday after market close that Marvell Technology (MRVL) and Flex Ltd (FLEX) will join the S&P 500, effective before the open on June 22, 2026. MRVL replaces Pool Corporation (POOL) and The Campbell’s Company (CPB), which will be removed. Marvell shares surged approximately 10% Monday on the news, trading around $290.31, bringing its year-to-date gain to approximately 210% — among the top performing S&P 500 large-caps in 2026. At $290, MRVL’s market cap stands at approximately $247 billion. The S&P 500 addition marks a milestone for a company that was trading below $50 entering 2024.
Why it matters:S&P 500 index inclusions generate mechanical passive fund demand — every index fund, ETF, and index-benchmarked institutional mandate must build a MRVL position before June 22. At a $247 billion market cap, the required passive purchases represent a significant known demand event over the next two weeks. The announcement timing is notable: MRVL enters the S&P 500 coming off a -16.74% selloff on Friday (the rate-shock AI semiconductor collapse) followed by a +10% rebound Monday. The index inclusion provides a structural floor: passive managers cannot sell into the ramp regardless of market conditions. The broader signal is that the AI semiconductor boom has produced a new cohort of index-eligible companies that didn’t exist at this scale 24 months ago — MRVL’s rise from <$50 to ~$290 in two years, driven by AI networking chip demand, represents a fundamental shift in the semiconductor sector’s composition. Pool Corporation’s removal and Campbell’s removal confirm the index is rotating away from consumer staples toward AI-infrastructure names.
What to watch:MRVL’s price action from now through June 22 as a gauge of index-inclusion demand pressure; the “reconstitution creep” dynamic — other AI semiconductor names (KLAC, MCHP) that have surged in 2026 and may be candidates for future S&P rebalancing events.
BULLISH
8. Citigroup Raises S&P 500 Year-End Target to 8,100 — AI “Supercycle” Driving EPS to $350 in 2026, $400 in 2027
The core facts:Citigroup equity strategist Scott Chronert raised the bank’s year-end 2026 S&P 500 target to 8,100 from 7,700 Monday, citing an AI-driven earnings acceleration he describes as an “episodic fundamental surge.” At the S&P’s current level of approximately 7,405, the new target implies approximately 9.4% upside to year-end. Chronert projects S&P 500 index-level earnings of $350 in 2026, with a preliminary $400 estimate for 2027 — representing roughly 14.3% earnings growth year-over-year. The revision is explicitly based on earnings growth rather than multiple expansion: Chronert states “high confidence in continued earnings beats through year-end” driven by AI infrastructure investment translating into corporate productivity gains. The upgrade makes Citi one of the more bullish major institutional strategists on a 2026 year-end basis.
Why it matters:A Citigroup year-end S&P 500 target revision carries weight because it signals how a major institutional allocator is framing the risk/reward calculus at a moment of maximum uncertainty: FOMC hike risk, Middle East oil pressure, and WWDC disappointment all weigh on Friday’s bear case. Chronert’s explicit choice to ground the bullish thesis in earnings fundamentals rather than multiple expansion is analytically significant — it concedes that rates are elevated and multiples cannot expand, but argues that earnings growth can overcome both headwinds. The $350→$400 EPS trajectory implies the AI capex cycle pays off in corporate profitability within 12-18 months, not in some distant future. For portfolio managers, the Citi upgrade provides institutional cover for maintaining overweight technology and AI-infrastructure exposures after Friday’s volatility. It also directly rebuts the bear case that today’s rate environment makes growth stocks structurally unattractive: if earnings compound at 14%+ annually, the present value mathematics still work even at elevated discount rates.
What to watch:Whether other major bank strategists (Goldman, Morgan Stanley, JPMorgan) follow Citi with comparable upward revisions — a consensus target upgrade wave would be a meaningful sentiment catalyst. Q2 earnings season (begins mid-July) as the first hard test of the $350 EPS trajectory.
BEARISH
9. GoHealth Files Chapter 11 — Medicare Advantage Marketplace Collapse Signals Structural Stress in MA Sector
The core facts:GoHealth Inc. (GOCO) filed a prepackaged Chapter 11 bankruptcy on June 7, 2026, with the goal of transferring ownership to its senior lenders while canceling virtually all existing common equity. The filing carries support from 100% of lenders, 60%+ of Class A common stockholders, and 99%+ of LLC interest holders. GoHealth operates one of the largest independent Medicare Advantage (MA), Medicare Supplement, and Part D prescription drug enrollment platforms in the US, serving hundreds of thousands of beneficiaries. The company IPO’d in 2020 at approximately $575 million raised; by June 2026, its stock had declined approximately 88% from those levels. The collapse was driven by rapidly rising Medicare Advantage medical costs, broker compensation rule changes that disrupted its revenue model, and an over-leveraged balance sheet that could not absorb the margin compression. The company expects to emerge from restructuring before the 2026 annual enrollment period (AEP).
Why it matters:GoHealth’s collapse is a signal event for the Medicare Advantage sector’s structural stress. The two catalysts — rising MA medical costs and broker compensation rule changes — are not GoHealth-specific; they are sector-wide pressures affecting every participant in the MA distribution and carrier ecosystem. UnitedHealth Group, Humana, and CVS/Aetna have all disclosed materially elevated MA medical cost ratios in 2025-2026 earnings calls; the same cost dynamics that bankrupted a major enrollment platform are the same dynamics compressing carrier margins. For institutional investors in managed care, GoHealth’s failure provides a clean data point on where the MA unit economics broke first: enrollment intermediaries that depend on volume with no underwriting buffer are the most exposed layer, but the pressure originates in the underlying cost trends at the carrier level. The broker compensation rule changes cited in GoHealth’s restructuring were implemented by CMS to protect beneficiaries from misleading enrollment practices — but the unintended consequence was destroying the revenue model for independent enrollment platforms. Watch for read-through to Humana (HUM) and UnitedHealth (UNH) in the next earnings cycle.
What to watch:Humana and UnitedHealth earnings calls for updated MA medical cost ratio guidance; any CMS policy response to GoHealth’s bankruptcy that modifies broker compensation rules; whether eHealth (EHTH), the other major independent MA enrollment platform, shows comparable balance sheet stress.
BULLISH
10. Corning Wins Multibillion-Dollar Amazon AI Fiber Deal — GLW +5.55%; Third Major Hyperscaler Contract of 2026
The core facts:Amazon signed a multiyear, multibillion-dollar agreement with Corning (GLW) to supply optical fiber, cable, and connectivity equipment for its US AI data center infrastructure buildout. The deal will create 1,000 advanced-manufacturing jobs at Corning’s North Carolina facilities and marks Amazon’s formal lock-in of optical fiber supply for the coming data center expansion cycle. Corning shares gained 5.55% Monday, with intraday gains as high as 9-10% before settling. The Amazon agreement is Corning’s third major hyperscaler commitment of 2026, following a Meta contract worth up to $6 billion and an NVIDIA partnership. Corning’s stock has more than doubled in 2026 and risen approximately sixfold since the end of 2023, driven by AI infrastructure-related fiber demand.
Why it matters:Corning’s sequential hyperscaler contract wins (Meta → NVIDIA → Amazon) reveal that optical fiber has become a strategic supply bottleneck in AI data center construction — and that hyperscalers are locking in supply years in advance to avoid build delays. Optical fiber is the connectivity backbone that links servers and racks inside AI data centers; as training cluster sizes grow from tens of thousands to hundreds of thousands of GPUs, fiber density requirements grow exponentially. The supply constraint dynamic is the same as for NVIDIA GPUs: demand is outpacing the industry’s manufacturing capacity to respond, which is why Amazon is signing a multi-year, multibillion deal rather than purchasing on the spot market. For investors, the Corning story is an example of “AI picks and shovels” at a layer below the semiconductor story — not the GPUs themselves, but the physical infrastructure that connects them. The job creation angle (1,000 North Carolina manufacturing jobs) is also politically significant as the administration emphasizes reshoring industrial capacity. The risk to the thesis: Corning’s stock has risen sixfold in three years, creating high expectations that require continued contract velocity.
What to watch:Whether Microsoft and Google add fiber procurement contracts with Corning — completing the hyperscaler sweep. Corning’s quarterly revenue from the optical communications segment as the leading indicator for fiber demand conversion to earnings.
E. ECONOMY WATCH -> TOP
The pre-FOMC week opens with a hard/soft split that has deepened. May NFP printed 172K — double consensus — yet today’s NY Fed Consumer Expectations survey showed job security fears at a six-month high (15.1% perceived job loss probability) and household financial pessimism at its worst since July 2022. Claims for the week ending May 30 rose to 225K (4-month high), while Q1 productivity was revised to +0.3% from +0.8%. With the FOMC in blackout (Jun 7–17) and rate hike odds at 55%, the week’s verdict rests on Wednesday’s May CPI — headline YoY expected to jump from 3.8% to 4.2% — the final major input before Chair Warsh’s debut rate decision.
NY Fed May Survey: Inflation Expectations Dip to 3.5% as Job Security Fears Hit Six-Month High (NY Fed / CNN Business, June 8, 2026)
What they’re saying:The NY Fed’s May 2026 Survey of Consumer Expectations — released this morning — showed 1-year inflation expectations edged down to 3.5% from 3.6% in April, while 3- and 5-year expectations held steady at 3.1% and 3.0%. The relief on the inflation side was overshadowed by sharply deteriorating labor confidence: the perceived probability of job loss in the next year rose to 15.1%, a six-month high, while the perceived probability of finding a new job if laid off fell to 43.7% — below the 12-month average of 46.8% and the lowest reading in five months.
The context:The divergence between hard and soft data continues to widen. Despite the BLS reporting 172K May payrolls — double the consensus — 13.3% of households reported being “much worse off” financially than a year ago, the highest share since July 2022, up more than 2 percentage points from April. Satisfaction with wage compensation and promotion opportunities both fell to all-time lows since the series began in March 2014. For the FOMC — now in blackout through June 17 — the data sends a conflicting signal: cooling inflation expectations favor patience, but the collapse in consumer labor market confidence points to real economic stress beneath the headline payrolls numbers.
What to watch:Wednesday May CPI (Jun 10, 8:30 AM ET) — core YoY expected 2.9% vs. 2.8% prior, headline YoY expected 4.2% vs. 3.8% prior. This is the final major datapoint before Chair Warsh’s debut FOMC decision on June 17.
Initial Jobless Claims Jump to 225K — Four-Month High, Topping 215K Consensus (DOL, June 4, 2026)
What they’re saying:Initial jobless claims for the week ending May 30 rose 13,000 to 225,000 — exceeding the 215,000 consensus estimate and reaching the highest level since early February. The increase reversed several weeks of lower readings and was released on June 4, one day before the May nonfarm payrolls blowout. The S&P 500 slipped on the claims miss before recovering the following session after the stronger-than-expected NFP print.
The context:The 225K claims reading adds texture to the blowout 172K NFP: the labor market appears to be generating new hires in some sectors while simultaneously shedding workers in others. This bifurcation — consistent with a K-shaped labor market highlighted in last week’s Beige Book — helps explain why consumers in the NY Fed survey are more worried about job security despite a strong headline payrolls number. Sustained claims above 220K would signal genuine softening below the surface of aggregate employment data.
What to watch:Initial jobless claims for the week ending June 6, released Thursday June 11 (prior: 225K). A second consecutive reading above 220K would confirm a softening trend and add to the pre-FOMC data complexity.
Consumer Credit Surges $22.3B in April — Revolving Credit at Fastest Growth Since November 2023 (Federal Reserve G.19, June 5, 2026)
What they’re saying:U.S. consumer credit expanded $22.3 billion in April, significantly exceeding the $18 billion consensus. Revolving credit — primarily credit cards — grew at a 10.4% annualized rate, the fastest pace since November 2023, pushing total revolving credit outstanding to $1.348 trillion, approaching the all-time high of $1.352 trillion recorded in October 2024. Non-revolving credit (auto loans, student loans) grew at a more modest 2.9% annualized rate.
The context:The credit surge carries a dual interpretation. Bulls argue sustained borrowing capacity reflects consumer confidence and access to credit. Bears note that accelerating revolving credit growth at current rates — while the NY Fed survey simultaneously shows financial pessimism at a post-2022 high — suggests households are increasingly borrowing to sustain consumption rather than spending from income gains. The approach toward the all-time revolving credit peak ($1.352T) is a threshold that bank analysts and credit quality monitors will watch closely as Q2 earnings approach.
What to watch:NY Fed Household Debt and Credit Report (Q1 2026) for granular delinquency and charge-off trends. Monitor Q2 earnings credit card disclosures from JPMorgan, Bank of America, and Capital One for deterioration signals.
Q1 Productivity Revised Sharply Lower to +0.3% from +0.8%; Output Growth Downgraded (BLS, June 4, 2026)
What they’re saying:The Bureau of Labor Statistics revised Q1 2026 nonfarm business productivity growth to +0.3% annualized — down 0.5 percentage points from the initial estimate of +0.8%. The revision was driven by a downgrade to output growth (to +1.0% from +1.5%), while hours worked held at +0.7%. On the inflation side, unit labor costs came in at +1.8% annualized (revised down from +2.3%), and hourly compensation grew 2.1% in the quarter.
The context:Lower productivity growth means more workers are required per unit of output — a structural headwind to potential GDP growth and corporate margins over time. The accompanying downward revision to unit labor costs (+1.8% vs. +2.3% prior) is a modest inflation offset. With May payrolls surging 172K, the question for the Fed and investors becomes whether this hiring is producing proportional economic output or merely adding to the cost base without productivity gains. The Q1 deceleration follows a stretch of AI-powered productivity gains in 2024–25; the revision suggests those tailwinds may be diminishing.
What to watch:GDPNow Q2 2026 estimate (next update: June 9, currently tracking at 3.0% as of June 1). Q2 preliminary productivity (released ~August 2026). A sustained gap between robust hiring and tepid output growth would reinforce stagflationary concern.
GoHealth Files Chapter 11 with $1B+ in Liabilities — Major Medicare Marketplace Operator Collapses (National Law Review, June 7, 2026)
What they’re saying:GoHealth, Inc. — one of the largest U.S. Medicare and ACA health insurance marketplace operators — filed for Chapter 11 bankruptcy protection on June 7, listing assets of $500M–$1B and liabilities of $1B–$10B. The filing, made in Delaware, included multiple affiliated entities: GoHealth LLC, e-TeleQuote Insurance, Connected Benefits LLC, ETQ Holdings, and Norvax. GoHealth went public in July 2020 at a $6.6 billion valuation before a prolonged decline driven by regulatory and cost headwinds.
The context:GoHealth’s collapse reflects broader pressure on insurance distribution platforms from rising Medicare Advantage costs, regulatory changes to broker compensation, and elevated debt levels inherited from its leveraged buyout structure. The bankruptcy does not immediately affect policyholders’ existing coverage — plans are issued by the underlying carriers (Humana, UnitedHealth, Aetna) — but disrupts plan enrollment and switching services for hundreds of thousands of beneficiaries. The insurer’s failure underscores the structural stress building in the Medicare Advantage distribution ecosystem as CMS tightens broker compensation rules. The filing adds to a six-consecutive-year rise in large corporate bankruptcies.
What to watch:Court proceedings and plan of reorganization. Monitor shares of comparable insurance distribution platforms. CMS response regarding service continuity for enrolled GoHealth customers during the Chapter 11 process.
F. EARNINGS WATCH -> TOP
YESTERDAY AFTER THE BELL (Markets Reacted Today)
No major earnings yesterday after the bell from companies with >$100B market cap.
TODAY BEFORE THE BELL (Markets Already Reacted)
No major earnings before the bell from companies with >$100B market cap.
TODAY AFTER THE BELL (Markets React Tomorrow)
No major earnings after the bell from companies with >$100B market cap.
WEEK AHEAD PREVIEW:
Q1 2026 earnings season is effectively complete at 97% reported. The spotlight this week shifts to Q4 FY2026 reporting, led by one mega-cap technology name with significant AI cloud implications amid FOMC week.
Oracle (ORCL) — AMC, Wednesday June 10 — Q4 FY2026 results; consensus EPS $1.96, revenue $19.10B. Key focus: Oracle Cloud Infrastructure (OCI) growth rate and Remaining Performance Obligations conversion ($553B RPO backlog — the single largest AI cloud contracted revenue figure among enterprise software vendors); FY2027 total revenue guidance toward $90B; cloud revenue growth trajectory (prior guidance: 44-50% in constant currency). Options market is pricing a ~13% move in either direction — highest implied volatility for ORCL ahead of earnings in years. Reports on the same evening as the May CPI release, creating dual catalysts for tech positioning Wednesday evening. Beat + raised guidance would provide a significant AI-cloud demand signal mid-FOMC-week.
Q2 2026 earnings season begins mid-to-late July; the SpaceX (SPCX) Nasdaq IPO debut scheduled for Thursday June 12 will draw significant attention ahead of the June 16-17 FOMC decision.
G. WHAT’S NEXT -> TOP
UPCOMING RELEASES:
| Date | Event | Why It Matters |
|---|---|---|
| Tue, Jun 9 | NFIB Small Business Optimism — May (exp. 96.0, prior 95.9) | Small business sentiment is a leading indicator of hiring intentions and capital spending; a reading below 95 would add to the soft/hard data divergence narrative ahead of FOMC. |
| Tue, Jun 9 | Balance of Trade — April (exp. ‑$56.4B, prior ‑$60.3B) | A narrowing deficit would be a modest positive for Q2 GDP tracking; watch for tariff-driven import front-loading distortions that inflated the prior ‑$60.3B reading. |
| Tue, Jun 9 | Existing Home Sales — May (exp. 4.06M, prior 4.02M) | Rate-sensitive housing activity remains a key gauge of mortgage market transmission; any upside surprise would complicate the Fed’s case for a near-term cut, while a miss adds to rate-pressure evidence. |
| Wed, Jun 10 | May CPI — Core YoY (exp. 2.9%, prior 2.8%) & Headline YoY (exp. 4.2%, prior 3.8%) | The most important datapoint of the week. Headline YoY expected to accelerate sharply from 3.8% to 4.2%, driven by Israel-Iran oil price pressure. This is the final major pre-FOMC data release; a hot print reinforces hike risk for 2H 2026 and raises pressure on Warsh’s June 17 debut decision. |
| Thu, Jun 11 | Initial Jobless Claims — week ending Jun 6 (prior: 225K) | Prior week’s 225K was a four-month high. A second consecutive reading above 220K would confirm labor market softening beneath the 172K NFP headline and amplify the consumer stress signals in the NY Fed survey. |
| Tue, Jun 16 – Wed, Jun 17 | FOMC Meeting — Rate Decision (current target: 3.50–3.75%) | Chair Warsh’s debut rate decision. Markets pricing 95%+ probability of no change, but rate hike odds for 2H 2026 sit above 55% on Polymarket. The June 17 press conference sets the tone for summer: hold-and-watch vs. signal-a-hike. Wednesday’s CPI and Thursday’s claims are the last data inputs before the blackout closes. |
KEY QUESTIONS:
1. Does Wednesday’s May CPI headline YoY print at or above 4.2%, and if so, does the rate market reprice 2H 2026 hike probability above 65% — raising the stakes for Warsh’s June 17 press conference to explicitly signal or rule out a summer hike?
2. Does the Israel-Iran ceasefire Trump claimed on Truth Social materialize into a formal agreement before Wednesday’s CPI — and if so, does a sharp WTI reversal from $91 toward $85 change the inflation calculus enough to open a path back toward Fed cuts in 2026?
3. Does Intel announce a firm NVIDIA manufacturing contract for the 18A process node — converting “early trials” into a signed order — validating foundry credibility with both of the two most consequential AI hardware customers simultaneously?
H. CHART OF THE DAY -> TOP
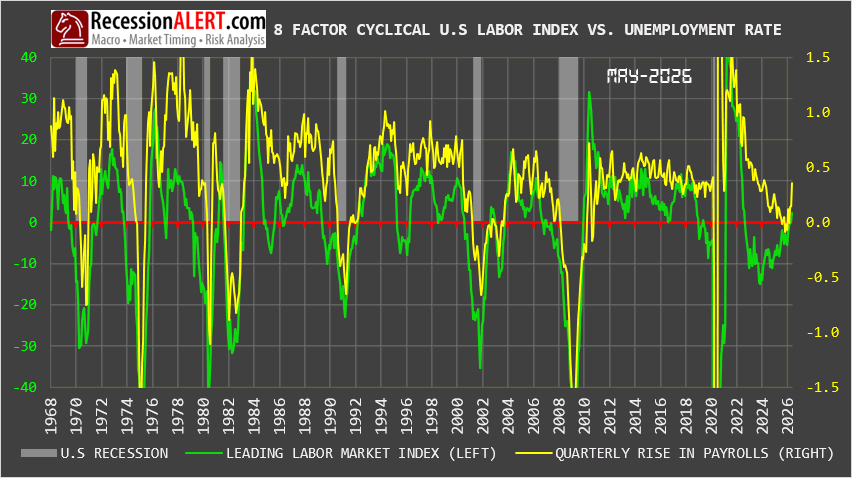
Recoveries don’t announce themselves on the front page — they start in the plumbing, and the plumbing here is factory hours. The 8-factor Cyclically Sensitive Labor Market Index spent eleven months below zero and bottomed at -8.18 in May 2025 — an excursion that, in every prior modern cycle from 1970 through 2020, sat inside a recession bar. This one did not. Instead it has climbed -5.50, -2.42, -0.68, -0.25, +0.54, +2.19 across five accelerating months, model-implied recession probability has collapsed from the mid-60s to 0.00%, and headline unemployment never budged from 4.3%. Factories find a floor, hours extend before headcount, overtime absorbs the next marginal shift, openings rise, hiring follows — and the index captures that sequence roughly eight months ahead of coincident payrolls, corroborated by ISM Manufacturing at 54.0, JOLTS openings back to 7.6M, and May NFP at +172k. Diffusion at 37.5% keeps the lead manufacturing-narrow, but a soft landing ratified at the leading edge is a different rate path, a different risk regime, and a different bill for anyone still positioned for the contraction that never arrived.
Market Intelligence Brief (MIB) Ver. 18.40
For professional investors only. Not investment advice.
© 2026 RecessionALERT.com
Comments are closed.