
MIB WEEKLY DIGEST
Week of Jun 15–19, 2026
WTI crude fell 9% as the US and Iran confirmed a 60-day Hormuz ceasefire MoU (formal signing in Geneva on Friday), mechanically deflating the energy inflation premium that locked the Fed out of cuts — but Fed Chair Warsh promptly reclaimed that hawkish space: his inaugural FOMC stripped all easing bias and had 9 of 18 members projecting a 2026 hike, pushing 2Y yields to a 14-month high. Against both forces, the Philadelphia SOX hit a record — Trump’s confirmed Apple–Intel domestic foundry deal capped a week where AI hardware proved rate-cycle-agnostic. S&P +0.93% WoW, Nasdaq +2.60%, DJTA −4.25%.
TABLE OF CONTENTS
A. WEEK AT A GLANCE
B. WEEK IN MARKETS
C. WEEK’S TOP STORIES (7)
D. WEEK IN THE ECONOMY (5)
E. WEEK IN EARNINGS (1)
F. NEXT WEEK SETUP
G. CHART OF THE WEEK
A. WEEK AT A GLANCE -> TOP
The week’s dominant macro variable was the US-Iran 60-day Hormuz ceasefire MoU — confirmed Monday, formalized Wednesday — which drove WTI crude −9.1% to $76.58, mechanically deflating the energy inflation premium that had locked the Fed out of cuts for eight months. Warsh’s inaugural FOMC promptly reclaimed that hawkish space: his June 17 debut stripped all easing bias, moved the 2026 rate-median to 3.8% with 9 of 18 members projecting a hike, and pushed the 2Y yield to a 14-month high of 4.179%. Yet the S&P finished +0.93% WoW as the AI semiconductor complex — validated by the Trump-confirmed Apple–Intel domestic foundry deal and a SOX record on Thursday — proved rate-cycle-agnostic to institutional portfolios, even as NYSE Composite closed -0.41% and only 5 of 11 sectors advanced.
• S&P 500 +0.93% WoW, Nasdaq +2.60%; NYSE Composite −0.41%. Breadth was narrow: only 5 of 11 sectors advanced by week’s end; the headline S&P gain was powered by AI semiconductor concentration, not broad advance. DJTA collapsed −4.25% WoW — a Dow Theory non-confirmation — as SPCX post-IPO consolidation and defense rotation weighed on transports.
• WTI crude −9.1% WoW to $76.58 as the Strait of Hormuz began reopening under the US-Iran 60-day ceasefire; Dutch TTF −14.2% (Europe unwound more risk premium); Henry Hub +2.6% decoupled on domestic seasonality. Energy sector −5.96% WoW reversed most of its YTD +28% leadership built on the Hormuz premium.
• SOX hit a record Thursday as Trump confirmed Apple will use Intel’s IFS 18A-P process for domestic chip production. INTC +14.6% WoW; WDC +41.0% WoW (top mega-cap gainer of the week). The BofA “most crowded trade in history” designation (80% of fund managers on Tuesday) triggered a midweek −6–10% rout in the same names, which fully recovered by Thursday — the cleanest AI infrastructure crowding-risk-and-recovery sequence of 2026.
• Warsh’s FOMC June 17 dismantled the rate-cut narrative: 2Y yield +9.2 bps WoW to 4.179% (14-month high); Polymarket hike odds +11 pp to 58%; easing bias stripped; statement dramatically shortened. Retail sales +0.9% MoM (4th consecutive beat, +6.9% YoY) handed the committee full hawkish cover in a classic “good news is bad news” dynamic.
• SpaceX (SPCX) crossed $2.8T (surpassing Amazon) after a $60B all-stock acquisition of AI coding tool Anysphere (Cursor), then pulled back −10%+ intraday Thursday as options trading enabled the first institutional short-sellers on week 1 of public trading. Closed the week ~$185 — still ~37% above the $135 IPO price.
• Accenture −16–18% on guidance cut (FY26 revenue growth slashed to 3–4%): on the same day as the SOX record, AI bifurcation arrived in P&L form — hardware thrives, IT consulting implodes as AI substitution outpaces AI deal revenue scaling. IBM fell −5% sympathetically.
1. Iran as the CPI Unlock — and Its Hawkish Counterweight — WTI at $76 (down from ~$93 at peak) is deflating the energy component that drove May CPI to 4.2%; if the Geneva signing holds and Iranian barrels ramp over 4–8 weeks, the H2 2026 CPI path is fundamentally changed. But Warsh’s FOMC seized on that same potential relief to justify removing the easing bias — locking in the hawkish framework before Iran can actually deliver the disinflation. The two forces arrived in the same week and are now in structural tension over every rate-sensitive equity sector and the Fed’s September decision.
2. AI Is Rate-Cycle Agnostic — For Now — The SOX hitting a record on a hawkish FOMC week signals that institutional managers are treating AI infrastructure capex as structurally protected from rate headwinds. The Apple–Intel foundry deal and the BofA crowded-trade midweek rout both confirm the same thing from different angles: the AI trade is real but concentrated, with crowding risk (80% BofA designation, Tuesday −6–10% reversal) and structural demand (Thursday full recovery to a record) visible simultaneously. The trade survives rate shocks until it doesn’t — and the 80% “most crowded” reading historically precedes 3–6 months of sector underperformance.
3. The AI Bifurcation Has Arrived in the P&L — Accenture’s −16–18% guidance cut on the same day as the SOX record captured the week’s defining structural shift in a single session: AI hardware infrastructure (Intel, WDC, GEV) benefits; AI-displaced consulting and services (Accenture, IBM) are impaired. Enterprise clients are pausing discretionary IT projects while evaluating whether AI agents can replace the work. New bookings declining 2% at the world’s largest consulting firm is not a coincidence — it is the first P&L manifestation of a structural shift that analysts have been debating since late 2024.
B. WEEK IN MARKETS -> TOP
Two macro forces defined the week: the US-Iran 60-day ceasefire MoU — confirmed Monday, formalized Wednesday — drove WTI −9.1% as markets priced Hormuz reopening within 4–8 weeks, mechanically deflating the energy inflation premium that had locked the Fed out of cuts. Warsh immediately reclaimed that space: his inaugural June 17 FOMC stripped all easing bias, had 9 of 18 members projecting a 2026 hike, and pushed the 2Y yield to a 14-month high of 4.179%. The week’s breadth signal is the tell — S&P +0.93% but NYSE Composite −0.41%, with only 5 of 11 sectors advancing by Thursday. The AI semiconductor complex (SOX record Thursday on Apple–Intel foundry confirmation) drove the headline while Energy (−5.96%), DJTA (−4.25%), and precious metals (−7.05% silver) bore the macro repricing. The curve flattened 12.6 bps WoW: bond markets confirmed near-term hike risk but declined to endorse the long-run growth narrative.
WEEK-ON-WEEK CHANGE — Thu, Jun 18, 2026 (last trading day; Jun 19 = Juneteenth holiday):
MAJOR INDICES
The week’s key breadth tell: S&P 500 +0.93% while NYSE Composite finished −0.41% — a 1.34% gap confirming AI semiconductor leadership (Nasdaq +2.60%) drove the headline while the broad market declined. The Dow Theory signal fired: DJIA +0.71% WoW vs. DJTA −4.25% — a 4.96% divergence, more than double the 2% threshold — with transports collapsing on SPCX’s post-IPO consolidation and defense sector rotation. A transport non-confirmation of this magnitude, with NYSE Composite red, flags that the week’s gains were powered by a narrow AI hardware cohort, not a durable broad market advance.
| Index | Thu Close | WoW Change | WoW % | Why It Moved (Week) |
|---|---|---|---|---|
| S&P 500 | 7,500.65 | +69.25 | +0.93% | Iran peace deal removed Hormuz supply shock; AI semiconductor complex hit a record (Apple–Intel, Thursday); the +0.93% net masked a −1.21% Wednesday FOMC-day loss fully recovered on Thursday — a whipsaw within a net-positive week. |
| Dow Jones Industrial Avg. | 51,564.70 | +362.41 | +0.71% | Financials and Industrials led Mon–Wed on rate-hold conviction and Iran energy cost relief; Dow hit a 17th 2026 record Tuesday. IBM (−9.37% weekly) was the heaviest drag after Accenture’s guidance cut sparked IT-services sector repricing Thursday. |
| DJ Transportation Avg. | 21,637.9 | −958.8 | −4.25% | Week’s steepest major-index loss. SPCX post-IPO consolidation (fell from $201 to $185 over Mon–Thu) weighed heavily as the Industrials sector’s largest constituent. Defense rotation out (RTX −3.62%) compounded. Airline fuel-cost gains only partially offset. DJIA/DJTA gap of 4.96% WoW is the week’s sharpest Dow Theory non-confirmation. |
| Nasdaq 100 | 30,406.19 | +770.24 | +2.60% | AI semiconductor supercycle drove the outperformance: Computex 2026 (Monday), WDC/MU/MRVL upgrades (Mon–Tue), SOX record on Apple–Intel foundry deal (Thursday). Midweek BofA “crowded trade” rout (−1.89% Tuesday) fully recovered by +2.48% Thursday session. |
| Russell 2000 | 2,975.86 | +31.04 | +1.05% | Small-caps led on the final two days as FOMC certainty replaced uncertainty; Iran de-escalation supported domestic growth sentiment. RUT’s 10-session outperformance over S&P (+2.46% cumulative) signals broad market participation building beneath the large-cap AI surface. |
| NYSE Composite | 23,499.74 | −96.05 | −0.41% | Breadth was weak beneath the headline. Energy sector (−5.96% WoW) dragged the broad composite as Iran deal unwound the Hormuz premium. NYSE Composite red while Nasdaq +2.60% WoW is the week’s defining breadth signal: AI semiconductor leadership was narrow, not broad. |
VOLATILITY & TREASURIES
The curve flattened 12.6 bps WoW (39.4 → 26.8 bps, 2Y–10Y) as front-end yields jumped to 4.179% on Warsh’s inaugural FOMC — 9 of 18 members projecting a 2026 hike drove the 2Y’s +9.2 bps net move — while the 10Y eased 3.4 bps as Tuesday’s housing starts (−15.4%) created a growth-scare duration bid that survived the FOMC. VIX fell 7.3% net despite Wednesday’s intraday spike to 18.43: uncertainty resolved, not amplified. DXY crossing above 100 signals the rate-differential trade, not safe-haven capital flight — a distinction that matters for dollar direction through Q3.
| Instrument | Thu Level | WoW Change | Why It Moved (Week) |
|---|---|---|---|
| VIX | 16.40 | −1.29 (−7.29%) | Iran de-escalation removed the Hormuz geopolitical tail risk; Warsh FOMC initially spiked VIX to 18.43 Wednesday but Thursday’s Apple–Intel catalyst resolved the uncertainty. Net-week VIX decline: geopolitical premium removed (bullish) outweighed rate-hike signal (bearish). |
| 10-Year Treasury Yield | 4.447% | −3.4 bps | Modest yield decline despite hawkish FOMC — housing starts −15.4% Tuesday created a growth-scare duration bid; 20-year auction drew 73.2% foreign demand (vs 64.9% average). Bond market declined to confirm the FOMC’s near-term hawkishness at the long end. |
| 2-Year Treasury Yield | 4.179% | +9.2 bps | Sharpest WoW curve move. Warsh’s debut FOMC (June 17) stripped easing bias and moved the dot-plot median to 3.8% with a majority-hike signal; retail sales +0.9% (4th consecutive beat, +6.9% YoY) and import prices at 6.7% YoY provided the data cover for the repricing. |
| US Dollar Index (DXY) | 100.82 | +1.04 (+1.04%) | Dollar strengthened on Warsh’s hawkish FOMC signal — higher US rates vs. global peers drew carry-trade flows; DXY crossed above 100 for the first time this week. Iran de-escalation (normally dollar-softening on risk-on) was offset by the rate-differential widening thesis. |
COMMODITIES
Gold’s −0.18% net week conceals a violent intra-week round trip: Iranian peace news drove it to $4,353 mid-week, then the Warsh FOMC + MoU execution simultaneously removed two distinct premiums (rate-hedge appeal and geopolitical safe-haven) in a single Thursday session, erasing the gain. Silver’s −3.34% underperformance vs. gold reveals the dual-premium mechanics most clearly — the industrial safe-haven overlap amplified the Thursday selloff more than pure monetary gold. Bitcoin’s −0.91% tracking DXY strength (not the SOX record) confirmed it functioned as a dollar-inverse asset this week, not an AI-narrative proxy.
| Asset | Thu Price | WoW Change | WoW % | Why It Moved (Week) |
|---|---|---|---|---|
| Gold | $4,227.75/oz | −$7.67 | −0.18% | Net week near-flat masks a round trip to $4,353 mid-week then a −3.51% Thursday collapse. Warsh’s hawkish FOMC + Iran MoU execution simultaneously removed the rate-hedge bid and geopolitical safe-haven premium in a single session. |
| Silver | $65.778/oz | −$2.272 | −3.34% | Sharper than gold due to silver’s dual monetary/industrial role; hit $70+ mid-week then −7.05% Thursday as geopolitical and monetary premiums simultaneously unwound. The industrial-safe-haven overlap amplified the Thursday move. |
| Copper | $6.3780/lb | −$0.1003 | −1.55% | DXY +1.04% WoW outweighed AI/electrification demand optimism. Iran de-escalation was expected to boost industrial copper demand (supply chains normalizing) but dollar strength dominated. Modest decline consistent with mixed growth signals. |
| Platinum | $1,696.40/oz | −$22.40 | −1.30% | Precious metals complex decline on hawkish Fed and Iran MoU execution; −5.38% Thursday (largest precious metals decliner) as auto-catalyst and industrial demand concerns compounded the monetary repricing. |
| Bitcoin | $62,906 | −$578 | −0.91% | Tracked DXY strength rather than the AI-driven equity risk-on tape. Decoupled from the SOX record — BTC functioned as a dollar-inverse asset, not an AI-narrative proxy. No crypto-specific catalyst all week. |
ENERGY
The US-Iran 60-day ceasefire MoU drove WTI’s 9.1% WoW decline as markets priced Hormuz-transiting Iranian barrels returning within 4–8 weeks. Dutch TTF fell 14.2% WoW versus WTI’s 9.1% — Europe had more geopolitical premium to unwind; Henry Hub gained 2.6% independently on seasonal US demand. Oil declining while equities gained (+0.93% S&P WoW) is the demand-neutral supply-normalization read: the Hormuz risk premium was removed, not a growth scare. The EIA’s 10th consecutive crude draw — US commercial stocks at a 40-year low — provided a near-term floor that prevented a larger rout.
| Asset | Thu Price | WoW Change | WoW % | Why It Moved (Week) |
|---|---|---|---|---|
| Crude Oil (WTI) | $76.58/bbl | −$7.66 | −9.09% | US-Iran 60-day ceasefire MoU (confirmed Monday, formalized Wednesday) removed the Hormuz geopolitical supply premium embedded since April. WTI fell from $84.24 to $76.58 over 4 sessions; EIA’s 10th consecutive crude draw (−8.26M bbls, 40-year inventory low) provided a near-term floor. |
| Crude Oil (Brent) | $79.38/bbl | −$7.38 | −8.50% | Same Iran supply normalization driver. Tight WTI-Brent spread ($2.80 at week end) confirms a global supply story, not a regional disruption. Dutch TTF −14.2% WoW — Europe priced out more geopolitical premium than US crude markets. |
| Natural Gas (Henry Hub) | $3.217/MMBtu | +$0.082 | +2.62% | Decoupled entirely from crude all week — domestic US gas supply/demand is weather-driven and LNG-export-driven, indifferent to the Strait of Hormuz. Summer cooling demand and LNG export demand provided independent support throughout the week. |
| Natural Gas (Dutch TTF) | $13.61/MMBtu | −$2.26 | −14.24% | Europe aggressively priced out the Iran/Middle East supply risk premium across the week. Iranian LNG and pipeline flows expected to return in 4–8 weeks; week’s largest WoW percentage decline in the B1 table. |
S&P 500 SECTORS — WEEKLY ROTATION
Technology and Industrials led all 11 sectors this week — but both moves were single-cluster-driven, not broad. Four of the week’s top-5 gainers (WDC +41%, INTC +15%, SNDK +16%, STX +23%) are Technology names: strip them out and Tech’s +3.95% shrinks toward negligible. GEV alone (+22% weekly) drove a large share of Industrials’ +4.59% gain. Energy’s structural laggard signal deepened: worst sector across 1W (−5.96%), 1M (−11.94%), AND 3M (−9.25%) simultaneously — the Iran deal systematically extracting the Hormuz premium that powered its +28% YTD leadership through April. Broad-based sector leadership this was not: five sectors declined WoW, and the breadth verdict favors caution despite the headline indices.
| Sector | 1-Week | 1-Month | 3-Month | 6-Month | YTD | 12-Month |
|---|---|---|---|---|---|---|
| Industrials | +4.59% | +9.26% | +13.71% | +20.53% | +20.92% | +33.62% |
| Technology | +3.95% | +7.75% | +30.74% | +26.48% | +24.77% | +47.72% |
| Financial | +2.24% | +5.78% | +12.08% | +2.25% | +1.54% | +15.70% |
| Basic Materials | +1.77% | +3.35% | +9.20% | +16.16% | +14.37% | +41.99% |
| Utilities | +1.08% | +0.04% | −3.63% | +4.24% | +4.48% | +13.71% |
| Communication Services | +0.93% | −4.55% | +6.60% | +3.13% | +1.86% | +24.93% |
| Consumer Cyclical | +0.44% | −0.03% | +6.34% | −5.25% | −4.03% | +8.04% |
| Consumer Defensive | −2.21% | −5.21% | +0.93% | +4.58% | +6.28% | +5.01% |
| Real Estate | −2.23% | +0.07% | +4.49% | +7.04% | +7.30% | +6.15% |
| Healthcare | −2.28% | +1.61% | +2.71% | −2.09% | −2.66% | +12.91% |
| Energy | −5.96% | −11.94% | −9.25% | +23.48% | +20.00% | +22.20% |
TOP WEEKLY MOVERS:
All five weekly gainers share a single theme: the AI supply chain from silicon (INTC +14.6%) to memory (WDC +41%, SNDK +16%, STX +23%) to power infrastructure (GEV +22%) — the week’s leaderboard is an end-to-end slice of the AI buildout thesis. Multi-year momentum across every gainer (SNDK +4,586% Year, WDC +1,161%, STX +715% per the underlying screener) confirms regime-leadership moves, not counter-trend bounces — yet the Tuesday −6% to −10% single-session reversal across the same names (on BofA’s “most crowded trade” designation) proved the crowding risk is real. The decliners were split: Energy names (CVX, XOM) on Iran deal supply normalization, and AI-disruption losers (IBM) on Accenture’s consulting guidance cut revealing the services-layer impairment in the P&L for the first time.
TOP 5 WEEKLY GAINERS
| Ticker | Week | YTD | Year | Why It Moved |
|---|---|---|---|---|
| WDC | +40.99% | +333.17% | +1160.74% | Computex 2026 AI storage showcase (Ultrastar Data 3000 JBODs); JPMorgan raised PT to $650; Morgan Stanley upgrade projecting HDD demand growing 40–50%/yr vs. 30–35% supply through 2028, raising 2028 EPS estimates 70% above consensus. Sixth consecutive day of gains by Thursday. Structural supply deficit is the thesis, not near-term momentum. |
| STX | +23.29% | +288.62% | +715.10% | Correlated with WDC on AI storage infrastructure bottleneck thesis; Computex 2026 AI storage demand wave; Morgan Stanley bullish note on HDD structural demand deficit. Dividend announcement ($0.74, ex-date June 24) provided an additional catalyst. YTD +289% confirms regime leadership, not a bounce. |
| GEV | +22.38% | +69.80% | +126.39% | Bernstein SocGen initiated with Outperform, citing record backlogs and AI data center electricity demand (AI’s primary bottleneck has shifted from chips to power). US-Iran MoU also positive: the deal supports large-scale capital investment in GEV’s gas power, grid electrification, and wind turbine businesses. EPS estimates revised +72.92% for 2026. |
| SNDK | +16.12% | +820.36% | +4586.29% | Thursday surge on Trump’s Apple–Intel foundry announcement (broad semiconductor complex rerate); Morgan Stanley raised SNDK earnings estimates on AI memory upcycle; Apple’s pricing signal confirming rising memory costs validated the structural demand thesis. SNDK’s +4,586% Year gain makes this momentum continuation, not reversal. |
| INTC | +14.56% | +263.12% | +523.50% | Triple catalyst: BofA double upgrade (Underperform to Buy, prior week, $135 PT, $170B server CPU TAM by 2030) carried momentum into the week; Thursday’s Trump Truth Social confirmation that Apple will use Intel’s IFS 18A-P process for domestic chip production drove +10.6% on the day alone; Intel named new EVP of Intel Foundry on the same day. Historic foundry thesis validation. |
TOP 5 WEEKLY DECLINERS
| Ticker | Week | YTD | Year | Why It Moved |
|---|---|---|---|---|
| IBM | −9.37% | −15.90% | −12.04% | Accenture’s −16–18% guidance cut (FY26 revenue growth slashed to 3–4%, new bookings −2%) triggered IT-services sector selloff Thursday; IBM separately released a study showing 91% of enterprise execs lack full visibility into their AI dependencies. IBM Consulting grew just 1% in Q1 2026 — the structural AI-substitution threat to the services layer arrived in P&L form. IBM YTD −15.90% = structural underperformer, not a bounce candidate. |
| CVX | −6.56% | +13.92% | +17.17% | US-Iran peace deal collapsed the Hormuz geopolitical risk premium that drove Energy’s YTD +28% leadership. WTI fell from $84 to $76 over 4 sessions as Iran oil sanctions waiver and Hormuz reopening were formalized. Jefferies Buy rating on June 15 could not overcome the macro oil price decline. CVX’s YTD +13.92% suggests longer-term holders are still profitable — but the near-term oil path is structurally bearish. |
| XOM | −6.00% | +14.52% | +21.75% | Same Iran supply normalization driver as CVX. US-Iran interim agreement signed June 17, with first tanker re-transits underway by Thursday. BofA upgraded XOM to Buy June 15 (Neutral previously) — positive catalyst insufficient to offset the structural oil price decline thesis as Iranian barrels approach market return. |
| MRK | −5.71% | +8.18% | +43.61% | CMS proposed locking in lower prices in Medicare drug price negotiation program (June 15); ex-dividend date June 15 (natural selling around dividend capture); Healthcare sector rotation out as Iran deal reduced defensive positioning. Capvaxive FDA additional indication approval was positive but insufficient to offset pharma-pricing headwinds. |
| LLY | −5.37% | +2.22% | +39.94% | Profit-taking after strong 12.5% 1-month run; Novo Nordisk sought China approval for Wegovy pill on June 15 (intensifying GLP-1 rivalry); same Medicare drug pricing headwinds as MRK; acquired 4E Therapeutics (June 16). Rotation away from defensive dividend-payers as Iran deal reduced the geopolitical safe-haven bid in healthcare names. |
C. WEEK’S TOP STORIES -> TOP
Three threads shaped the week. The geopolitical arc (#1) transformed the US-Iran Hormuz standoff into a formalized 60-day ceasefire — WTI’s −9% WoW is the CPI variable of 2026 now in motion. The monetary arc (#2) arrived the same week: Warsh’s debut FOMC dismantled the rate-cut thesis that anchored 2025 equity valuations in a single press conference. Both arcs pull on the same inflation variable in opposite directions — the tension between them defines the H2 outlook. The AI arc (#3, #4, #6, #7) ran on its own logic: hardware validated at a SOX record, consulting impaired, SpaceX revalued its entire business model in week one.
UNCERTAIN
1. US-Iran Peace Deal: From Draft MoU to 60-Day Hormuz Ceasefire — WTI −9% to $76.58 This Week; Geneva Signing Scheduled for Juneteenth (June 19)
The core facts:The US-Iran peace framework evolved through three distinct stages across four trading days. Monday (Jun 15): Washington, Tehran, and Pakistani negotiators confirmed a Memorandum of Understanding signing set for Friday in Switzerland; WTI fell 4.2% to $81.32 as markets priced out the Hormuz supply premium. Wednesday (Jun 17): The 60-day ceasefire MoU was formally signed — key terms: removal of US naval blockade of Iranian ports, resumption of Iranian crude exports immediately, oil sanctions waived (not eliminated), Strait of Hormuz opened to toll-free transit. First tankers began re-transiting the Strait by Thursday. WTI fell another 5% to ~$75, settling the week at $76.58 vs. $84.24 last Friday (−9.1% WoW). Thursday (Jun 18): The EIA reported the 10th consecutive weekly crude draw (−8.26M barrels); US commercial crude stocks at a 40-year low — providing a near-term price floor. The IEA’s June Oil Market Report projected a 5 mb/d global supply surplus in 2027 as Iranian barrels return. A formal Geneva signing ceremony was scheduled for Friday June 19 — a US market holiday (Juneteenth) — with follow-on nuclear talks to begin immediately after.
Why it matters:The Hormuz risk premium has been the primary driver of elevated oil prices and the inflation overhang that locked the Fed out of cuts in 2026. The energy component rose +23.5% YoY and drove May CPI to 4.2%. WTI at $76 with a credible path to $70–73 (if the IEA’s 2027 supply-surplus projection materializes) changes the H2 CPI arithmetic: if June and July prints land near 3.0–3.5% on energy normalization, the case for rate hikes weakens and the easing debate reopens. The UNCERTAIN classification reflects two layers: (1) the Geneva signing is still the risk event for this weekend — any breakdown immediately reverses WTI, energy sector, defense stocks, and precious metals; (2) the MoU is a 60-day bridging framework, not a permanent peace agreement. Iran’s crude ramp takes 4–8 weeks to reach global markets, meaning the supply relief is weeks away even if the signing holds. The IEA’s 2027 surplus projection (+8 mb/d supply surge) is the structural ceiling on energy sector valuations regardless of near-term oil prices.
What to watch:Geneva signing outcome — this weekend’s critical binary (success = Iran energy trade continues; breakdown = WTI spike, energy/defense/gold reverse). First Iranian crude export manifests (4–8 weeks). EIA weekly crude inventory (June 24) for first signal of whether Iranian supply is reaching US markets. OPEC+ production response as the Saudi-led counterbalance. June CPI (mid-July) as the first quantified test of the energy disinflation thesis.
BEARISH
2. Warsh’s Debut FOMC Dismantles the Rate-Cut Thesis: 9 of 18 Members Project 2026 Hike; Easing Bias Stripped; 2Y Yield Hits 14-Month High of 4.179%
The core facts:Tuesday (Jun 16): Warsh’s inaugural two-day FOMC meeting opened. Pre-meeting data was already hawkish: housing starts −15.4% to 1.177M (weakest since May 2020, 18% miss vs. consensus) and import prices +6.7% YoY (highest since August 2022) arrived simultaneously. Wednesday (Jun 17): May retail sales printed +0.9% MoM (4th consecutive beat, +6.9% YoY) hours before the decision, handing the committee full hawkish cover. The FOMC voted 12-0 to hold rates at 3.50–3.75% but stripped all easing bias from the statement — a dramatically shortened policy release. The dot plot shifted: 9 of 18 members projected at least one 2026 hike; median year-end 2026 FFR moved to 3.8% from 3.4% in March. Warsh did not submit his own dot projection, and signaled fewer future press conferences. 2Y Treasury yield surged +15 bps to 4.21% on the day; VIX +12.31%; S&P −1.21%, Dow −507 pts. Polymarket: hike probability 37% → 58% (post-FOMC); cut probability 30.2% → 18.5%. Thursday (Jun 18): Philly Fed Prices Paid surged to 53.2 (from 47.9), providing a second consecutive hawkish data point. Markets absorbed the FOMC shock by Thursday’s close: S&P recovered +1.09% as Apple–Intel and AI hardware decoupled from rate anxiety.
Why it matters:Warsh’s debut resets the 2026 monetary policy framework entirely. Markets entered the week pricing some probability of rate cuts; they exited pricing a potential hike. The removal of easing bias — combined with 9 of 18 members projecting a hike — marks a structural break from the prior rate-cutting narrative that underpinned 2025’s equity expansion and early 2026’s valuations. Warsh’s communication overhaul (fewer press conferences, compressed statement) structurally increases policy uncertainty for the rest of the year — future meetings will carry higher surprise risk. For equity portfolios: this removes the rate-cut catalyst that anchored growth-equity valuations in 2025 and raises the discount rate for all long-duration assets. Rate-sensitive sectors (REITs, utilities, homebuilders, high-multiple tech) face systematic repricing. The session’s breadth signal confirmed markets read this as rate-fear, not recession fear: VIX +12.31% but no safe-haven gold bid (gold −1.68%); 2Y surged while 10Y only rose 6 bps — front-loaded hike pricing, not long-run growth deterioration. The market’s fast recovery Thursday (S&P +1.09%) on Apple–Intel confirms that AI infrastructure is treated as rate-cycle-agnostic, even as rate-sensitive sectors remain pressured.
What to watch:September FOMC as the earliest plausible hike window — CME FedWatch hike odds for September as real-time calibration. June NFP (July 3) as the first major post-FOMC labor market test. June PCE (late June) — the data that will determine whether September is live or academic. Warsh public speeches for signals on how he operationalizes “fewer press conferences.”
BULLISH
3. AI Semiconductor Supercycle: Computex Drives PHLX +7.9% (Mon), BofA “Most Crowded Trade in History” Triggers −6–10% Rout (Tue), Apple–Intel Foundry Confirmation Sets SOX Record (Thu)
The core facts:Monday (Jun 15): Computex 2026 ignited the week: WDC +16.1% to $653.53 (JPMorgan PT raised to $650); MU +10.9%; MRVL +10.4%; PHLX Semiconductor Index (SOX) +7.9% — its largest single-session gain since April 2025. Key announcements: Micron’s HBM4 sold out through year-end; NVIDIA–SK Hynix multi-year supply cooperation signed; Western Digital showcased Ultrastar Data 3000 JBODs; Morgan Stanley upgraded WDC projecting HDD demand growing 40–50%/yr vs. 30–35% supply through 2028 (2028 EPS est. raised 70% above consensus). Tuesday (Jun 16): Bank of America’s June fund manager survey revealed 80% of respondents classify semiconductors as “the most crowded trade in history.” MRVL −9.78%, INTC −8.45%, KLAC −7.44%, AMD −7.30%, MU −6.18%; Technology sector −2.52%. Wednesday (Jun 17): AI hardware decoupled from the FOMC selloff — AVGO +4.30%, AMAT +4.35%, MRVL +3.90%, WDC +4.56% against a −1.21% S&P tape. Thursday (Jun 18): President Trump confirmed on Truth Social that Apple has agreed to work with Intel to design and manufacture chips domestically using Intel’s 18A-P process node (MacBook M7 SoC target, mass manufacturing late 2027). SOX surged 6% to a record high. INTC +10.6%, SNDK +11.5%, MU +8.7%, KLAC +8.7%, MRVL +7.3%.
Why it matters:The week’s intra-week volatility pattern — SOX +7.9% Monday, −6–10% Tuesday, recovery Wednesday, SOX record Thursday — is the most analytically revealing semiconductor week of 2026. The BofA “most crowded trade” designation (80% of fund managers) is historically a 3–6 month underperformance precursor. Yet the Thursday Apple–Intel catalyst drove a full recovery to a record, confirming that structural earnings growth visibility can override crowding risk in the near term. Apple as the world’s most demanding chip customer committing to Intel’s IFS validates the US domestic semiconductor reshoring thesis at a scale that no government contract or analyst note could provide: the company that built its supply chain advantage on TSMC’s Taiwan fabs is now committing to domestic production. The SOX at a record on a hawkish FOMC week confirms institutional managers are treating AI infrastructure capex as rate-cycle-agnostic — demanding, not cyclical. WDC’s +41% WoW and INTC’s +14.6% WoW are the week’s top two mega-cap performances (see B4 Sector rotation table).
What to watch:Intel’s 18A-P yield milestones as the critical execution risk — Apple’s shift to IFS only scales if Intel achieves competitive yields. Nasdaq-100 SPCX inclusion timing as the next passive-buying trigger. Micron Q3 FY2026 earnings (late June) — the first quantification of HBM4 demand in reported revenue. Apple formal confirmation of Intel deal scope (not yet issued as of Thursday).
UNCERTAIN
4. SpaceX (SPCX): Day 2 +19% to $2.8T (Passes Amazon); $60B All-Stock Cursor AI Acquisition; Options Unlock Enables First Institutional Shorts; Correction to ~$185
The core facts:Monday (Jun 15): SPCX +19.6% Day 2 to $192.46 — market cap crossed $2.5T, surpassing Apple as world’s largest public company. Elon Musk publicly projected $1 trillion in SpaceX annual revenue by 2030. Tuesday (Jun 16): SpaceX filed an SEC Form 8-K announcing a definitive agreement to acquire Anysphere Inc. — developer of Cursor, the leading AI-powered coding tool — in a $60 billion all-stock transaction. SPCX valuation crossed $2.8T, surpassing Amazon as the 5th-largest US public company. Options on SPCX began trading Wednesday. Thursday (Jun 18): SPCX fell as much as −10.3% intraday — the first session where institutional bears could use options to short the stock. IPO prospectus disclosures drew scrutiny: $4.9B net loss in 2025, $4.28B net loss in Q1 2026 alone, with Starlink the only profitable segment. SPCX closed the week approximately $185 — ~37% above the $135 IPO price but down materially from the $201 intraday high on Tuesday. (See also: B4 Gainers — SPCX was not in the top-5 gainers this week, which only covers names that gained WoW; SPCX ended the week below Monday’s open.)
Why it matters:A $60B acquisition in week 1 of public trading is unprecedented and reveals a strategic pivot that was not in the IPO thesis: SpaceX is using its newly minted public equity as acquisition currency to enter AI developer software (Cursor) alongside its hardware infrastructure (rockets, Starlink). This broadens the SpaceX thesis dramatically but adds execution risk — integrating Cursor’s AI coding platform into SpaceX’s engineering stack requires a product strategy that hasn’t yet been explained publicly. Options unlocking restored the two-sided market: without options in days 1–2, institutional bears could not participate in price discovery, allowing momentum buyers to push prices toward $201. At $2.8T valuation with $9B+ in annual losses, SPCX prices extraordinary future profitability from Starlink global satellite expansion and Starship heavy-lift commercialization — timelines measured in years. The UNCERTAIN classification reflects the binary nature of this week: still ~37% above IPO price but with $60B acquisition risk, options-enabled downside discovery, and no precedent for a company at this valuation scale with this loss rate going public.
What to watch:Nasdaq-100 inclusion announcement (expected within weeks per Nasdaq’s rewritten eligibility criteria) — this passive buying trigger will compress the float against institutional demand. DOJ antitrust review of the Cursor acquisition. SPCX sustaining above $135 IPO price as the institutional confidence threshold. Starlink subscriber growth and monthly ARPU as the first fundamental anchor for the $1T revenue projection.
BEARISH
5. Housing Structural Contraction Deepens: NAHB 35 (26th Sub-50 Month), May Starts −15.4% to 1.177M (Weakest Since May 2020); Pending Sales +3.8% Creates Demand/Supply Split
The core facts:Monday (Jun 15): NAHB June Housing Market Index came in at 35 — the 26th consecutive month below 50, the longest sustained contraction in the index’s modern history. 35% of builders cutting prices (up from 32%); buyer traffic at 25 (near historic lows); mortgage rates at 6.6%. Tuesday (Jun 16): Housing Starts collapsed −15.4% MoM to 1.177M SAAR — the weakest reading since May 2020, 18% below the 1.430M consensus. Building Permits were relatively stable at 1.413M (−0.7%), creating a sharp starts/permits divergence. The Atlanta Fed GDPNow revised Q2 2026 growth down to 2.8% from 3.3% on the data. Wednesday (Jun 17): Pending Home Sales +3.8% MoM vs. 0.8% expected — nearly 5x the consensus — across all four US census regions. NAR cited “pent-up demand” and consumer acceptance of 6%+ mortgage rates. Thursday (Jun 18): Freddie Mac 30-year mortgage rate fell to 6.47% (1-month low) as the Iran deal’s energy-price relief reduced the inflation premium embedded in Treasury yields.
Why it matters:The starts collapse (−15.4%) vs. permits near-flat (−0.7%) creates the most important housing market split of the cycle: buyers want to transact (pending sales +3.8%) but builders are stopping construction. This is structurally bullish for home prices (demand present, supply contracting) but bearish for the economy (residential investment is a direct GDP component — the GDPNow revision to 2.8% captures this). The Warsh FOMC’s hawkish pivot Wednesday could push mortgage rates back toward 6.75–7.0%, potentially capping the pending-sales recovery before it converts to closings — a classic monetary policy transmission risk. The 26-month continuous sub-50 NAHB reading (the longest in modern history) represents a structural demand suppression that is not self-correcting at current rates. Iran deal energy relief (30-year mortgage down to 6.47%) is the counterforce, but it depends entirely on the Geneva signing holding.
What to watch:June Housing Starts (mid-July) — can the permits-starts divergence close as mortgage rates ease? 30-year mortgage rate trajectory post-Geneva signing. Homebuilder Q2 2026 earnings calls (July) for cancellation rates, new order volumes, and guidance on whether the NAHB sub-50 streak is ending.
BEARISH
6. Accenture −16–18%: AI Bifurcation Arrives in the P&L — FY26 Revenue Growth Cut to 3–4%, New Bookings −2%; IBM −5% Sympathetically on the Same Day as the SOX Record
The core facts:Thursday (Jun 18): Accenture (ACN) reported fiscal Q3 2026 results: EPS beat ($3.80 actual vs. $3.71 estimate) but cut full-year revenue growth guidance to 3–4% (from 3–5%); Q4 revenue guidance $17.75–18.4B vs. $18.47B consensus. New bookings declined 2% for the quarter ended May 31 — the leading signal that the consulting pipeline is contracting. Reasons: AI disruption compressing consulting model, cautious enterprise IT spending, material drag from US federal government business. ACN fell 16–18% — worst single-day decline in years. IBM fell ~5% sympathetically. Note: ACN is Irish-domiciled at ~$78B market cap (below the Earnings Watch $100B threshold; covered here for its sector-level market signal). The announcement occurred on the same Thursday when the SOX hit a record high on the Apple–Intel foundry deal — hardware and consulting diverged in the P&L simultaneously.
Why it matters:New bookings declining 2% at Accenture is the forward signal that matters: enterprise clients are pausing or reducing discretionary IT consulting projects while evaluating whether AI agents can perform that work at lower cost. AI deal announcements are increasing, but AI deal revenue has not yet scaled to replace the traditional consulting revenue that AI is simultaneously cannibalizing. The Accenture print on the day of the SOX record captures the week’s defining structural dynamic in one session: AI hardware infrastructure (silicon, memory, power) is in a demand boom; the human services layer built on top of IT systems is in early-stage structural compression. IBM’s −5% sympathetic move confirms the market reads this as sector-wide — Infosys, Wipro, Cognizant, Oracle consulting, and SAP professional services all face the same model risk. IBM separately released a study showing 91% of enterprise executives do not fully understand their AI dependencies — the very opacity driving clients to evaluate AI substitution rather than commit to consulting engagements.
What to watch:IBM Q2 2026 earnings (late July) for the first direct evidence of consulting revenue compression at scale. Oracle and SAP professional services guidance updates. Salesforce, ServiceNow Q2 earnings — where AI substitution risk for seat-based software compounds the consulting threat. Accenture’s Q4 FY2026 new bookings (next report) as the leading indicator of whether the pipeline stabilizes.
BEARISH
7. Meta −5.44%: AI Head of Product Departs a Freshly Created Role; School Addiction Trial Strips Section 230 Design Protections; $145B CapEx Overhang Compounds Risk
The core facts:Wednesday (Jun 17): Reuters reported that Emily Dalton Smith — Meta’s Head of AI Product for its “AI for Work” transformation initiative, appointed approximately two months earlier as part of a company-wide AI reorganization — is leaving Meta. The departure from a freshly created role at the center of Meta’s highest-priority AI execution track is the primary catalyst. META fell −5.44% — worst single-day mega-cap decliner of the week. Background: the federal multidistrict school addiction bellwether trial commenced June 15, with design defect claims having stripped Section 230 liability protections for algorithmic recommendation systems. Meta’s 2026 CapEx guidance: $125–145B. Thursday (Jun 18): Meta separately secured AI computing agreements with Crusoe — advancing AI infrastructure buildout independent of product leadership questions.
Why it matters:Emily Dalton Smith’s departure from a freshly appointed role is characteristic of either a strategic pivot or management friction at the most critical point of Meta’s AI transformation — precisely when execution of the $145B capex thesis needs to begin delivering AI-agent product revenue. Losing the product lead on AI-agent capabilities at this stage raises the question: is the strategy intact, or is there internal disagreement about execution approach? This is not a routine executive transition. The school addiction trial creates a separate open-ended legal liability: if design defect claims succeed in this bellwether case, Meta’s platform architecture faces injunctive risk beyond financial penalties — potentially forcing redesigns of core algorithmic recommendation systems that drive advertising revenue. The combination — AI product leadership gap, $145B capex commitment without near-term AI revenue justification, and legal liability — creates a multi-front headwind entering Q2 earnings season. The Crusoe computing deal (Thursday) confirms AI infrastructure execution is proceeding independently, but the product layer is the unresolved risk.
What to watch:Meta’s replacement appointment for Head of AI Product — timing and seniority as a signal of organizational health. Q2 2026 earnings (late July) for first AI-agent product revenue metrics and CapEx guidance confirmation. School addiction trial jury verdict or settlement as the legal liability quantification event. Any court injunction seeking to alter Meta’s algorithmic recommendation systems prior to trial conclusion.
D. WEEK IN THE ECONOMY -> TOP
A stagflation pulse defined the week’s data: import prices hit 6.7% YoY — highest since August 2022, with tariff cost-push spreading beyond fuel into capital goods — on the same week housing starts plunged −15.4% to a 6-year low. The Fed answered with a decisive framework reset: Warsh’s debut FOMC stripped all easing bias and had 9 of 18 members projecting a 2026 hike, pushing Polymarket hike odds from 47% to 58% WoW while 2Y yields rose 9.2 bps to a 14-month high (see Vol & Treasuries table in Section B). Simultaneously, the Iran deal’s disinflation impulse (WTI −9% WoW; energy sector −5.96%) reopened cut probability from ~3% to 18.5% — the two forces produced the most complex dual-signal week of 2026. Tuesday’s S&P Global Flash Manufacturing PMI will determine whether Philly Fed’s Prices Paid spike at 53.2 was regional noise or the national factory-gate re-acceleration that would lock in the September hike case.
POLYMARKET ODDS — WEEK-ON-WEEK SHIFT:
| Market | Last Friday (Jun 12) | This Thursday (Jun 18) | Δ |
|---|---|---|---|
| US Recession by end-2026 | ~19% | 13% | −6 pp |
| Fed rate hike in 2026 | 47% | 58% | +11 pp |
| Fed rate cuts ≥1 in 2026 | ~3% | 18.5% | +15.5 pp |
Note: This week’s Polymarket odds reflect competing forces. The Iran deal (oil −9% WoW) reopened cut probability from near-zero to 18.5%; Warsh’s hawkish FOMC simultaneously drove hike odds to 58%. The net result is the most complex dual-signal Polymarket week of 2026: recession odds declined (BULLISH), hike odds rose (BEARISH), and cut odds rose from near-zero on Iran disinflation (BULLISH for rate-sensitives long-term). Thursday’s odds; Jun 19 was Juneteenth — markets closed.
UNCERTAIN
1. Retail Sales +0.9% MoM in May — 4th Consecutive Beat, +6.9% YoY; GDPNow Revised to 3.0%; “Good News Is Bad News” as Strong Consumer Handed Warsh Hawkish Cover (Census Bureau, Wed Jun 17)
What they’re saying:Advance retail sales May +0.9% MoM (vs. +0.5% expected) — the 4th consecutive monthly beat. Control group (the cleanest GDP proxy) +0.7% vs. +0.4% consensus. YoY growth: +6.9%, fastest since Q4 2022. Atlanta Fed GDPNow revised to 3.0% from 2.8% (Tuesday’s housing starts had cut it to 2.8% the prior day — consumer spending reversed it within 24 hours). The data arrived at 8:30am ET — hours before the 2:00pm FOMC decision.
The context:The 4th consecutive beat at +6.9% YoY is structurally incompatible with rate cuts when PCE sits at 4.2%. Consumer spending at this pace gave the FOMC committee all the data justification needed to strip easing bias and shift the dot plot toward hikes. This is the “good news is bad news” dynamic formalized: strong demand = Fed justified in tightening = equity multiple compression. The initial equity rally on the strong print (+0.5% before noon) reversed to −1.21% after the FOMC decision. The 4-quarter streak of beats also undermines any soft-landing narrative that requires consumption moderation to bring inflation down — consumers appear structurally unaware of the policy tightening that is needed to stop them.
What to watch:June retail sales (July 15) — a 5th consecutive beat would eliminate any remaining dovish argument heading into the September FOMC. June PCE (late June) as the first post-FOMC consumer spending read. Whether Iran-related energy price relief translates into real spending increase or just nominal stabilization.
BEARISH
2. May Housing Starts −15.4% to 1.177M SAAR (Weakest Since May 2020), 18% Miss; NAHB June 35 (26th Sub-50); Pending Sales +3.8% Reveals Demand/Supply Split (Census Bureau / NAHB / NAR, Mon–Wed)
What they’re saying:NAHB June HMI: 35 (prior 37, cons. 36) — 26th consecutive month below 50; 35% of builders cutting prices (up from 32%); traffic 25. Housing Starts: 1.177M SAAR May (−15.4% MoM, −8.7% YoY, 18% miss vs. 1.430M consensus) — weakest since May 2020. Building permits 1.413M (−0.7%, near-flat). GDPNow cut to 2.8% (reversed same day by retail sales). Pending Home Sales: +3.8% MoM (vs. 0.8% cons.) — all four regions positive; NAR cited pent-up demand and 6%+ rate acceptance. 30-year mortgage: 6.47% (Thursday, 1-month low) on Iran deal inflation relief.
The context:The permits-starts divergence (permits −0.7%, starts −15.4%) is the key analytical signal: builders aren’t cancelling plans, they’re delaying groundbreakings — a “wait-and-see” posture that could reverse if mortgage rates continue declining. The demand/supply split is bearish for the macro but creates housing price persistence: buyers want to transact (pending sales +3.8%) but supply is contracting sharply. The Warsh hawkish FOMC Wednesday competes directly with the Iran deal’s mortgage-rate relief: if the hike signal pushes 30-year rates back toward 6.75–7.0%, the pending-sales recovery caps before converting to closings.
What to watch:June Housing Starts (mid-July) for whether the permit-starts gap closes. 30-year mortgage rate post-Geneva signing. Homebuilder Q2 earnings (July) for cancellation rates and forward order volumes.
BEARISH
3. May Import Prices +1.9% MoM vs. +1.0% Expected; YoY Surges to 6.7% — Highest Since August 2022; Tariff Cost-Push Broadening Beyond Fuel into Capital Goods (BLS, Tue Jun 16)
What they’re saying:May import prices +1.9% MoM (nearly double the +1.0% consensus). YoY +6.7% — highest since August 2022. Breakdown: fuel import prices +12.5% MoM; nonfuel +0.8%; capital goods +1.3%. Export prices +1.3% MoM; YoY +11.2%. Data arrived alongside Tuesday’s housing starts catastrophe.
The context:The nonfuel (+0.8% MoM) and capital goods (+1.3% MoM) acceleration is the structural concern: tariff cost-push is broadening beyond the Iran energy shock into durable goods and business equipment. This is the two-track inflation problem — Iran deal reduces the energy CPI component, but tariff-driven goods inflation keeps building independently. Capital goods at +1.3% MoM signals that business investment costs are rising, compressing corporate margins on top-line growth. The data arrived on FOMC Day 1 and all but locked in Warsh’s hawkish dot-plot the following morning. For June CPI: the pipeline from import prices to consumer prices runs 1–3 months, meaning July CPI could reflect May’s import price surge even if June energy prices fall further.
What to watch:July CPI (mid-July) for import price pass-through to consumer goods. Any tariff de-escalation announcement with Vietnam, Bangladesh, Cambodia — the primary sources of nonfuel import price acceleration. June PPI (mid-July) as the first post-Iran-deal pipeline read.
UNCERTAIN
4. Philadelphia Fed Surges to 10.3 in June (from −0.4 in May) — Manufacturing Recovers — BUT Prices Paid Spike to 53.2, Sharpest Monthly Inflation Acceleration in Over a Year (Philadelphia Fed, Thu Jun 18)
What they’re saying:Philadelphia Fed General Activity Index: +10.3 (vs. +10.0 consensus, vs. −0.4 prior) — broke 2-month contraction streak. New Orders jumped to 27.3 from −1.7; Employment +7.9 (from −2.8); CapEx rose to 41.2. Prices Paid: 53.2 (from 47.9) — sharpest monthly jump since early 2025. By contrast, Empire State Manufacturing (Monday) missed badly: 5.7 vs. 14.0 consensus (near-triple miss), new orders near stall at 3.5; supply availability −13.9 (worst since June 2022). Industrial Production May: +0.1% vs. +0.3% expected; manufacturing output flat.
The context:The week’s manufacturing data sent conflicting regional signals: Empire State (Monday) confirmed tariff front-running demand reversal; Philly Fed (Thursday) showed a V-shaped recovery with accelerating input inflation. The Prices Paid spike at 53.2 — comfortably above 50, expanding — one day after Warsh’s inaugural hawkish FOMC creates a second consecutive hawkish data point that narrows the window for any dovish course correction. Manufacturing recovering while input inflation accelerates is the factory-floor stagflation configuration that Warsh cannot accommodate with a cutting bias. The UNCERTAIN classification reflects the genuine ambiguity: is this national or regional? ISM Manufacturing July 1 is the arbiter.
What to watch:S&P Global Flash US Manufacturing PMI (Tuesday, June 23) — first national read on whether Philly Fed’s Prices Paid spike was regional or national. ISM Manufacturing Prices Paid (July 1) — the definitive national signal. June PPI (mid-July) for pipeline confirmation.
UNCERTAIN
5. Initial Jobless Claims 226K (Inline); Continuing Claims 1,810K — Creeping +50K Since Mid-April; First Post-Warsh Labor Read Fails to Deliver a Clean Hawkish or Dovish Signal (DOL / BLS, Thu Jun 18)
What they’re saying:Initial claims week ending June 13: 226K (vs. 225K consensus, vs. 230K prior) — slightly improved, broadly inline. Continuing claims week ending June 6: 1,810K — up ~50K since mid-April. Conference Board LEI +0.1% (inline); six-month deterioration rate slowed sharply from −1.3% to −0.3%. 30-year mortgage rate: 6.47% (Thursday, 1-month low) as Iran deal reduced energy inflation premium in Treasury yields.
The context:The first post-FOMC labor read was carefully watched as a potential dovish offset to Warsh’s hawkish pivot. The result is deliberate ambiguity: no layoff surge (initial claims at 226K, healthy) but a persistent drift in continuing claims (+50K since mid-April) suggesting workers are taking incrementally longer to find new jobs. Not enough weakness to force a dovish course correction, not enough strength to confirm September hike with conviction. The LEI’s deceleration in its six-month deterioration rate (from −1.3% to −0.3%) is a tentative stabilization signal — but the gain was financially driven (equity rally, yield curve), not from hard activity components. The 30-year mortgage rate reaching a 1-month low (6.47%) on Thursday is the most concrete near-term positive: each basis point decline from Iran energy relief materially improves housing affordability.
What to watch:Continuing claims approaching 1,850K as the dovish threshold that could meaningfully challenge the September hike case. Initial claims above 240K as the first material labor deterioration signal. June NFP (July 3) — the definitive first post-FOMC labor test that Warsh’s committee will weigh against the Philly Fed Prices Paid spike.
E. WEEK IN EARNINGS -> TOP
TOP EARNINGS OF THE WEEK
BULLISH
1. Progressive Corp (PGR): −0.12% on FOMC reaction day | Monthly Beat — Net Income +36% YoY, Combined Ratio 82.1 (−4.8 pts YoY): Best Underwriting Profitability Reading in Years
The Numbers:Progressive reported May 2026 monthly operational metrics BMO Wednesday June 17. Net premiums written: $7.027B (+6% YoY). Net income: $1.445B (+36% YoY). Combined ratio: 82.1 (down 4.8 percentage points YoY — significant underwriting profitability improvement). Policies in force: 39.97 million (+8% YoY). EPS for the monthly period: $3.80 actual vs. $3.71 estimate (+2.43% beat). Note: Progressive releases monthly operational metrics; Q2 2026 full quarterly results are scheduled for July 9, 2026.
The Problem/Win:The combined ratio of 82.1 — down 4.8 points year-over-year — is the headline win. A combined ratio below 100 signals underwriting profitability; 82.1 means Progressive earns $0.18 of pre-investment underwriting profit for every $1.00 of premium collected, and the 4.8-point year-over-year improvement signals prior-year rate increases are flowing through with reduced loss frequency and severity. Net income of $1.445 billion for a single month is a standout number. Policy-in-force growth of 8% demonstrates Progressive is gaining market share as a lower-cost provider — not sacrificing premium volume for underwriting quality. The stock’s −0.12% reaction was purely FOMC macro noise (the S&P fell −1.21% that day), not a reflection of PGR’s underlying results.
The Ripple:Progressive’s 8% policy-in-force growth with superior underwriting profitability compresses the investment thesis for Allstate (ALL), Travelers (TRV), and State Farm: competitors are either ceding market share or accepting higher loss ratios to defend it. Within the Financials sector (which gained +2.24% WoW despite the FOMC), PGR’s results provide a counterweight to rate-driven anxiety — insurance underwriting profitability is not rate-sensitive in the same way as bank NIM, making PGR a defensive quality anchor within the sector.
What It Means:Progressive continues to operate at the top of the auto insurance industry’s profitability cycle. The −0.12% stock reaction is macro noise, not a fundamental verdict — these results confirm PGR’s earnings trajectory is intact. Any FOMC-driven Financials sector weakness is a quality-entry signal for PGR given its insulation from rate sensitivity.
What to watch:Q2 2026 full quarterly earnings (July 9) — the cumulative quarter view on combined ratio trends and whether the 82.1 reading represents a sustainable floor or a peak. Competitor combined ratios from ALL and TRV in July for market-share context. Tariff-driven auto repair cost inflation as the primary claims cost risk in H2 2026.
WEEK AHEAD PREVIEW:
Q1 2026 earnings season is effectively complete (89% reported as of June 17). No major reporters are expected Friday, June 19 — Juneteenth National Independence Day, a federal holiday on which US equity markets are closed. The formal US-Iran peace signing ceremony is scheduled for Geneva on Friday; any breakdown in final terms would be the primary market risk event of the holiday weekend.
Q2 2026 earnings season opens approximately mid-to-late July, with the first major financials and technology reporters expected around July 11–15, 2026. Key themes entering Q2 earnings season: (1) bank net interest margin guidance under Warsh’s potential-hike scenario; (2) AI hardware revenue vs. capex ROI validation for hyperscalers; (3) IT consulting revenue trajectory as Accenture’s guidance cut raises sector-wide questions about AI substitution pace; (4) homebuilder cancellation rates and order volumes against a 6%+ mortgage rate backdrop; (5) energy E&P guidance under $76 WTI vs. models built on $85–90 assumptions.
F. NEXT WEEK SETUP -> TOP
UPCOMING RELEASES:
| Date | Event | Why It Matters |
|---|---|---|
| Fri, Jun 19 | Juneteenth — US Markets Closed; Iran-US Geneva Formal Signing Ceremony | No US trading, but the Geneva signing is the most critical near-term geopolitical event: a breakdown would reprice WTI, defense stocks (RTX, LMT), and precious metals sharply at Monday’s open. A successful signing extends the Iran de-escalation trade into next week and hardens the WTI −9% WoW energy disinflation thesis. |
| Tue, Jun 23 | S&P Global Flash US Manufacturing PMI (June) | First national manufacturing read since Philly Fed’s 10-point surge with Prices Paid spiking to 53.2. Confirms or refutes whether factory-gate inflation acceleration is a regional signal or a national trend — the critical data point for pricing September FOMC hike probability. A national Prices Paid reading above 50 locks in the hawkish runway. |
| Wed, Jun 24 | EIA Crude Oil Inventory Report | First inventory signal of whether Iranian crude is beginning to materialize in US supply data. A crude build would accelerate the WTI selloff toward $70 and validate the energy disinflation thesis; a draw (11th consecutive) would suggest supply surplus arrival is slower than markets priced, providing a floor for energy equities. Critical for sizing the Iran trade’s timing. |
| Thu, Jun 25 | Initial Jobless Claims (week ending Jun 21) | Continuing claims have risen ~50K since mid-April to 1,810K — the directional trend Warsh is watching. A print above 1,850K continuing claims would be the first materially dovish labor signal since the hawkish FOMC; a stable or declining read confirms Warsh’s September hike runway is intact. |
| Fri, Jul 3 | June Nonfarm Payrolls | First major post-FOMC labor market test. Warsh cited a tight labor market as justification for the hawkish pivot — a soft payroll print (sub-150K) would immediately challenge September hike odds and reprice rate markets significantly. A strong print (200K+) locks in the rate-hike trajectory and accelerates dollar/yield normalization into Q3. |
WHAT TO WATCH NEXT WEEK:
1. Did the Geneva signing hold? The US-Iran formal MoU ceremony was scheduled for Juneteenth (Friday, June 19) — a day when US markets were closed. A successful signing extends the WTI −9% WoW energy disinflation trade and opens the H2 CPI relief narrative. A breakdown reverses WTI, defense stocks (RTX, LMT), precious metals, and airline fuel-cost names simultaneously at Monday’s open — the highest-impact binary for the week ahead.
2. Does Tuesday’s Flash PMI Prices Paid confirm Philly Fed’s 53.2 spike as a national trend? If the national Flash Manufacturing PMI shows Prices Paid above 50, it becomes the second consecutive national data point validating factory-gate inflation re-acceleration — narrowing the window for any September dovish pivot. This is the week’s most consequential data point for the Warsh rate-hike thesis and may be the most market-moving release of the week.
3. Does the SOX record hold its ground through week 2 of Apple–Intel scrutiny? Apple has not formally confirmed the Intel foundry deal; Intel’s 18A-P yields are unproven at commercial scale; and BofA’s “most crowded trade in history” designation historically precedes 3–6 months of sector underperformance. The first week of due diligence on the Apple–Intel claim will determine whether the SOX record is a durable re-rating or a news-driven overshoot that fades with scrutiny — with INTC’s formal confirmation (or lack thereof) being the specific catalyst to watch.
G. CHART OF THE WEEK -> TOP
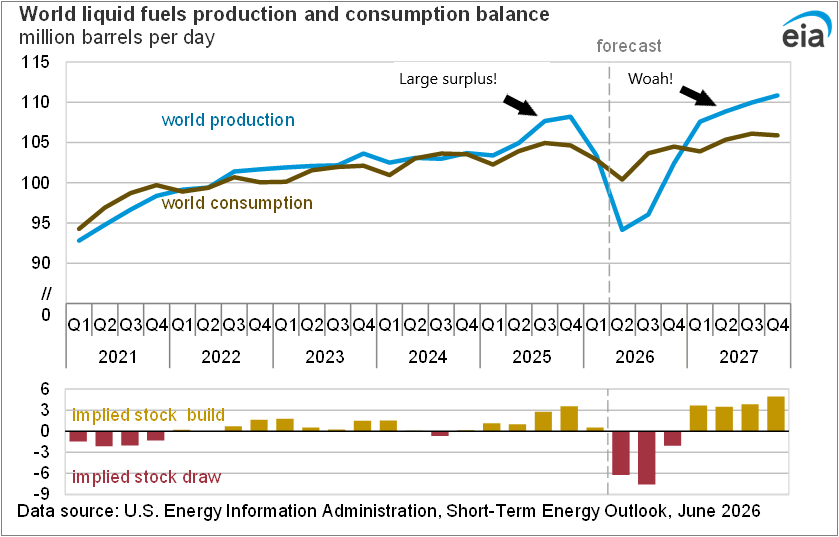
Chart of the Week: The oil supply/demand architecture behind the week’s dominant story — the Hormuz closure extracted 11–14 mb/d from global supply and burned US crude inventories to 40-year lows, explaining why WTI only fell 9% this week rather than recovering (the depletion floors the price even as the supply fear unwinds). The right arm is the structural endgame: a projected 5 mb/d 2027 supply surplus as Iranian barrels return provides the ceiling on energy sector valuations regardless of near-term price stabilization. The left arm is the trade; the right arm is the trade’s expiration date. The hinge between them is the Geneva signing — and whether the IEA’s Q3 reopening premise holds.
MIB Weekly Digest Ver. 1.64
For professional investors only. Not investment advice.
© 2026 RecessionALERT.com
Comments are closed.