
MIB WEEKLY DIGEST
Week of Aug 17–21, 2026
Treasury doubled its long-bond buybacks on Wednesday and the market unwound the entire move by Thursday’s close, leaving the S&P 500 down 1.43% and both yields higher on the week. The chip complex fell roughly 5.5% twice in three sessions — Intel -12.13%, Dell -9.93%, KLA -9.68% — while Merck added 12.30% on the first positive Phase 3 for an individualised cancer vaccine, making Healthcare the week’s second-best sector. Walmart beat on both lines, raised guidance three ways and lost 9.15% in a session. Bitcoin closed +23.18%, gold +5.44%, and Friday’s flash PMI hit a 52-month high.
TABLE OF CONTENTS
A. WEEK AT A GLANCE
B. WEEK IN MARKETS
C. WEEK’S TOP STORIES (10)
D. WEEK IN THE ECONOMY (5)
E. WEEK IN EARNINGS (3)
F. NEXT WEEK SETUP
G. CHART OF THE WEEK
A. WEEK AT A GLANCE -> TOP
The S&P 500 fell 1.43% on the week, and the damage was concentrated rather than broad — the Nasdaq 100 lost 2.45% while the NYSE Composite gave up just 0.38%. The dominant driver was the long end of the Treasury curve, where an intervention announced on Wednesday was fully unwound by Thursday’s close, leaving both the ten-year and two-year higher on the week and the VIX up 6.18% despite a 5.50% collapse on Friday. All of that happened in a week the flash composite PMI reached a 52-month high: the growth data is the strongest since 2022, and the cost of financing it is still rising.
• Treasury doubled its long-bond buyback ceiling on Wednesday and the market unwound it inside a session — the 30-year fell roughly ten basis points, then finished the week back above 5.24%, with the ten-year up 3.9 bps and the two-year 5.9.
• The chip complex fell about 5.5% twice in three sessions, the second with all 30 index components lower on a day the S&P, Dow, NYSE Composite and Russell 2000 all rose.
• Merck +12.30% and Intel -12.13% were the week’s two ends — the first positive Phase 3 for an individualised cancer vaccine against a $20 billion equity raise priced below where the stock then traded.
• The flash composite PMI printed 56.0 against 53.2 expected, a 52-month high built entirely on services at 56.8, with manufacturing output falling to a 13-month low.
• Walmart lost 9.15% in a single session after beating on both lines and raising full-year guidance three ways, on US comparable sales that missed by more than a percentage point — then drew fourteen target cuts and not one downgrade.
• Bitcoin +23.18%, gold +5.44%, Brent +6.05% — a hard-asset week that ran with the dollar down only 0.80%, and a national average gasoline price of $4.10, the highest ever recorded for the date.
1. The Intervention That Lasted a Day — A buyback changes who holds the duration, not how much exists, and the market returned that verdict in twenty-four hours; the hard-asset bid, the two-week easing in mortgage rates and a ten-name utilities target sweep are all downstream of that single fact.
2. The AI Trade Was Sold on Positioning, Not Results — Analog Devices beat every line and guided above consensus and still closed lower inside a 30-of-30 decline, while the financing on display — a vendor guaranteeing its customer, a customer paid in its supplier’s equity, a convert repudiated on sight, a memory leader cancelling shares instead of building a fab — all points one way: capital is getting more expensive for AI exactly where the commitments are largest.
3. The Market Priced Announcements, Not Instruments — A tariff pause no agency implemented, a beef-tariff waiver with no executive order signed, a sanctions package described but not published and a floated federal Bitcoin purchase all moved prices this week, while the one document that did publish — a Commerce notice selling Section 232 relief in exchange for US production capacity, with a hard 25% floor — contradicted the deal that had been announced.
 — Leading economic indicators. Accurate market forecasts. Apply for membership at join.recessionalert.com
B. WEEK IN MARKETS -> TOP
The week’s driver was the long end of the Treasury curve, and it changed hands twice: Treasury doubled its long-bond buyback ceiling on Wednesday, the 30-year fell roughly ten basis points, and by Thursday’s close the entire move was gone with Secretary Bessent promising a larger facility. That left all six major indices lower — the S&P 500 down 1.43%, the Nasdaq 100 down 2.45% — on a week that ended with a 56.0 flash composite PMI, a 52-month high. The breadth pattern is the tell: the NYSE Composite lost only 0.38% while the chip complex fell roughly 5.5% on two separate sessions and Healthcare gained 4.29% on a single Merck readout. The most meaningful divergence sat outside equities entirely, in gold’s 5.44% and Bitcoin’s 23.18% arriving with the dollar down just 0.80% and both Treasury yields higher.
FRIDAY CLOSE & WEEK-ON-WEEK CHANGE — Fri, Aug 21, 2026:
MAJOR INDICES
The dispersion is the week’s real information: the NYSE Composite gave up 0.38% while the Nasdaq 100 shed 2.45%, a two-point gap opened almost entirely across Tuesday and Wednesday. Neither the large-versus-small nor the growth-versus-broad spread crossed a signal threshold, and Dow Theory finished the week confirmed after Friday. What reads as a down week for equities was a down week for roughly thirty stocks.
| Index | Fri Close | WoW Change | WoW % | Why It Moved (Week) |
|---|---|---|---|---|
| S&P 500 | 7,674.37 | -111.36 | -1.43% | Four of five sessions turned on the long end — an oil-led risk-off Monday, Tuesday’s $3 trillion AI-commitment tally, Wednesday’s buyback relief and Thursday’s same-day unwind. Friday’s 56.0 flash PMI recovered only part of it. |
| Dow Jones | 53,277.01 | -455.40 | -0.85% | Walmart’s 9.15% Thursday drop was the single largest drag on the price-weighted index; Friday’s financial-led rebound on the PMI beat recovered roughly half the week’s loss. |
| DJ Transportation | 21,570.26 | -222.14 | -1.02% | Absorbed Tuesday’s 1.60% industrial selloff then tracked the tape; Friday’s 0.88% gain restored the Dow Theory bull confirmation that had lapsed to neutral on Thursday. |
| Nasdaq 100 | 29,308.86 | -737.28 | -2.45% | The week’s worst index and entirely a semiconductor story: the chip complex fell roughly 5.5% on both Tuesday and Wednesday, the second with all 30 components lower on a day the broad market rose. |
| Russell 2000 | 3,017.87 | -52.09 | -1.70% | Small-caps tracked the rates tape rather than the chip tape — up 0.50% Wednesday on the buyback-driven yield drop, down 1.34% Thursday when it reversed. |
| NYSE Composite | 24,728.59 | -93.09 | -0.38% | The week’s most resilient gauge, and the clearest evidence the damage was concentrated: broad-market breadth lost barely a third of a percent while the Nasdaq 100 shed 2.45%. |
VOLATILITY & TREASURIES
Volatility and yields both finished higher, and the curve flattened two basis points doing it — the two-year added 5.9 bps against the ten-year’s 3.9. That inverts the week’s own narrative: five sessions were argued over long-end supply, and the repricing landed at the front. Friday supplied the reason, when a 56.0 flash composite moved the two-year 4.7 bps in a single session. The dollar registered none of it, its entire 0.80% weekly decline arriving on Wednesday.
| Instrument | Fri Level | WoW Change | Why It Moved (Week) |
|---|---|---|---|
| VIX | 15.13 | +0.88 (+6.18%) | Rose on three of five sessions and finished higher despite Friday’s 5.50% collapse — volatility repriced upward on the long-end story, not on growth. |
| 10-Year Treasury Yield | 4.731% | +3.9 bps | Wednesday’s buyback expansion took 6.8 bps out of the ten-year and Thursday handed 5.4 bps straight back; the net rise says the facility addressed liquidity, not supply. |
| 2-Year Treasury Yield | 4.232% | +5.9 bps | Rose more than the ten-year on the week, most of it on Friday’s PMI beat — the front end pricing a Fed with less room, against July minutes in which no participant argued for a cut. |
| US Dollar Index (DXY) | 98.84 | -0.80 (-0.80%) | Effectively a single-session move: down 0.86% Wednesday on the buyback-driven yield drop, flat the other four. No safe-haven bid appeared at any point in the week. |
COMMODITIES
Copper is what disqualifies the industrial reading: it fell 0.42% on a week platinum gained 7.66% and gold 5.44%, and platinum’s two-point lead over gold marks a rate-and-dollar trade rather than a haven bid. Wednesday’s buyback-driven 0.86% dollar break made most of it; Friday then repeated the move with the dollar unchanged. Bitcoin’s 23.18% ran on none of that — three sessions above 5%, three unrelated Washington catalysts, no correlation to the metals it is filed beside.
| Asset | Fri Price | WoW Change | WoW % | Why It Moved (Week) |
|---|---|---|---|---|
| Gold | $4,672.06/oz | $+241.16 | +5.44% | Wednesday’s dollar break did most of the work, but Friday added a further 2.20% with the dollar flat and both yields higher — the second leg had no currency or real-rate mechanism behind it. |
| Silver | $69.222/oz | $+4.382 | +6.76% | Outpaced gold on the week after a 4.00% Tuesday collapse, with Thursday’s 3.57% gain arriving on a broad risk-off day — an industrial-demand limb gold does not carry. |
| Copper | $6.5818/lb | $-0.0275 | -0.42% | The complex’s only weekly decline, and the reason the metals move reads as monetary: copper sat out four of five sessions before a 1.74% Friday. |
| Platinum | $1,891.70/oz | $+134.60 | +7.66% | The week’s strongest metal, up 5.43% on Wednesday alone. PGM leadership over gold is what separates a rate-and-dollar trade from a haven bid. |
| Bitcoin | $77,522.0 | $+14,589.0 | +23.18% | Three separate sessions above 5% on three unrelated catalysts — Wednesday’s SEC crypto-framework proposal, Thursday’s CLARITY Act push plus a $1.74 billion short liquidation, and a Friday move no dated event explains. |
ENERGY
Crude gained in four of five sessions and did it on the days equities fell — Monday, Tuesday and Thursday each paired a higher WTI with a lower S&P, which is cost pressure rather than demand. The framework that had suspended Hormuz transit tolls expired on the 16th, and Bessent promised the toughest sanctions on record on Thursday. The genuinely new split is transatlantic: Dutch TTF added 10.20% against Henry Hub’s 1.14%, with US storage 185 Bcf above its five-year average while Europe’s sits at a record low for the date.
| Asset | Fri Price | WoW Change | WoW % | Why It Moved (Week) |
|---|---|---|---|---|
| Crude Oil (WTI) | $86.69/bbl | $+4.28 | +5.19% | Four consecutive advancing sessions on the expired US-Iran framework and Thursday’s sanctions vow; Friday closed flat as Tehran issued de-escalation and escalation signals hours apart. |
| Crude Oil (Brent) | $93.92/bbl | $+5.36 | +6.05% | Outpaced WTI on a week the supply risk was global rather than regional — the UAE severed all trade with Iran and a third China-linked tanker turned back inside the strait. |
| Natural Gas (Henry Hub) | $2.747/MMBtu | $+0.031 | +1.14% | Barely moved on a week Brent gained 6%: a 16 Bcf storage build against a 19 Bcf consensus was not enough to overcome record Lower-48 output near 111.6 Bcf/d. |
| Natural Gas (Dutch TTF) | $22.723/MMBtu | $+2.103 | +10.20% | Broke €65/MWh with EU storage at a record low for the date — Norwegian outages, drought-hit hydro and the Hormuz closure compounding into the widest transatlantic gas split of the cycle. |
S&P 500 SECTORS — WEEKLY ROTATION
Healthcare’s +4.29% and Technology’s -3.19% are the same fact seen from opposite ends, and the weekly movers tables prove it: six of the eight names on the gainers screen are Healthcare — Merck, Thermo Fisher, Lilly, AbbVie, Amgen, Abbott — while six of the nine decliners are Technology or semiconductors. This was a rotation executed name by name, not a sector re-rate. Basic Materials’ 6.60% lead is the exception and is genuinely broad: none of the week’s top gainers sit in it, which points the move at the metals themselves. Utilities is the structural laggard beneath all of it, worst sector at one, three and six months.
| Sector | 1-Week | 1-Month | 3-Month | 6-Month | YTD | 12-Month |
|---|---|---|---|---|---|---|
| Basic Materials | +6.60% | +14.39% | +7.92% | +1.47% | +22.90% | +43.12% |
| Healthcare | +4.29% | +7.20% | +15.82% | +10.18% | +12.38% | +26.78% |
| Energy | +2.48% | +4.71% | +4.51% | +15.29% | +38.83% | +45.68% |
| Consumer Cyclical | +0.14% | +8.27% | -1.00% | +0.22% | -2.13% | +3.19% |
| Real Estate | -0.35% | -0.17% | +2.06% | +3.53% | +10.99% | +7.82% |
| Communication Services | -1.23% | +4.40% | -8.33% | -0.14% | -1.73% | +12.01% |
| Consumer Defensive | -1.41% | +1.74% | -1.78% | -4.74% | +7.31% | +2.11% |
| Financial | -1.66% | +2.41% | +9.78% | +8.61% | +7.38% | +13.83% |
| Technology | -3.19% | +3.31% | +2.72% | +24.09% | +22.35% | +33.50% |
| Utilities | -3.50% | -7.44% | -6.08% | -8.70% | -0.68% | +0.74% |
| Industrials | -3.67% | -0.06% | +0.42% | -1.91% | +12.94% | +17.76% |
TOP WEEKLY MOVERS:
One trade produced both tables. Four of the five gainers are Healthcare, and the sector’s 4.29% week is largely them: Merck’s 12.30% came off Wednesday’s melanoma-vaccine readout, which carried Lilly and Thermo Fisher with it. The decliners are the mirror — Intel, Dell and KLA all fell on the same two chip sessions. The underlying screener shows what was being sold: Dell is up 688.72% over three years, Intel 144.09% year to date even after a 12.13% week. Nothing here reflects deteriorating results. Money left the cycle’s most-owned trade for the one with a dated catalyst.
TOP 5 WEEKLY GAINERS
| Ticker | Week | YTD | Year | Why It Moved |
|---|---|---|---|---|
| MRK | +12.30% | +44.93% | +77.22% | The INTerpath-001 trial of intismeran autogene plus Keytruda met both endpoints in resected melanoma across more than 1,100 patients — the first positive Phase 3 for an individualised cancer vaccine, run jointly with Moderna. Merck added roughly $44 billion of market value Wednesday and set an all-time high Friday. Goldman Sachs raised its target to $160 from $140, BMO to $170 from $142 and Morgan Stanley to $179 from $116 on an upgrade. |
| TMO | +6.97% | +8.60% | +30.08% | Rode the Healthcare rotation rather than a company event: no dated Thermo Fisher catalyst appeared during the week beyond the August 16 completion of its $1.075 billion microbiology divestment to Astorg, and the stock’s two largest sessions (+4.16% Wednesday, +2.28% Thursday) both tracked the sector. Its +8.60% year to date against a +6.97% week makes this the clearest counter-trend bounce on the board. |
| MRVL | +6.77% | +178.94% | +232.87% | An 8-K disclosed Wednesday that Google holds a warrant over 58,970,907 Marvell shares at $206.58 — about $12.2 billion, exercisable to 2033 and vesting in 240 tranches tied to $500 million increments of custom-silicon revenue. The stock rose 9.85% Wednesday and 5.79% Thursday, then fell 5.56% Friday even as Jefferies raised its target 38% to $325 and Citi to $275. |
| LLY | +6.38% | +16.82% | +76.86% | Two legs, both Healthcare-sector: a 3.60% Tuesday as defensive rotation bid the group, then 4.46% Wednesday alongside the Merck readout, on the same session Lilly licensed Amplitude Therapeutics’ trans-amplifying RNA vaccine platform on undisclosed terms. Lilly also filed six lawsuits on August 17 targeting the retatrutide grey market. |
| ABBV | +6.21% | +15.96% | +26.47% | The one gainer with its own catalyst stack: Wolfe Research upgraded to Outperform on August 17 and Wells Fargo lifted its target to $300, with Piper Sandler following to $303 on the 18th. AbbVie also raised $9 billion of debt on the 17th to fund an acquisition. The 3.43% Tuesday gain was the third-largest mega-cap move of that session. |
TOP 5 WEEKLY DECLINERS
| Ticker | Week | YTD | Year | Why It Moved |
|---|---|---|---|---|
| INTC | -12.13% | +144.09% | +283.28% | Dilution, not demand. Intel priced an upsized equity deal at $95 — roughly 210.5 million shares raising about $20 billion against the $15 billion first proposed, adding some 4.2% to the pre-offering share count and up to 4.8% if the greenshoe is exercised. The stock spent the rest of the week below the offer price, closing at $90.07, and shed 6.58% on Tuesday inside the broader chip unwind. CEO Lip-Bu Tan bought 105,263 shares at the offer price. |
| WMT | -10.04% | -6.92% | +5.86% | Beat on both lines, raised full-year guidance on three metrics, and fell 9.15% in a session. US comparable sales excluding fuel rose 2.6% against a 3.7% consensus — the slowest in six years — and the operating-margin raise leaned on roughly $2.9 billion of tariff refunds. Fourteen firms cut price targets on Friday without a single rating change. |
| GEV | -10.01% | +46.40% | +57.90% | Caught in the AI-capex unwind rather than any company event: GE Vernova fell 6.90% on Tuesday as the $3 trillion off-balance-sheet commitment tally hit every name levered to data-centre power demand. Bernstein reaffirmed Buy mid-week. The standing drags are a wind segment guided to roughly a $400 million EBITDA loss for 2026 and a $250-350 million net tariff headwind. |
| DELL | -9.93% | +251.19% | +245.83% | Profit-taking after a vertical run, executed through the chip complex: Dell fell 6.64% on Wednesday when all 30 components of the semiconductor index declined, having already slipped 2.36% Tuesday. Evercore ISI raised its target to $550 from $500 on the 18th, into the selling. The $51.3 billion AI server backlog is intact and the next print is not until September 1. |
| KLAC | -9.68% | +51.42% | +110.90% | No single catalyst — broad-sector move. KLA fell 5.33% on Tuesday with the semiconductor-equipment group and again inside Wednesday’s 30-of-30 decline, with no company-specific news dated to the week. Sell-side consensus stayed constructive throughout, framing the drawdown as valuation rather than order-book deterioration. |
— Institutional-grade intelligence for serious investors. Apply for membership at join.recessionalert.comC. WEEK’S TOP STORIES -> TOP
Three threads and an outlier. The first is the cost of capital: stories #1, #3 and #8 are one argument, in which the long end broke, Treasury intervened, the intervention lasted a day, and money moved toward assets no government issues. The second is policy as a market instrument — #4, #5 and #7, each priced off an announcement before any document existed. The third is the rotation those forced: #2, #6 and #9, out of the cycle’s most-owned trade into whatever carried a dated catalyst. Story #10 is the only one with a verdict attached.
UNCERTAIN
1. The Long End Broke, Treasury Doubled Its Buybacks, and the Market Undid It Inside a Single Session
The core facts:The 30-year Treasury yield reached 5.31% on Monday, its highest since June 2007, and 5.33% on Tuesday. On Wednesday the Treasury announced it would at least double the maximum size of its liquidity-support buybacks in nominal long-dated coupons, from $2 billion to at least $4 billion per operation, for a programme running September 9 through November 4; the 30-year gave up roughly ten basis points to about 5.19%, the ten-year fell 6.8 bps, the dollar 0.86% and the VIX 6.00%. By Thursday’s close almost the entire move was gone — the 30-year back above 5.24%, the ten-year up 5.4 bps, the VIX up 7.52% and the Dow down 1.32%. Secretary Bessent responded by saying the programme could exceed $4 billion and describing 30-year liquidity as “very poor.” Friday brought a third configuration: the VIX collapsed 5.50% to 15.13 while both the ten-year and two-year rose again. Over the full week the ten-year added 3.9 bps to 4.731% and the two-year 5.9 bps to 4.232%, flattening the curve by two. On Friday Morgan Stanley reset price targets on at least ten large-cap utilities — NextEra, Duke, Southern, Dominion, Xcel, Sempra, Exelon, AEP, Atmos and Ameren — cutting every one and downgrading none.
Why it matters:A buyback is a liquidity facility, not a reduction in issuance. It changes who holds the duration, not how much of it exists, and the market returned that verdict inside twenty-four hours — which is the single most useful thing that happened all week, because it prices the tool rather than the announcement. The context is that total public debt crossed $40 trillion in the same week, so the supply the facility does not touch is still growing. The equity expression is the utilities sweep: ten target cuts with zero downgrades is a discount-rate adjustment, not a fundamental call, and utilities are the equity market’s most bond-like exposure. Utilities finished the week at -3.50% and are the worst sector at one, three and six months — see the sector rotation table in Section B. The awkward detail sits in the curve: the two-year moved more than the ten-year over the week, so the front end was repricing Fed risk upward at the same moment equity volatility was pricing it down.
What to watch:The first enlarged operation on September 9, and whether the 30-year holds below 5.30% into it. Chair Warsh’s first Jackson Hole keynote on Friday, August 28 is the intervening event, and whether he addresses the Fed’s role in Treasury-market policy at all is the open question.
BEARISH
2. The Chip Complex Fell 5.5% Twice in Three Sessions — the Second Time With All Thirty Components Down on a Day the Market Rose
The core facts:A Wall Street Journal analysis of footnote disclosures published Tuesday found roughly $3 trillion of off-balance-sheet AI commitments across nine large technology companies, against approximately $600 billion of combined reported capital expenditure over their most recent twelve-month periods — $904 billion to $1.2 trillion of unstarted leases plus $1.52 trillion to $1.9 trillion of purchase commitments. The semiconductor index fell roughly 5.4% that session and 5.6% the next, the second with every one of its 30 components lower on a day the S&P 500, Dow, NYSE Composite and Russell 2000 all closed higher. Over the week the Nasdaq 100 lost 2.45%, Intel 12.13%, Dell 9.93%, KLA 9.68%, AMD 8.00% and Broadcom 6.24%. Analog Devices reported a record quarter on Wednesday — revenue $4.02 billion against $3.92 billion expected, adjusted EPS $3.45 against $3.34, fourth-quarter guidance above consensus at $4.3 billion — and still closed down 0.89%. On Thursday the memory names went the other way entirely: Marvell +5.79%, Micron +3.97% and SanDisk +2.02% were three of only four mega-cap gainers on a session when nine of eleven sectors closed red.
Why it matters:Tuesday’s fall is easy to dismiss as beta; Wednesday’s is not. It arrived with yields down, the dollar weaker and the VIX 6% lower — every macro condition that supports long-duration growth equity was present and the complex fell anyway. Thirty of thirty is not stock selection, it is an entire exposure being marked lower irrespective of individual fundamentals, and Analog Devices beating on every line and guiding above while still declining removes the last fundamentals-based explanation available. What remains is positioning, in the most crowded trade of the cycle. The week’s second lesson is that memory has stopped behaving like the rest of it: a group that fell 5.5% twice and then rallied hard into a broad risk-off day is trading on its own supply clock rather than as an expression of the AI theme, which adds an independent cycle risk to allocations built as a single bet. Technology closed the week at -3.19% and five of the ten weekly movers are chip names — see the sector rotation and weekly movers tables in Section B.
What to watch:NVIDIA reports after the close on Wednesday, August 26 against consensus of roughly $2.09 EPS on $92 billion of revenue. It is the only scheduled event this month capable of settling whether this is positioning or fundamentals, and Marvell follows on Thursday the 27th with options implying a move near 14%.
BEARISH
3. Five Ways to Pay for AI in One Week: Nvidia Guaranteed $105 Billion, Google Took a $12.2 Billion Warrant, and a Neocloud’s Convert Was Repudiated on Sight
The core facts:Monday: Nvidia will guarantee up to $105 billion of financing for the first phase of an OpenAI campus in Pike County, Ohio — 4.25 gigawatts of initial compute with an option on a further 3.75 GW, built, owned and operated by SoftBank subsidiary SB Energy under a 20-year lease to OpenAI, with Nvidia separately investing $1.5 billion into SB Energy. First capacity is targeted for 2028. Wednesday: a Marvell 8-K disclosed a warrant granted to Google over 58,970,907 shares at $206.58, roughly $12.18 billion and about 7% of the company, vesting in 240 tranches released one per $500 million of eligible custom-silicon revenue through fiscal 2033; Marvell rose 9.85% and Broadcom fell 4.61% on no adverse news of its own. Also Wednesday: Nebius launched $4.50 billion of convertible senior notes to fund data-centre construction and GPU procurement, and the stock closed down 9.87%. The same morning SK hynix approved a 40 trillion won repurchase-and-cancellation programme, roughly $28.6 billion and the largest cancellation by a Korean listed company, choosing to retire 3.3% of its equity rather than add capacity. On Tuesday KKR approached UGI at $42.50 a share, a 21.1% premium and roughly $9 billion, for a regulated gas and power distributor. Against all of it, Anthropic reported second-quarter revenue above $11.5 billion — against $787 million a year earlier — and its first positive adjusted operating income.
Why it matters:These are five answers to one question, and the answers agree. A vendor underwriting its customer’s balance sheet, a customer being paid in its supplier’s equity at a strike below market, a neocloud reaching for converts because straight debt is expensive relative to a story that no longer clears, a memory leader concluding its own shares beat a fab, and private capital paying a control premium for the physical assets rather than contracting for their output — all of it says the same thing. Capital is getting more expensive for AI infrastructure at precisely the point in the cycle when the commitments are largest, and the structures are migrating toward whoever can be made to carry the risk. The Google warrant is the sharpest instance because it puts a price on incumbency: single-hyperscaler concentration has become a valuation liability, and the mechanism by which it gets repriced is dilution granted to the customer. Anthropic is the genuine counter-evidence and it is substantial — but the figures are preliminary, unaudited, and come from a private company roughly two months from an IPO window, which is when disclosure is most favourably framed.
What to watch:Whether Nebius’s initial purchasers exercise the $675 million upsize option inside its 13-day window — declining it would confirm the book was not covered at the headline size — and Broadcom’s next disclosure of custom-ASIC revenue and 2027-2028 programme allocation.
BEARISH
4. The Iran Framework Expired, a Ship’s Engineer Was Killed Inside Hormuz, and the Sanctions Discount Inverted Into a Premium
The core facts:The 60-day memorandum of understanding signed on June 17 lapsed on Sunday, August 16 with no extension; Trump said he would not seek one and, in a Fox News interview on Monday, threatened to bomb Oman — the mediator. Early Tuesday the Greek-owned, Liberia-flagged bulk carrier Minoan Dignity was struck by a projectile in its engine room during an outbound transit and its chief engineer was killed. On Wednesday the UAE suspended all trade, commercial exchange and financial transactions with Iran after saying two Iranian ballistic missiles had been fired toward it, and a third China-linked tanker U-turned inside the strait. On Thursday Bessent promised “the toughest sanctions in history” and said the administration would “collapse this regime.” On Friday Iran’s president called for the war to end “now” while his armed forces chief threatened a “devastating” response hours apart, and China rejected the secondary-sanctions threat while declining to say whether it would curb Iranian crude purchases. Brent closed the week +6.05% at $93.92 and WTI +5.19% at $86.69. AAA put the national average gasoline price at $4.10 a gallon, the highest ever recorded for the date, with August averaging $4.06 — the highest month on record. October-delivery Russian Urals for India was offered at premiums of up to $1 over dated Brent, and Iranian Light moved from a $3.50 discount to a $3.50 premium. The US oil rig count fell a third consecutive week, to 452 against 456 expected.
Why it matters:Two mechanisms broke this week and both point the same way. The sanctions discount was the entire economic instrument of the regime — it worked by forcing the seller to accept less, not by preventing the sale — and a discount that ran wider than $10 in early July has now inverted, which makes an EU price cap frozen at $44.10 inoperative against a barrel trading near $94. And the US supply response that historically caps geopolitical rallies did not arrive: three consecutive rig declines with WTI near $87 is capital discipline under a returns mandate, not a lag. Remove the discount and remove the shale response and the premium in Brent stops looking speculative and starts looking structural. The transmission to a US book is not the barrel but the pump — a record gasoline price for the date feeds directly into the CPI print a Fed that carried three hawkish dissents in July is already arguing over. Energy closed the week +2.48% and remains the best twelve-month sector at +45.68%; see the sector rotation table in Section B.
What to watch:Bessent’s press conference on Monday, August 24, and specifically whether the sanctions text designates Chinese purchasers by name — China takes more than 80% of Iran’s shipped oil, so that single variable determines whether the architecture has teeth. Chinese refinery run rates in October are the other side of it, and the only credible relief valve currently visible.
BEARISH
5. Section 338 Was Used for the First Time in American History, Paused by a Social-Media Post No Agency Implemented, and Attached Anyway
The core facts:Three proclamations signed July 20 impose an additional 50% ad valorem duty across 439 tariff provisions covering roughly $20 billion of Canadian imports — motor vehicles and parts, alcoholic beverages and dairy at the headline, with annexes reaching cement, plywood, furniture, glassware, textiles, printed circuit boards and industrial machinery. Energy, potash, certain fish, critical minerals and Section 232 goods are carved out. Covered goods remain dutiable even when they qualify under USMCA, and the duties are permanent rather than time-limited. Monday: Canadian negotiators met USTR Greer and Commerce Secretary Lutnick with 36 hours on the clock. Tuesday: talks ended with no deal, no extension and no withdrawal. Late Tuesday, roughly two hours before the duties were to attach, Trump announced a three-day pause citing a deal subject to the finalisation of documents — and nothing was published to effect it, then or afterwards. Thursday: three independent complete enumerations — the White House Presidential Actions index, USTR’s press-release index and the 118-document Federal Register public-inspection list — confirmed the absence. Friday: a third consecutive day of talks ended without agreement and the duties attached at 12:01 a.m. ET on Saturday, August 22. Reported terms halving Section 232 steel and aluminium duties to 25% and cutting autos to 15% rest entirely on unnamed sources. A Canadian Federation of Independent Business survey found 40% of small exporters to the US have products directly captured; of those, 77% expect revenue to decline and 5% expect it to fall to zero.
Why it matters:The instrument is the story, not the twenty billion. That sum is small against roughly $700 billion of annual bilateral goods trade, and the carve-outs deliberately protect the categories with the most direct inflation transmission. What does not shrink is the precedent: a Section 338 action that overrides a ratified agreement’s rules of origin tells every counterparty that treaty text is not a defence against a sectoral proclamation, and permanence forces relocation decisions with capital attached rather than inventory decisions that can be waited out. What this week added is the second half of that lesson — the same instrument can be suspended by a social-media post that no agency implements, leaving importers in a three-day position where the proclamations remained operative on their face and the relief was verbal. The one document that did publish is the most informative of all: a Commerce notice under Proclamation 10984 offering Section 232 relief in exchange for commitments to new US primary production capacity, with an explicit floor stating the adjusted rate “may be no less than 25 percent” for producers operating in Canada or Mexico. That is tariff relief sold for capacity, not granted as a concession — and it is the version with a Federal Register citation.
What to watch:Whether CBP issues implementation guidance over the weekend, and whether Proclamation 11056 — filed for public inspection at 11:15 a.m. ET Friday and scheduled to publish Monday, August 24 — is superseded before it appears. The Canadian banks reporting Tuesday through Thursday will carry the first corporate read on commercial-loan exposure.
BULLISH
6. The First Positive Phase 3 for an Individualised Cancer Vaccine Added $44 Billion to Merck — and Took Four of the Week’s Five Biggest Gainers With It
The core facts:The INTerpath-001 trial of intismeran autogene plus Keytruda in completely resected stage IIB-IV melanoma, across more than 1,100 patients, met both its primary endpoint of recurrence-free survival and its key secondary endpoint of distant metastasis-free survival versus Keytruda alone. Merck rose 12.60% on Wednesday to $152.20 — roughly $44 billion of market value — and set an all-time high on Friday, closing the week +12.30% as the top weekly gainer. Morgan Stanley upgraded to Overweight on Thursday and raised its target 54% to $179 from $116, the largest single-day target move of the session; BMO went to $170, UBS to $175 and Goldman Sachs to $160, while RBC downgraded to Sector Perform and raised its target anyway. Partner Moderna rose 176.9% Wednesday and fell roughly 25% Thursday. Two further RNA-platform events landed in the same five sessions: argenx’s Phase 3 ALKIVIA trial hit its primary endpoint on Monday with a 15.4-point greater mean Total Improvement Score at week 52, in a myositis subtype with no approved therapy; and Eli Lilly licensed Amplitude Therapeutics’ trans-amplifying RNA vaccine platform on Wednesday, on undisclosed terms. Healthcare closed the week +4.29%.
Why it matters:Three separate RNA-platform events inside five sessions is a modality being re-rated rather than one company having a good week — and the modality had been substantially written down as a pandemic artifact. For Merck it addresses the specific thing every holder worries about: Keytruda’s principal patents expire toward the end of the decade, and a combination that extends the franchise into adjuvant settings answers that without an acquisition. What promotes this from a stock story to a top story is the sector consequence. Four of the week’s five largest gainers are Healthcare names and six of the eight rows on the gainers screen are — Merck, Thermo Fisher, Lilly, AbbVie, Amgen, Abbott — making Healthcare the second-best sector on a week the S&P 500 fell 1.43%. That is a fair description of where the money that left semiconductors actually went. See the weekly movers and sector rotation tables in Section B.
What to watch:The medical-meeting presentation of the full dataset. Hazard ratios and the durability curve determine whether this supports a filing in adjuvant melanoma alone or across additional tumour types — and whether Merck commits to a filing timeline at all.
BULLISH
7. Bitcoin Added 23% on Three Unrelated Washington Catalysts and Closed Its Best Week Since 2023
The core facts:Bitcoin finished Friday at $77,522 against roughly $62,900 the previous Friday, a gain of 23.18% and its first sustained move above $75,000 since May. Three separate sessions cleared 5%. Wednesday’s 6.25% followed the SEC’s proposal of “Regulation Crypto Assets,” a tailored securities-offering framework carrying two exemptions — up to $5 million over four years, or $75 million annually — and, more consequentially, a defined route for certain crypto assets to exit securities classification and its reporting obligations once a project fulfils stated managerial commitments. Thursday’s 5.07% followed a White House meeting with executives from Coinbase, Payward and Blockchain.com, at which the President urged Congress to pass the CLARITY Act before a September 15 deadline and floated US purchases of “sizable” amounts of Bitcoin; it was amplified by $1.74 billion of short liquidations over twenty-four hours, the second-largest such event on record. Friday added 6.69% with no dated catalyst that survived verification. Separately, Citigroup unveiled its Custody+ suite on Tuesday and confirmed native institutional digital-asset custody launching later in 2026, beginning with Bitcoin, inside the same framework it uses for traditional securities.
Why it matters:The de-registration pathway is the substantive change, and it is the first time the Commission has proposed a mechanism rather than an enforcement posture; the offering exemptions are small-issuer thresholds and matter far less. Classification and custody, not conviction, have been the binding constraints on institutional allocation — mandates that prohibit third-party custodians have been structurally excluded regardless of what their managers believed — and both moved in the same week, with the fourth-largest US bank confirming it will hold the asset in its securities stack. That is the sort of change that alters flows quietly and over quarters rather than in a session. The discipline required is that the catalyst is legislative and therefore binary: a cloture vote is a date, not a trend, and roughly half of Thursday’s move was forced covering rather than allocation. A 23% week built partly on a squeeze can give a good deal of it back to the same book.
What to watch:The September 15 Senate cloture vote on the motion to proceed on the CLARITY Act — the same day the FOMC convenes — and whether spot-ETF inflows confirm the move or leave it resting on short covering. On the SEC proposal, the comment period and whether the final rule preserves the de-registration route.
UNCERTAIN
8. Gold Cleared $4,600 and Platinum Added 7.66% in a Week the Dollar Fell Only 0.80% and Both Treasury Yields Rose
The core facts:Gold gained 5.44% on the week to $4,672.06 an ounce, platinum 7.66% to $1,891.70 and silver 6.76% to $69.222 — while copper fell 0.42% to $6.5818 a pound. Basic Materials was the best-performing S&P sector at +6.60%, extending a twelve-month run of +43.12%. Most of the move was made on Wednesday, when the dollar index fell 0.86% to 98.80 and the ten-year yield 6.8 bps. But Friday repeated it without the mechanism: gold added a further 2.20% and platinum 2.86% while the dollar finished effectively unchanged at 98.84 and both the ten-year and two-year yields rose. The same week the national debt crossed $40 trillion, up from $30 trillion roughly two years earlier, with sovereign reserve managers continuing to trim Treasury holdings in favour of gold and other diversified assets.
Why it matters:A precious-metals bid normally requires a falling dollar, falling real yields, or both. Friday had neither, and stripping out the currency and discount-rate channels leaves a straight preference shift — buyers accepting a higher opportunity cost to hold a non-yielding asset. That is a more durable signal than a dollar-driven rally, because it does not unwind when the dollar bounces. Copper is what proves the reading rather than the prices themselves: an industrial-demand story cannot lose its industrial metal, and copper was the only member of the complex to finish the week lower. The uncomfortable half is what it says about the equity rally underneath. Basic Materials leading the tape is a perfectly good reason to own the sector and a poor advertisement for the quality of what it is leading — gold at $4,672 with a 30-year above 5.2% and $40 trillion of federal debt is a balance-sheet trade wearing a growth trade’s clothes, and it is the same argument story #7 is making in a different asset.
What to watch:Whether gold holds above $4,600 if the dollar index recovers toward 100. A complex that keeps its gains through a dollar rally confirms the preference-shift reading; one that hands them back was a positioning move after all.
UNCERTAIN
9. Twenty-Two Analyst Actions and Not One Rating Change: the Street Repriced the Trade-Down Consumer in Two Sessions
The core facts:On Friday at least fourteen firms reset price targets on Walmart, and every action was a cut with every rating left intact: Truist $140 to $114, BMO Capital $145 to $126, Evercore ISI $140 to $125, Morgan Stanley $140 to $125, Wells Fargo $140 to $120 and Deutsche Bank $120 to $113, with Argus, UBS, Piper Sandler and Baird among the others. The same session Ross Stores drew eight actions and every one was a raise — Truist to $310, Telsey to $280, Evercore ISI to $290, J.P. Morgan to $272 and Deutsche Bank to $294, with Bernstein, Morgan Stanley and Jefferies also raising. Three firms appear on both tapes, moving in opposite directions on the same morning. Thursday had produced the identical shape one tier down: eight dated actions on Lowe’s, five of them cuts and none a raise, against three raises on Target, with the same analysts on both sides. Walmart closed the week down 10.04%, the second-largest weekly decline among mega-caps. Consumer Defensive finished the week at -1.41% while Consumer Cyclical held +0.14%.
Why it matters:Twenty-two actions and zero rating changes is the signature of a valuation reset rather than a thesis change — the analysts still like these businesses, they have simply moved where they think the earnings accrue. Targets cut on the mass-market incumbent and raised on the off-price operator, by the same people on the same morning, is the Street formally marking down the mid-tier consumer while marking up the beneficiary of that weakness. For a US large-cap book that is a rotation instruction dressed as arithmetic: it argues the consumer is not weakening in aggregate so much as sorting, and that the sorting is now far enough along to be worth a target. The deeper change is in what earns a multiple. Walmart beat on both lines and raised full-year guidance three ways and still lost nine percent in a session — a beat whose composition is challenged now costs more than a miss whose guidance is credible, and that standard applies to every retailer left on the calendar. The print itself is covered in Section E.
What to watch:Burlington, Dollar General and Dollar Tree all report before the bell on Thursday, August 27, with Best Buy the same morning. Three off-price and discount comps in one session is the direct test of whether this repricing is right.
BEARISH
10. Meta Went to Trial Against 29 States and Underperformed Its Own Sector by Five Points
The core facts:Trial proceedings opened in Oakland, California on Monday in the consolidated action brought by 29 state attorneys general, with California, Colorado, New Jersey and Kentucky trying the bellwether case and opening statements delivered Tuesday. The states allege Meta illegally collected data from children under 13, designed Facebook and Instagram to drive compulsive use among minors, and misled users and the public about platform safety. Meta’s own attorneys have said the consolidated trial could produce damages as high as $1.4 trillion; lawyers for the states have put $200 billion as the more likely figure. The states are also seeking injunctive relief, with court-ordered age restrictions and the elimination of infinite scroll among the remedies requested. The trial is expected to run seven weeks, placing a verdict in early October. Meta fell 3.54% on Monday and closed the week down 6.77%, against a Communication Services sector that fell 1.23% — and which remains the market’s worst three-month sector at -8.33%.
Why it matters:The damages headline is the least useful number in the case. A $1.4 trillion award is not a realistic outcome and both sides know it; it is a ceiling calculated from statutory per-violation penalties, and Meta’s lawyers cite it precisely because it is absurd. The injunctive relief is the real exposure. Court-ordered age gating and the removal of infinite scroll would alter the engagement mechanics that generate ad inventory, would apply prospectively rather than as a one-time charge, and would travel — every peer platform would face the same template. The New Mexico ruling earlier this month is the instructive precedent running the other way: that judge awarded $567 million but expressly declined to touch Meta’s algorithms, infinite scroll or autoplay on First Amendment and Section 230 grounds, which made the refusal the market-relevant part of the decision. Whether an Oakland court reaches the same conclusion over seven weeks is now open, and a stock underperforming its own sector by more than five points across the week says it is being priced as genuinely open rather than as noise.
What to watch:Any early ruling on the scope of injunctive relief. That, not the damages number, is what determines whether the outcome is a charge or a change to the business model — and the seven-week calendar puts it in front of a verdict in early October.
— Separating signal from noise since 2007. Apply for membership at join.recessionalert.comD. WEEK IN THE ECONOMY -> TOP
The week’s tension is a growth scare unwinding, and it read hawkish rather than dovish. Every activity gauge cleared: the flash composite PMI at 56.0 against 53.2, a 52-month high; the Philadelphia Fed at 47.4 against 25.0, a five-year high with prices paid falling from 53.9 to 40.9; the Conference Board’s leading index turning positive on a six-month basis for the first time since 2022; claims at 206,000. Ordinarily that eases recession risk, and Polymarket agreed, holding recession odds unchanged at 8%. It did not ease policy risk. Hike odds rose seven points to 56%, the two-year added 5.9 bps against the ten-year’s 3.9, and July’s minutes showed several participants ready to raise and none arguing for a cut. Core PCE on Wednesday, August 26 is where the disinflation half of the argument either survives a record gasoline print or does not.
POLYMARKET ODDS — WEEK-ON-WEEK SHIFT:
| Market | Last Friday | This Friday | Δ |
|---|---|---|---|
| US Recession by end-2026 | 8% | 8% | 0 pp |
| Fed rate hike in 2026 | 49% | 56% | +7 pp |
| Fed rate cuts ≥1 in 2026 | 14.7% | 14.5% | -0.2 pp |
BULLISH
1. Flash Composite PMI 56.0 vs 53.2 Expected — a 52-Month High, and the Manufacturing Half Went the Other Way (S&P Global, Fri, Aug 21)
What they’re saying:The S&P Global flash US composite PMI rose to 56.0 in August from 54.5 in July against a 53.2 consensus — a 2.8-point beat and the strongest reading since April 2022. The services business activity index jumped to 56.8 from 54.6, a 20-month high. Manufacturing went the other way: factory output fell to a 13-month low and the headline manufacturing PMI slipped to 53.2 from 53.9. The survey’s own commentary put third-quarter growth on a track approaching 3% annualised against the 1.5% recorded in the second quarter. Supply-chain delays lengthened to one of their widest points in four years as safety-stock building faded.
The context:The market’s response is the more transferable fact. The Dow closed up 0.98%, Basic Materials led all sectors at +2.99%, the Russell 2000 added 0.85% and Goldman Sachs and Morgan Stanley were among the largest mega-cap gainers — while the Nasdaq 100 managed only 0.33%. Materials, financials and small-caps outpacing mega-cap technology is not an AI-narrative rally; it is a growth-reacceleration trade, and it means books positioned for a decelerating economy were on the wrong side of the print. The bill arrived in rates: the two-year rose 4.7 bps against the ten-year’s 3.3, so the front end moved more than the long end — see the Volatility & Treasuries table in Section B. A composite at a 52-month high removes the growth-scare argument for Fed patience and leaves September hostage to the inflation data instead.
What to watch:Final August S&P Global revisions, and the ISM manufacturing and services prints in early September for confirmation that the services-versus-manufacturing divergence is real rather than a survey artefact.
UNCERTAIN
2. A 9-3 Hold With Three Dissents for a Hike and Nobody Arguing for a Cut — Then Two Fed Presidents Disagreed in Public About Why (Federal Reserve, Wed–Thu, Aug 19–20)
What they’re saying:The minutes of the July 28–29 FOMC meeting, released Wednesday at 14:00 ET, showed a 9-3 vote to hold at 3.50%–3.75% with Beth Hammack, Neel Kashkari and Lorie Logan dissenting in favour of a 25 bp hike — the largest dissent in over a decade. Participants described inflation risks as “skewed to the upside” and broad-based; several were prepared to raise at the meeting itself, many said a hike would be needed if inflation does not decline toward 2%, and no participant argued for easing. On Thursday St. Louis’s Alberto Musalem said he would have voted to hike, that underlying inflation runs at 2.5%–3.0% and must be returned to target “over the next 18 months,” and that rising long yields do not signal lost Fed credibility. San Francisco’s Mary Daly took the other side the same day: policy is well positioned, there is no evidence supporting pre-emptive hikes, and the long-yield rise is a global phenomenon. Neither votes this year.
The context:The minutes were stale on arrival and the market treated them that way — yields fell, the dollar fell 0.86%, the VIX fell 6.00% and the S&P, Dow and NYSE Composite all closed higher on a hawkish document. Four prints the Committee never saw had already done the repricing. What Thursday added is worse than a disagreement about calibration: the Fed’s two most articulate regional voices cannot agree on the diagnosis of the one price currently doing the most damage to risk assets, in the same week the Treasury intervened directly in that market. Polymarket registered the shift the equity tape did not — hike odds for 2026 rose from 49% to 56% across the week while cut odds barely moved, which is the cleanest evidence available that positioning built on post-meeting softness is now running against the Committee’s own revealed preference.
What to watch:Chair Warsh’s first Jackson Hole keynote as Chair, Friday, August 28 at 10:00 a.m. ET — nineteen days before the September 15–16 decision, and unusually high-information because this Fed no longer telegraphs ahead of meetings.
BULLISH
3. Philly Fed at a Five-Year High With Prices Paid Falling, Empire at 20.6, and the Leading Index Positive for the First Time Since 2022 (NY Fed / Philadelphia Fed / Conference Board, Aug 17–20)
What they’re saying:The Empire State manufacturing index jumped to 20.6 in August on Monday against an 11.0 consensus, its strongest since late 2021, with new orders at 17.3 and future business conditions at 32.1. On Thursday the Philadelphia Fed index surged to 47.4 from 41.4 against a 25.0 consensus — its highest since 2021 — with employment rising to 27.9 from 10.0, future business expectations at 73.6, the highest since 1983, and prices paid falling to 40.9 from 53.9. The Conference Board’s Leading Economic Index rose 0.2% in July to 99.5 and its six-month growth rate turned positive at +0.2% for the first time since 2022, reversing a 1.3% contraction. Initial jobless claims fell to 206,000 against 210,000 expected, though continuing claims rose to 1.799 million. The Atlanta Fed’s Business Inflation Expectations survey had firms expecting 3.7% own-price growth over the next year, down from 4.1% in May.
The context:Two things separate this cluster from an ordinary run of firm surveys. The first is the prices-paid collapse at Philadelphia — thirteen points in a month, arriving in the same week crude gained 6% and gasoline set a record for the date. Activity strengthening while input costs cool is the combination that makes a hawkish Fed harder to justify, and it is the only genuine disinflationary evidence the week produced. The second is the LEI turning positive on a six-month basis: that diffusion has been one of the more reliable recession precursors and it has been flashing warning since 2022, so a sign change is a real event even at +0.2%. Set against it, Empire’s own prices-paid index sat at 58.6 with selling prices at just 22.7, the widest gap in months — manufacturers are absorbing cost rather than passing it on, which protects the CPI print and squeezes the margin line instead.
What to watch:The Richmond and Kansas City Fed surveys later this month and ISM manufacturing in early September, plus whether the LEI’s consumer-expectations component — the lone drag among its parts — turns alongside the rest in the late-September release.
BEARISH
4. Housing Starts Collapse 12.4% While Permits Beat by 5% — Builders Are Banking Options, Not Breaking Ground (Census Bureau / NAR / Freddie Mac, Tue–Thu, Aug 18–20)
What they’re saying:July housing starts fell 12.4% month-over-month to a 1.239 million annualised pace against a 1.35 million consensus and down 13.5% year-over-year, with single-family starts off 9.9%. Building permits went the other way, rising 5.0% to 1.443 million against a 1.37 million estimate. NAR’s pending home sales index fell 2.3% in July to its lowest level since January, with contract signings declining in all four major regions; chief economist Lawrence Yun attributed it to mortgage rates hitting their highest level of the year in mid-July. Freddie Mac put the 30-year fixed at 6.65% for the week of August 20, down from 6.67%, the second consecutive weekly decline, with the 15-year at 5.95%. The NAHB builder index rose one point to 35, beating a 33 consensus but marking a sixteenth consecutive month below the neutral 40 line, with roughly 30% of builders still cutting prices.
The context:The permits-versus-starts divergence is the substance: builders are still pulling entitlements while declining to break ground, which is an option being preserved rather than exercised, and it is what a sector does when it expects conditions to improve but not yet. The binding constraint is visible in which part of the curve matters — the 30-year Treasury reached a 19-year high on Tuesday, and that is precisely the maturity a September Fed decision does least to control, which is why rate-cut expectations have delivered the complex so little relief. Real Estate closed the week at -0.35% and has now failed to rally through a week in which mortgage rates actually fell twice; see the sector rotation table in Section B. The modest relief in the mortgage rate traces directly to the Treasury buyback expansion rather than to anything the Fed did.
What to watch:New Home Sales and the S&P/Case-Shiller home price index, both due Tuesday, August 25, and whether the 30-year fixed holds below 6.65% once the enlarged buyback programme formally begins on September 9.
BEARISH
5. A Record 56% of Fund Managers Expect “No Landing” in the Week the National Debt Passed $40 Trillion (BofA Global Research, Tue, Aug 18; Treasury data, week of Aug 18)
What they’re saying:BofA’s August Global Fund Manager Survey found a record 56% of respondents expecting a “no landing” outcome and 43% expecting an outright boom, the highest since February 2022, against just 4% anticipating a hard landing; 72% do not expect the Fed to hike before the November midterms. BofA’s own strategists flagged the readings as a contrarian sell signal with the firm’s Bull & Bear indicator elevated, recommending investors rotate within risk assets rather than add to them. Separately, US national debt crossed $40 trillion during the week, up from $30 trillion roughly two years ago, prompting strategists to question whether Treasuries retain their risk-free designation; sovereign reserve managers have continued trimming Treasury holdings in favour of gold. Corporate distress remained contained but visible: Braskem Idesa filed a prepackaged Chapter 11 in Houston on August 17 to restructure roughly $3.6 billion of principal debt, cutting senior debt from about $2.5 billion to $1.6 billion.
The context:The survey measures positioning rather than forecasting outcomes, and its usefulness is inverse to its optimism — record consensus around a benign outcome means the marginal buyer has already bought, leaving no reserve of incremental demand to absorb a surprise. The week supplied the test in unusually clean form: a single accounting analysis containing no new information about demand removed roughly 5.4% from the semiconductor complex, and a beat-and-raise from the largest US retailer removed 9.15% from its own stock. That is the asymmetric reaction function of a one-sided book. The $40 trillion milestone is the structural half of the same point and is not a separate storyline — it is the supply the Treasury’s buyback programme is managing around rather than reducing, and the reason a hard-asset bid appeared in a week the dollar barely moved.
What to watch:The September Global Fund Manager Survey’s “no landing” share — a sharp retreat would confirm this week’s de-rating changed minds rather than merely prices — and foreign official Treasury holdings in the next TIC report, after June’s net foreign bond purchases collapsed to $6.8 billion from $56.6 billion.
— Know the probability before the market prices in the risk. Apply for membership at join.recessionalert.comE. WEEK IN EARNINGS -> TOP
TOP EARNINGS OF THE WEEK
UNCERTAIN
1. Walmart (WMT): -10.04% on the week | The Beat Was Real, the Raise Was Real, and the Composition Cost Nine Percent
The Numbers:Q2 FY27, released before the open Thursday, August 20. Adjusted EPS $0.81 against $0.74 consensus, a 9.36% surprise; revenue $187.94B against $186.62B, a 0.71% beat and up 5.9% year over year; GAAP EPS $0.80. US comparable sales excluding fuel rose 2.6% against Street expectations of 3.7% to 3.8%. Full-year FY27 guidance was raised on three separate metrics: net sales growth to 4.0%–5.0% from 3.5%–4.5%, adjusted operating income growth to 7.0%–8.5% from 6.0%–8.0%, and adjusted EPS to $2.80–$2.87 from $2.75–$2.85. Global e-commerce rose 23%, advertising 38% and membership fee revenue 17%. Market capitalisation $826.37B after the move.
The Problem/Win:Two line items did the damage and both sit below the headline. US comparable sales missed by more than a full percentage point and marked the slowest growth in six years, with drug price caps costing roughly 0.8 points through health and wellness — comps being the number that distinguishes winning share from absorbing price. And the operating-income raise leaned on approximately $2.9 billion of tariff refunds the company is eligible to receive, a non-recurring input arriving in the same line as operating leverage, which management has said will be spent lowering prices with the effect landing in the third quarter. The wins are genuine and unusually well-diversified: advertising at +38% and membership at +17% are both higher-margin than the retail base and both compounding faster than it.
The Ripple:The 9.15% single-session decline was the largest drag on the price-weighted Dow, which fell 1.32% that day, and Consumer Defensive was the session’s worst sector at -2.16% — on a broad risk-off day when its defensive bid should have been strongest. Fourteen firms cut price targets on Friday without a single rating change while eight raised Ross Stores; that repricing of the whole trade-down complex is covered as story #9 in Section C.
What It Means:At this multiple the burden of proof has moved from the headline to the composition. Modelling the FY27 guide now requires separating the tariff-refund contribution from underlying operating leverage, because the two are currently reported in one line and only one of them recurs.
What to watch:Whether the tariff-refund contribution is quantified as a separate line in the Q3 print, and US comparable sales against a 3% bar.
BULLISH
2. Deere & Co (DE): +6.94% on the print | First Year-Over-Year Profit Growth in Three Years, and Agriculture Did Not Deliver It
The Numbers:Q3 FY26, released before the open Thursday, August 20. EPS $5.10 against $4.69 consensus, an 8.65% surprise, up from $4.75 a year earlier; equipment net sales $11.00B against $10.81B, a 1.70% beat, with total net sales and revenues of $12.61B, up 5%; net income $1.379B. Full-year net income guidance was raised at the low end to $4.75B from $4.50B with the top end unchanged at $5.00B. Market capitalisation $167.61B.
The Problem/Win:The composition is the whole story and it inverts the headline. Production and Precision Agriculture — the core segment — saw revenue fall 6% and operating profit fall 9% on lower shipment volumes for large tractors and combines. Construction carried the quarter. Management simultaneously affirmed that 2026 is the bottom of the agricultural equipment cycle and guided US and Canada large-ag sales down 15%–20%, with South America down the same. Against any recovery in equipment margin sits a standing tariff bill of roughly $1.1 billion of direct expense for fiscal 2026, about $750 million net of refunds.
The Ripple:Deere closed up 6.94% on a session when Industrials were the second-worst S&P sector at -1.73% and both RTX (-3.66%) and GE Aerospace (-3.25%) were among the largest mega-cap decliners. That divergence is the tell: this was not an industrial-sector bid, it was a cycle-trough bid on a single name, and it is the only place in the week where a fundamental call rather than a positioning flow set the price.
What It Means:The market paid for the affirmation of a cycle bottom rather than for the quarter, which makes the Q4 guide the entire position — a trough call that gets walked back costs more than the beat was worth.
What to watch:Whether the Q4 guide holds the trough call, and the Philadelphia Fed’s six-month capital expenditure index — at a 53-year high in August — as the leading read on equipment demand.
BULLISH
3. Analog Devices (ADI): -0.89% on the print | A Company-Record Quarter, a 52% Margin Guide, and the Market Took It Anyway
The Numbers:Fiscal Q3 2026, quarter ended August 1, released before the open Wednesday, August 19. Revenue $4.02B against $3.92B expected, a 2.62% beat and a company record, up roughly 40% year over year. Adjusted EPS $3.45 against $3.34, a 3.20% beat and up 68% year over year; GAAP diluted EPS $2.74, up 163%. Q4 guidance of $4.3B ± $0.1B revenue with adjusted EPS of $3.86 ± $0.15 and an adjusted operating margin around 52.0%. Trailing-twelve-month operating cash flow $5.5B and free cash flow $4.9B — 40% and 36% of revenue respectively. $1.7B returned to shareholders in the quarter. Market capitalisation $181.81B.
The Problem/Win:The 52% adjusted operating margin guide is the number that matters and it is the one most likely to be skipped. Data Center and Industrial led the growth, and a 40% revenue increase converting into a margin at that level means analog is capturing AI data-centre demand as pricing power rather than merely as volume — a materially different economic profile from the memory names, whose cycle is set by capacity. Free cash flow at 36% of revenue funds the $1.7B quarterly return without touching the balance sheet. The problem is not in the print at all: guidance above consensus on every line failed to hold the stock for a single session.
The Ripple:The print landed into a semiconductor index falling 5.6% with all 30 components down. ADI’s -0.89% was in fact among the mildest declines in the group — Lam Research fell 6.33% and Broadcom 4.61% with no results at all — so the print did work, just not enough to arrest a sector move it did not cause. The positioning read that follows is story #2 in Section C.
What It Means:For anyone modelling the analog names against the memory and equipment names, this quarter is the separating evidence: same end-market, different margin structure, and a 52% operating margin guide that does not depend on the capacity cycle resolving. It also sets the anchor NVIDIA’s print will be measured against on August 26.
What to watch:Whether the $4.3B Q4 guide holds through NVIDIA’s August 26 report. If the sector re-rates on NVIDIA, ADI’s above-consensus outlook becomes the reference point for the analog complex.
WEEK AHEAD PREVIEW:
Q2 2026 earnings season is 88% complete and Friday’s calendar was empty of mega-caps entirely — the largest US reporter of the session was Ubiquiti at a $33.83B market cap. Next week reverses that abruptly, with the quarter’s single most consequential print landing Wednesday and a five-name Canadian bank cycle running Tuesday through Thursday.
Bank of Montreal (BMO) — BMO, Tuesday, August 25 — consensus $2.71 EPS on $7.01B revenue against a $123.18B market cap. KBW’s David Konrad initiated coverage Friday at Buy with a $214 target, one of only two Buys in a five-name Canadian bank launch. Key focus: credit provisions on the US commercial book and any commentary on Section 338 tariff exposure across the Canadian corporate loan portfolio, given the duties attaching Saturday.
Bank of Nova Scotia (BNS) — BMO, Tuesday, August 25 — consensus $1.50 EPS on $7.17B revenue, $107.93B market cap. Also initiated Buy at KBW Friday with a $107 target. Key focus: international segment margins and whether Canadian mortgage renewal stress is stabilizing or still building.
Intuit (INTU) — AMC, Tuesday, August 25 — consensus $3.58 EPS on $4.27B revenue, $100.39B market cap, fiscal Q4 and full-year results. Key focus: the AI-driven expert platform launched in August, TurboTax Live customer and revenue growth, and execution against the $8 billion repurchase authorization and 15% dividend increase announced alongside it. Truist recently moved to Hold on softening growth, making guidance the swing factor.
NVIDIA (NVDA) — AMC, Wednesday, August 26 — consensus $2.09 EPS on $92.06B revenue against a $5,196.22B market cap. The most consequential print of the quarter. Key focus: data-center revenue trajectory, any commentary on the custom-silicon threat now that Google has taken a warrant position in Marvell and Broadcom is reportedly arranging tens of billions in Anthropic chip financing, and whether AI-capex guidance can absorb a market that sold semiconductors on Friday while buying cyclicals. NVDA closed Friday down 0.97% at $214.75.
CrowdStrike (CRWD) — AMC, Wednesday, August 26 — consensus $0.29 EPS on $1.44B revenue, $195.45B market cap. Key focus: net new ARR and module attach rates, plus whether federal and enterprise budget cycles are holding up alongside the AI-security product ramp.
Salesforce (CRM) — AMC, Wednesday, August 26 — consensus $3.27 EPS on $11.33B revenue, $171.31B market cap. Key focus: Agentforce seat conversion and pricing realization, current remaining performance obligation growth, and margin guidance against continued AI investment.
Royal Bank of Canada (RY) — BMO, Thursday, August 27 — consensus $2.93 EPS on $13.09B revenue, $284.57B market cap and the largest of the Canadian cohort. KBW initiated at Hold with a $229 target Friday; Barclays’ Brian Morton separately raised to Buy at $218 from $189 the same day. Key focus: capital markets revenue and the same tariff read-through as its peers.
Marvell Technology (MRVL) — AMC, Thursday, August 27 — consensus $0.93 EPS on $2.71B revenue, $207.59B market cap, with options implying a move near 14%. Key focus: custom-silicon design-win commentary following the Google warrant disclosed August 19, and whether the data-center ramp justifies the $275 and $325 targets Citi and Jefferies published on Friday — a session in which the stock fell 5.56%.
Toronto-Dominion (TD) — BMO, Thursday, August 27 — consensus $1.77 EPS on $10.80B revenue, $197.92B market cap. KBW initiated at Hold, $131 target. Key focus: progress on US anti-money-laundering remediation and the associated asset cap, which remains the binding constraint on the US retail franchise.
Canadian Imperial Bank of Commerce (CM) — BMO, Thursday, August 27 — consensus $1.81 EPS on $5.79B revenue, $107.94B market cap. KBW initiated at Hold, $135 target. Key focus: domestic mortgage book performance and commercial real estate provisions.
Also next week: PDD Holdings reports before the bell Monday, August 24 at a $125.80B market cap, and is excluded from individual coverage here solely because it trades as an ADR. Friday, August 28 carries no mega-cap reporters — the calendar’s only listed name is MINISO Group at $3.36B — but does bring Fed Chair Warsh’s first Jackson Hole keynote at 10:00 a.m. ET and the next FactSet earnings scorecard update.
— US market commentary trusted by family offices and institutions. Apply for membership at join.recessionalert.comF. NEXT WEEK SETUP -> TOP
UPCOMING RELEASES:
| Date | Event | Why It Matters |
|---|---|---|
| Mon, Aug 24 | Chicago Fed National Activity Index (prior -0.02) | A broad 85-indicator composite; the quietest available cross-check on whether this week’s regional-survey surge is national. |
| Tue, Aug 25 | Fed Barkin speech (8:00 AM) and again (4:00 PM) | The first Fed voice after the Musalem-Daly split, and two chances to signal which diagnosis the Committee is converging on before Jackson Hole. |
| Tue, Aug 25 | ADP Employment Change Weekly (prior 9.5K) | The highest-frequency labour read available; continuing claims rose this week even as initial claims fell. |
| Tue, Aug 25 | S&P/Case-Shiller Home Price YoY (prior 1.6%) | With starts down 12.4% and pending sales at a January low, price is the last leg of housing still holding. |
| Tue, Aug 25 | CB Consumer Confidence (expected 91.2, prior 90.8) | Consumer expectations were the lone drag inside this week’s Leading Economic Index; this is where that shows up first. |
| Tue, Aug 25 | New Home Sales (expected 0.62M, prior 0.628M) | The direct test of whether builder permits are converting into transactions or staying as options. |
| Tue, Aug 25 | API Crude Oil Stock Change (prior -3.28M) | First inventory read after a fifth consecutive weekly crude advance and a record gasoline print for the date. |
| Wed, Aug 26 | MBA 30-Year Mortgage Rate (prior 6.77%) | Freddie Mac has now eased two straight weeks to 6.65% on the back of the buyback expansion; this is the weekly confirmation. |
| Wed, Aug 26 | Core PCE Price Index MoM (expected 0.2%, prior 0.1%) | The week’s decisive release. A firm core print on top of a 56.0 composite PMI removes the growth-scare argument for patience entirely, against a Committee that already carried three dissents for a hike. |
| Wed, Aug 26 | PCE Price Index MoM (expected 0.1%, prior -0.1%) and YoY (prior 3.7%) | The headline gauge carries the record August gasoline price; the gap to core is where the energy pass-through becomes visible. |
| Wed, Aug 26 | GDP Growth Rate QoQ 2nd Est (expected 1.5%, prior 2.1%) | The Q2 baseline against which this week’s near-3% Q3 tracking is being measured. GDPNow currently sits at 4.0%. |
| Wed, Aug 26 | GDP Price Index QoQ 2nd Est (expected 6.3%, prior 3.6%) | A deflator revision of this size would materially change the real-versus-nominal read on Q2 growth. |
| Wed, Aug 26 | Durable Goods Orders MoM (expected 0.7%, prior 0.3%) and Ex Transport (expected 0.5%, prior 0.6%) | Capital-goods orders are where the Philadelphia Fed’s 53-year-high capex expectations either show up or do not. |
| Wed, Aug 26 | Personal Income MoM (expected 0.3%, prior 0.3%) and Personal Spending MoM (expected 0.2%, prior 0.2%) | The consumer read that sits underneath the trade-down repricing — whether the sorting is income-driven or preference-driven. |
| Wed, Aug 26 | Corporate Profits QoQ Prel (prior 0.5%) | The aggregate margin picture against a Q2 blended earnings growth rate of +50.4%. |
| Wed, Aug 26 | EIA Crude Oil Stocks Change (prior 4.405M) and Gasoline Stocks (prior 0.688M) | Last week’s surprise 4.4M build came with refinery utilisation at 97.2%; the gasoline line is what feeds the pump price. |
| Wed, Aug 26 | Fed Barkin speech (11:45 AM); Jackson Hole Symposium opens (8:00 PM) | The symposium opens the evening of the Core PCE print — the sequencing means Warsh speaks with the number already in hand. |
| Thu, Aug 27 | Initial Jobless Claims (prior 206K) | The four-week average sits at 204.0K; the continuing-claims line is the one that has been drifting. |
| Thu, Aug 27 | Goods Trade Balance Adv (expected -$99B, prior -$101.4B) | First trade print carrying the Section 338 duties on Canadian goods, which attach Saturday. |
| Thu, Aug 27 | Retail Inventories Ex Autos MoM Adv (prior -0.4%) and Wholesale Inventories MoM Adv (prior 0.2%) | Flash PMI reported supply-chain delays at a four-year wide as safety-stock building faded; inventories are where that lands. |
| Thu, Aug 27 | Jackson Hole Symposium (day two) | Panel and paper sessions ahead of the keynote; historically where the framework language is trialled. |
| Fri, Aug 28 | Non Farm Payrolls Annual Revision Prel (prior -911K) | A second consecutive large downward benchmark revision would retroactively change the labour picture the July FOMC voted on. |
| Fri, Aug 28 | Michigan Consumer Sentiment Final (expected 51.0, prior 55.2) | The preliminary reading cratered on August 14; the final print is the confirmation, and the inflation-expectations sub-index is the market-relevant half. |
| Fri, Aug 28 | Chicago PMI (prior 57.6) | The last regional activity read before ISM, into a month where every survey has surprised upward. |
| Fri, Aug 28 | Jackson Hole Symposium — Chair Warsh keynote, 10:00 AM ET | His first as Chair, nineteen days before the September 15–16 decision, from a Fed that no longer telegraphs ahead of meetings. |
WHAT TO WATCH NEXT WEEK:
1. Does Warsh arbitrate the diagnosis or the calibration? Musalem and Daly disagreed in public this week not about where rates should be but about what the long end is telling them. A keynote that settles the rate path and says nothing about the Treasury market would leave the week’s actual problem untouched.
2. Can NVIDIA arrest a de-rating that Analog Devices could not? ADI beat on every line, guided above consensus and still closed lower inside a 30-of-30 decline. If results were sufficient, that print would have worked. Wednesday tests whether the largest company in the world is exempt from the same arithmetic.
3. Does Core PCE survive a record gasoline month? Wednesday’s print is the only disinflation evidence available before Jackson Hole, and it lands the same day the symposium opens. The Philadelphia Fed’s prices-paid collapse argues one way; $4.10 a gallon argues the other.
4. What actually publishes on Canada, and does it match what was announced? The duties attached Saturday with nothing in the Federal Register implementing any deal. Watch whether Proclamation 11056 appears Monday as scheduled or is superseded — and whether the Canadian banks reporting Tuesday through Thursday quantify Section 338 exposure on their commercial books.
5. Do the Iran sanctions name Chinese purchasers? Bessent details the package Monday. China takes more than 80% of Iran’s shipped oil and declined this week to say whether it would stop; an architecture that does not reach the buyer has no economic bite, and the crude curve is currently priced as though it might.
— US market commentary trusted by family offices and institutions. Apply for membership at join.recessionalert.comG. CHART OF THE WEEK -> TOP
WHY THIS CHARTFour of the week’s five candidates explain consequences; this one sets up a test that has not happened yet. It takes the single question story #1 leaves open — whether Treasury can actually buy $4 billion of long-dated paper on September 9, having never bought more than $2 billion and twice failed to fill even that — and turns the week’s dominant theme, the price of long-end money, into one dated and falsifiable question.
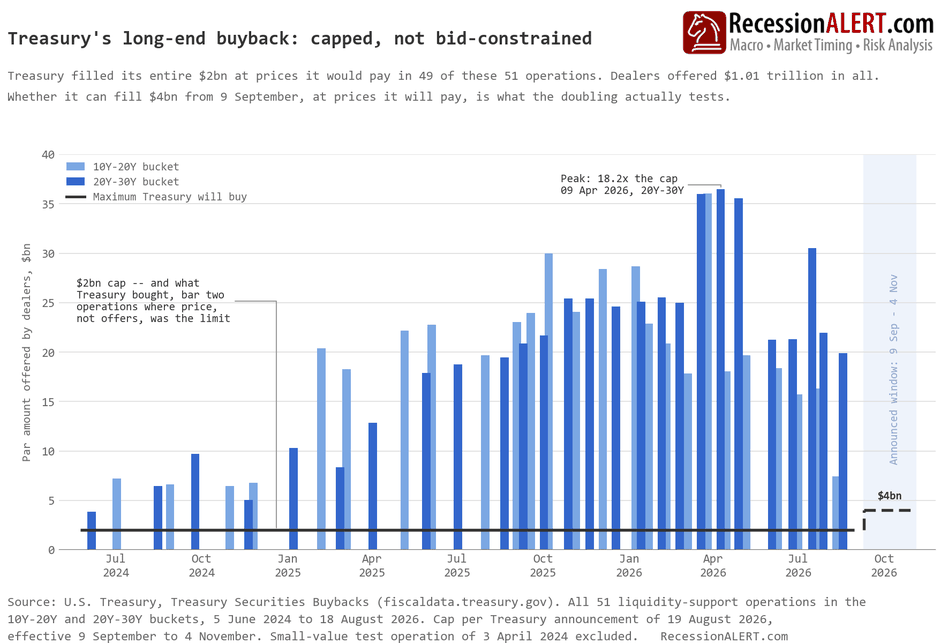
ORIGINAL CHART ANALYSIS — FROM THURSDAY’S MIBOn 9 September, Treasury finds out whether its own long-end bid is real. The increment is roughly $5bn a month against about $102bn of gross 10Y-and-longer issuance — 5.2% of supply going to 10.3%. Too small to move net supply; large enough to settle a question 27 months of operations have left open. Treasury has never tried to buy more than $2bn here. One cap, 51 operations, filled to the last dollar in 49 — $1.01 trillion offered, $99bn bought. Read that as depth and the doubling is free. Twice it wasn’t: $0.79bn of $2bn taken on 20 November 2025 against $25.4bn offered; $0.20bn against $36.0bn on 19 March 2026. Both 20Y–30Y, both days when price, not the cap, was the limit. Offering into a buyback commits a dealer to nothing — nobody sells unless Treasury reaches their level. So this year’s 11.83x cover measures willingness to be asked, not paper available at Treasury’s bid. The 11 August operation drew 3.70x, the weakest since 2024. If the cap keeps binding at $4bn, Treasury has published a reaction function and will be expected to escalate it. If it starts falling short, the long end has been leaning on a bid that thins the moment it is drawn on — and an untested backstop is worth exactly what the market assumes, right up to the morning it gets marked. What it means: If you hold long-dated Treasury bonds, or a fund that does, do not treat this as a floor under their price yet. Treasury has never actually bought $4bn at one of these buybacks, so nobody knows whether sellers will show up at a price it will pay. Two failed rounds after 9 September would say the support is thinner than it sounded.
MIB Weekly Digest Ver. 1.95
For professional investors only. Not investment advice.
© 2026 RecessionALERT.com

Comments are closed.