
MIB WEEKLY DIGEST
Week of Oct 12–16, 2026
An AI-financing scare split the market in two this week: CoreWeave’s bonds topped a 15% yield, the chip index fell eight straight sessions and the Nasdaq 100 dropped 5.49% while the Dow rose 0.67%. Dell (−22.92%) and Applied Materials (−19.28%) led the losers as money rotated into Walmart, Coca-Cola and Eli Lilly. Gulf attacks reaching Aramco’s headquarters and the Saudi port of Yanbu sent WTI up 11.08% to $101.64. And September’s CPI (3.7%) and PPI (+1.3%) both ran hot — yet the 10-year yield fell 15.4 bps as markets pushed the next Fed hike out toward December.
TABLE OF CONTENTS
A. WEEK AT A GLANCE
B. WEEK IN MARKETS
C. WEEK’S TOP STORIES (6)
D. WEEK IN THE ECONOMY (5)
E. WEEK IN EARNINGS (3)
F. NEXT WEEK SETUP
G. CHART OF THE WEEK
A. WEEK AT A GLANCE -> TOP
The S&P 500 fell 1.95%, its deepest weekly decline since June, and the Nasdaq 100 5.49%, while the Dow and NYSE Composite finished higher — a market that rotated rather than retreated. The driver was a loss of confidence in how the AI buildout is financed, which spread from CoreWeave’s bonds to chipmakers to software over five sessions. It played out against the hottest inflation week of the year and a Gulf war now aimed at Saudi export routes, yet bonds rallied, a sign investors fear what further Fed tightening does to growth more than the inflation itself.
• Nasdaq 100 −5.49%, down in all five sessions, as the semiconductor index logged eight straight losses, its longest streak since 2008
• Dell −22.92% led the week’s mega-cap decliners after Barclays’ downgrade, with Applied Materials −19.28% after its investor meeting gave no equipment-spending forecast
• WTI +11.08% to $101.64, its highest close since September 16, as Brent touched $110 after a missile was fired at Saudi Arabia’s Yanbu export port
• September CPI 3.7% vs 3.6% expected and PPI +1.3%, the largest since March 2022 — yet the 10-year yield fell 15.4 bps to 5.090%
• Bank of America (BAC) missed EPS by 17% a day after a $1.2 billion AML penalty, while Goldman Sachs (GS) beat by 32%
• Walmart +6.70% led the weekly gainers as Consumer Defensive (+5.37%) topped all 11 sectors and Technology (−7.16%) finished last
1. AI’s problem moved from demand to funding — Every demand signal this week was strong, from ASML’s 2027 supply warning to Anthropic’s $16.8 billion quarter and new hyperscaler power contracts, yet a chip loan the banks would not underwrite, CoreWeave’s distressed bond yields and a marked-down Anthropic IPO set prices — which is why the selling reached software companies that borrow nothing.
2. Bonds rallied through the hottest inflation week of the year — Consumer, producer and import prices all beat forecasts while the 10-year yield fell and October hike odds collapsed to a priced hold, so the market treated further Fed tightening as a growth risk rather than treating inflation as a runaway.
3. The leaderboard flipped from builders to necessities — All five of the week’s top mega-cap gainers were staples, healthcare, energy or housing names and all five decliners were AI hardware or security, while the Dow rose as the Nasdaq 100 fell — a rotation within equities that Citi, BlackRock and RBC endorsed in real time.
4. Every policy lever on oil failed to cap it — Russia’s diesel release, a Defense Production Act refinery order, the IEA’s diesel release, talk of easing shadow-fleet sanctions and a Strategic Petroleum Reserve exchange offer all landed within five sessions, and WTI still rose every day: supply relief is now running behind supply risk.
 — Leading economic indicators. Accurate market forecasts. Apply for membership at join.recessionalert.com
B. WEEK IN MARKETS -> TOP
An AI-financing scare that started in the credit market set the week: CoreWeave’s bonds traded above a 15% yield on Wednesday, a chip slide that began Monday with China’s DRAM advance ran to eight straight losing sessions for the semiconductor index, and by Friday the selling had reached software and cybersecurity. It produced a split, not a liquidation — the Nasdaq 100 fell in all five sessions while the Dow and NYSE Composite finished higher, as money moved into staples, healthcare and energy rather than out of stocks. A second driver ran alongside: Houthi and Iranian attacks, from Riyadh’s airport to Aramco’s Dhahran headquarters to a missile aimed at Yanbu, took WTI above $100. The anomaly sat in bonds — September’s consumer, producer and import prices all ran hot, yet long yields fell, a market reading further Fed tightening as a threat to growth rather than to price stability.
FRIDAY CLOSE & WEEK-ON-WEEK CHANGE — Fri, Oct 16, 2026:
MAJOR INDICES
The growth-versus-broad signal fired: a gap of more than three and a half points opened, the Nasdaq 100 trailing the S&P 500, with value and defensive groups taking the ground tech surrendered. The gap was built session by session rather than in one break — the growth index lagged on all five days, the gap widening sharply on Wednesday’s CPI and Friday’s software rout. The other two signals stayed silent: transports confirmed the industrials’ weekly gain, and small caps lagged by less than the threshold, so the damage stayed in a sector rather than the cycle.
| Index | Fri Close | WoW Change | WoW % | Why It Moved (Week) |
|---|---|---|---|---|
| S&P 500 | 7,659.44 | −152.10 | −1.95% | The AI-hardware and software unwind did the damage from Wednesday on; Thursday’s rate-relief rebound was erased by Friday’s 1.09% drop, leaving the deepest weekly decline since June. |
| Dow Jones | 52,002.41 | +347.46 | +0.67% | Healthcare, staples and energy components absorbed the tech outflow; Thursday’s 556-point gain took it back above 52,000 for the first time since September 21, and Friday’s dip left it there. |
| DJ Transportation | 19,879.83 | +75.69 | +0.38% | Thursday’s 1.40% jump on falling yields carried it to its highest close since September 17; Friday’s oil spike took back most of it. |
| Nasdaq 100 | 29,187.55 | −1,695.60 | −5.49% | Fell every session: Monday’s CXMT-led memory selloff, Tuesday’s chip-equipment slide, Wednesday’s CPI and CoreWeave credit scare, then Friday’s software rout; lowest close since September 16. |
| Russell 2000 | 2,721.37 | −85.61 | −3.05% | Sold off with growth on CPI day, rebounded on Thursday’s bond rally, then slid Friday to its lowest close since April 16. |
| NYSE Composite | 24,088.63 | +149.53 | +0.62% | Its broader energy, staples and financials weighting carried it higher on the week, including an up close on Friday while the S&P 500 fell more than 1%. |
VOLATILITY & TREASURIES
The curve flattened from the long end in the hottest inflation week of the year — the opposite of an inflation scare, in which long yields lead higher. Bond buyers treated a Fed still leaning toward hikes as a growth risk, and the 10-year’s largest decline came on Thursday, the day producer prices posted their biggest monthly jump since 2022. It ran from Wednesday’s CPI lifting October hike odds to about 47% to Friday’s Warsh remarks pushing the next move to December, as the VIX surged and the dollar weakened.
| Instrument | Fri Level | WoW Change | Why It Moved (Week) |
|---|---|---|---|
| VIX | 19.98 | +5.14 (+34.64%) | Rose four of five sessions, from Monday’s pre-CPI positioning to Friday’s 21% jump on the AI-financing selloff and the oil spike; highest close since July 29. |
| 10-Year Treasury Yield | 5.090% | −15.4 bps | Fell through hot CPI, PPI and import-price reports, led by Thursday’s 10.2 bp drop, its largest since June 11; commentary tied the bid to haven demand around the AI trade. |
| 2-Year Treasury Yield | 4.715% | −7.8 bps | Held near 4.8% while CPI briefly lifted October hike odds to about 47%, then fell Thursday and Friday as October hold odds rose to 85% and hike bets shifted to December and January. |
| US Dollar Index (DXY) | 101.78 | −0.43 (−0.42%) | Faded from Monday’s highest close since at least mid-April as US yields fell; no haven bid during Friday’s risk-off. |
COMMODITIES
Every metal finished the week lower despite falling equities, a war premium in oil and a weaker dollar — the week’s stress ran through real rates, not fear. Wednesday’s CPI did the damage, hitting the most rate-sensitive metals hardest, and Thursday’s bond rally was the only session the precious group caught a real bid. Bitcoin behaved like a growth stock all week, falling on each of the three days tech sold off hardest.
| Asset | Fri Price | WoW Change | WoW % | Why It Moved (Week) |
|---|---|---|---|---|
| Gold | $4,189.92/oz | −$31.13 | −0.74% | Wednesday’s CPI-driven hike repricing sent it to its lowest close since August 3; Thursday’s weaker dollar and lower yields recovered most of the loss. |
| Silver | $57.135/oz | −$3.955 | −6.47% | Wednesday’s 6.26% plunge on the hike repricing decided the week; Thursday’s 3% rebound recovered only half of it. |
| Copper | $6.5658/lb | −$0.1425 | −2.12% | Monday’s bid on the fatal avalanche at Codelco’s El Teniente mine faded as risk assets fell midweek; down three of five sessions. |
| Platinum | $1,642.65/oz | −$55.05 | −3.24% | Fell with silver on Tuesday and Wednesday, then recovered part of the loss in the Thursday-Friday rebound. |
| Bitcoin | $81,637.00 | −$830.00 | −1.01% | Tracked tech lower on Monday, Wednesday and Friday with no crypto-specific catalyst. |
ENERGY
WTI outran Brent by enough to cut the spread from nearly $13 to about $8, a US-specific squeeze layered on the global premium: Thursday’s large domestic crude and distillate draws met a week of Gulf attacks. Crude rose in every session and tech-heavy stocks fell in every session, so oil moved against equities all week — the supply-shock reading, not a demand one. Gas split again, with Henry Hub lower on mild weather and Dutch TTF at a 128-session high on Gulf shipping risk.
| Asset | Fri Price | WoW Change | WoW % | Why It Moved (Week) |
|---|---|---|---|---|
| Crude Oil (WTI) | $101.64/bbl | +$10.14 | +11.08% | Rose every session as attacks on Riyadh, Aramco’s Dhahran headquarters and Yanbu met Thursday’s 8.6-million-barrel EIA crude draw; highest close since September 16. |
| Crude Oil (Brent) | $109.73/bbl | +$5.48 | +5.26% | Lagged WTI midweek on talk of easing shadow-fleet sanctions; Friday’s Yanbu missile intercept and Russia’s Ryazan refinery outage took it to a $110 touch and its highest settle since May 19. |
| Natural Gas (Henry Hub) | $3.128/MMBtu | −$0.068 | −2.13% | Tuesday’s 4.8% rally faded, and Friday’s 3.34% slump on a warm NOAA outlook set the weekly loss despite Hurricane Isaias shut-ins early in the week. |
| Natural Gas (Dutch TTF) | $29.178/MMBtu | +$2.458 | +9.20% | Gulf shipping strikes and colder Northwest European forecasts lifted it Monday and Tuesday; Friday’s close was its highest in 128 sessions. |
S&P 500 SECTORS — WEEKLY ROTATION
A defensive-over-cyclical rotation that compounded rather than bounced: Consumer Defensive leads both the week and the month, while Technology, still the second-best sector year to date, is last on the week and now negative over a month. The staples lift was broad, not a single-name story — Walmart and Coca-Cola topped the weekly gainers, but Procter & Gamble rose by as much as the sector itself. Tech’s fall was the reverse: all ten of the week’s largest mega-cap decliners sit in semis, hardware or security, so the sector lost a whole supply chain, not one name.
| Sector | 1-Week | 1-Month | 3-Month | 6-Month | YTD | 12-Month |
|---|---|---|---|---|---|---|
| Consumer Defensive | +5.37% | +6.87% | +4.53% | +4.65% | +12.44% | +10.98% |
| Energy | +4.47% | +5.02% | +14.52% | +17.33% | +46.90% | +52.23% |
| Healthcare | +2.20% | +2.09% | +6.80% | +12.17% | +10.42% | +18.48% |
| Utilities | +1.59% | +1.66% | −5.97% | −9.33% | −1.59% | −8.62% |
| Real Estate | +1.07% | −2.17% | −8.36% | −5.81% | +2.77% | −0.45% |
| Financial | +0.85% | −2.03% | −1.44% | +4.83% | +3.63% | +8.72% |
| Basic Materials | −0.75% | −3.93% | +6.42% | −7.62% | +10.90% | +15.28% |
| Communication Services | −1.27% | −1.37% | −1.38% | −4.22% | −0.09% | +5.22% |
| Consumer Cyclical | −1.52% | +0.21% | −2.95% | −7.28% | −7.34% | −6.13% |
| Industrials | −2.49% | −2.11% | −3.92% | −6.69% | +6.62% | +7.57% |
| Technology | −7.16% | −2.85% | +4.42% | +14.29% | +21.82% | +20.42% |
TOP WEEKLY MOVERS:
Four of the five decliners are among 2026’s biggest winners — Dell is still up more than 250% this year and the two security names more than doubled over six months — so this was crowded-winner liquidation rather than broken businesses; Applied Materials is the exception, already down more than a fifth over the quarter, a downtrend extending. The gainers split two ways. Coca-Cola, Chevron and Lilly extended year-long leadership in the sectors topping the rotation table, while Home Depot and Walmart bounced off negative six-month records — Home Depot is still down a fifth over the year, a lift on Thursday’s yield drop rather than new leadership.
TOP 5 WEEKLY GAINERS
| Ticker | Week | YTD | Year | Why It Moved |
|---|---|---|---|---|
| WMT | +6.70% | +6.64% | +11.59% | Wednesday’s hotter-than-expected CPI sent money into everyday-necessity retailers, lifting Walmart 3.46% on a down day for the market; on Thursday Deutsche Bank upgraded it to Buy from Hold and raised its target to $136 from $113. Walmart also announced broader free prescription coverage and new paid leave for US workers during the week. |
| KO | +6.64% | +34.32% | +38.93% | KFC said on Thursday that its roughly 3,700 US restaurants will switch from PepsiCo to Coca-Cola drinks starting in 2027, ending a partnership of nearly four decades; the stock touched a record intraday high. TD Cowen estimated a modest 10–20 bp lift to Coca-Cola’s 2027 revenue, so the deal added a share-gain story to the week’s staples rotation. |
| LLY | +6.59% | +16.97% | +53.41% | Gained 3.62% Wednesday as new Foundayo (orforglipron) weight-loss data met the healthcare rotation, and 3.55% Thursday; on Friday the European Medicines Agency’s CHMP recommended EU approval of the once-daily GLP-1 pill for obesity and type 2 diabetes, leaving the shares near their 52-week high. |
| HD | +6.50% | −10.02% | −20.07% | No single catalyst — broad-sector or momentum move. Nearly all of the gain came in Thursday’s 4.31% jump as the 10-year yield fell 10.2 bps; coverage described a relief rally after a post-earnings slide without naming a trigger, and Melius’s Strong Buy upgrade predates the week. |
| CVX | +6.14% | +47.62% | +48.30% | Tracked crude higher as Gulf attacks pushed WTI above $100; touched a record intraday high of $218.78 on Tuesday after HSBC lifted its target to $250, then gained 2.59% Friday as Brent reached its highest settle since May 19. |
TOP 5 WEEKLY DECLINERS
| Ticker | Week | YTD | Year | Why It Moved |
|---|---|---|---|---|
| DELL | −22.92% | +258.84% | +198.53% | Barclays cut Dell to Equal Weight from Overweight on Wednesday (target $574 from $603), arguing its enterprise revenue reflects memory-cost inflation more than real AI demand and that the group trades near 21 times 2027 earnings against a five-year average near 15; HPE and NetApp were cut in the same note. The stock fell 11.27% that day and another 6.80% Thursday as the AI-hardware selloff spread. |
| AMAT | −19.28% | +59.26% | +79.73% | Fell 6.69% Tuesday after its investor meeting set 2030 margin targets but gave no wafer-fab-equipment spending or revenue outlook, leaving the timing of AI-driven tool orders unanswered; it then fell in every remaining session as the chip-equipment rout deepened. Cantor reiterated Overweight with an $850 target. |
| ANET | −18.34% | +35.07% | +21.21% | Fell about 5% on both Thursday and Friday as AI networking hardware sold off alongside Dell and the chip-equipment names; coverage also cited profit-taking and filings disclosing executive share sales under pre-arranged 10b5-1 plans. No company-specific news event. |
| PANW | −18.33% | +85.67% | +66.42% | A Wednesday report that OpenAI was exploring a purchase of security firm Trail of Bits hit the sector on fears AI developers will compete with security vendors; Friday’s AI-funding selloff then took it down 7.63%, the largest mega-cap decline of the day. CISA had added an exploited PAN-OS flaw to its vulnerability catalog with an October 17 remediation deadline. |
| CRWD | −17.32% | +94.04% | +88.62% | Fell 4.37% Monday, about 3% Wednesday on the OpenAI–Trail of Bits report, and 7.02% Friday as the AI-funding selloff hit cybersecurity; with the shares having traded above 200 times forward earnings earlier this month, valuation left little cushion. |
— Institutional-grade intelligence for serious investors. Apply for membership at join.recessionalert.comC. WEEK’S TOP STORIES -> TOP
The week ran on two threads that never touched in the news but met in prices. The first is the AI buildout’s funding chain, told in three stages: suppliers first (#1), then the lenders and private valuations behind them (#2), and finally software that borrows nothing at all (#5) — a widening that says the doubt is about returns, not credit. The second is a two-front energy squeeze, the Gulf war reaching Saudi export routes (#3) and a Russian diesel truce that collapsed within the week (#6). Strategist de-risking (#4) is where the two threads converge.
BEARISH
1. The Chip Rout Runs Monday to Friday: China’s DRAM Advance, Applied Materials’ Missing Forecast and Barclays’ Dell Downgrade Take the Semiconductor Index to Eight Straight Losses and the Nasdaq 100 Down 5.49%
The core facts:The selling had a new trigger nearly every day. On Monday China’s CXMT said it had made key progress on a denser 4F² DRAM cell and plans server memory modules on it by the end of 2026; SK Hynix and Samsung fell more than 4% in Seoul and Sandisk dropped 5.97% in New York. On Tuesday Applied Materials fell 6.69% after its investor meeting declined to forecast wafer-fab-equipment spending, with KLA, Lam Research and ASML lower. On Wednesday Barclays cut Dell, HPE and NetApp to Equal Weight on valuation; Dell fell 11.27%, the largest mega-cap decline that day, and Marvell 8.72%. On Thursday Reuters reported US chip stocks on course for a $2 trillion loss in market value since the prior week, with Dell, Arista, Applied Materials, Cisco and Lam the five largest mega-cap decliners. On Friday the PHLX Semiconductor Index fell 3.8% for an eighth straight decline, its longest losing streak since 2008, with AMD down 5.95% and Intel 5.79%. ASML’s Wednesday warning that its planned supply would not meet customers’ 2027-2028 demand did not stop the slide.
Why it matters:Demand evidence was strong all week and the stocks fell anyway: ASML said customers keep raising their equipment forecasts, and the selling continued. That separates this from an earnings scare — investors were repricing what they will pay for AI hardware and how long the spending lasts, not responding to a demand break. The weekly receipts are unusually clean: Technology fell 7.16% to finish last of 11 sectors, all five of the week’s largest mega-cap decliners are hardware or security names (see the weekly movers table in Section B), and the Nasdaq 100 trailed the S&P 500 in every session (see the Major Indices table). Because AI-linked technology supplied most of the S&P 500’s gain this year, the unwind is an index problem, not a sector one: the S&P 500 posted its deepest weekly decline since June while the Dow rose.
What to watch:Lam Research and Texas Instruments after the close on Wednesday, October 21, and Western Digital on Thursday, October 22 — the first hardware and equipment results since the rout, and the test of whether order books hold while the stocks do not.
BEARISH
2. AI’s Credit Test: JPMorgan and Goldman Won’t Underwrite a Chip-Backed Loan, CoreWeave’s Bonds Break 15% and Its Default Gauge Hits a Record, and Anthropic’s IPO Talk Drops Toward $1.5 Trillion
The core facts:On Monday Bloomberg reported that JPMorgan and Goldman Sachs, leading a $5 billion loan sale for AI cloud company Volta Infrastructure, had underwritten only a $1.3 billion term loan and left a $3.7 billion chip-backed loan without bank underwriting; Broadcom’s Hock Tan likened many AI investors to gamblers the same day. On Wednesday CoreWeave’s bond yields rose above 15%, a level Bloomberg associated with distress, and the stock fell 15.46%; Oracle dropped 8.83% with no confirmed catalyst, and GE Vernova, Vertiv and Eaton fell with it. On Thursday CoreWeave’s credit-risk gauge hit a record, pricing roughly 60% default odds, before Nvidia’s Jensen Huang said its “strength is improving every day” and the stock closed up 5.94%. On Friday CoreWeave fell 12%, about 25% over five sessions, and Reuters reported some Anthropic investors discussing a valuation of about $1.5 trillion for its planned November IPO against roughly $2 trillion previously expected — two days after Anthropic told prospective investors its third-quarter revenue reached $16.8 billion with adjusted profitability.
Why it matters:The week moved the AI debate from “is there demand?” to “who finances it, and at what price?” — and the answers came from lenders, not equity analysts. Banks declining to hold chip-collateral risk, distressed-level yields on the sector’s best-known neocloud and a reported $500 billion markdown in the year’s largest private valuation all point the same way, and they arrived in a week when Anthropic’s revenue and adjusted profit were the strongest proof yet that the product sells. Demand is not the constraint; the cost of capital is. With the 10-year still above 5%, the pressure lands hardest on the weakest borrowers first, and the week’s non-financial evidence — Google’s 20-year Bloom fuel-cell deal with AEP and Microsoft’s 1,100 MW agreement with NiSource — shows the hyperscalers are still committing, which makes the gap between them and their debt-funded suppliers the fault line to watch.
What to watch:Meta’s third-quarter report after the close on Wednesday, October 21, the first hyperscaler capex update since the credit scare; CoreWeave’s bond yields; and any formal Anthropic IPO filing that puts audited numbers behind the valuation debate.
BEARISH
3. The Gulf War Reaches Saudi Arabia’s Oil Arteries: Riyadh’s Airport, Aramco’s Headquarters, Then a Missile at Yanbu as Iran Calls Hormuz “Closed” — WTI +11% and Above $100
The core facts:A missile strike on Riyadh’s King Khalid International Airport on Saturday, October 10 killed 12 people, including a US citizen, and on Sunday Iran called the US reply to its conditions for reopening the Strait of Hormuz “insufficient” and said it would not open the strait until they were met. On Tuesday a Houthi attack set part of Saudi Aramco’s Dhahran headquarters on fire, hours after the group told people near every Aramco facility to evacuate. Iranian officials said on Wednesday they had begun “different offensive tactics” against shipping, and on Thursday Rear Admiral Habibollah Sayyari said “The Strait of Hormuz is closed,” while the EIA reported an 8.6-million-barrel US crude draw. On Friday a Saudi-led coalition intercepted a ballistic missile launched toward the Red Sea export port of Yanbu, with no damage reported, and Brent touched $110 before settling at its highest since May 19, even as the Energy Department offered to exchange up to 17 million barrels from the Strategic Petroleum Reserve. Treasury designated 26 targets in Iran’s oil-revenue and shadow-banking network on Thursday.
Why it matters:The geography changed this week. Yanbu is how Saudi crude reaches market around Hormuz, so a missile aimed there threatens the bypass the oil market has been counting on, and strikes on the capital and on Aramco’s corporate seat show no Saudi asset is out of range. That is why crude rose on every session and kept rising through an SPR offer and an IEA fuel release (WTI +11.08% and Brent +5.26% on the week — see the Energy table in Section B; Energy the second-best sector — see the sector rotation table; Chevron among the top weekly gainers). For the macro read it is the worst combination: an energy shock arriving in the same week September’s consumer, producer and import prices all ran hot.
What to watch:Whether Brent holds above $110 on any further Gulf incident, Hormuz transit counts, Wednesday’s EIA inventory report on October 21 for a second large draw, and the OPEC+ meeting on November 1.
UNCERTAIN
4. The Strategists Turn: Citi and BlackRock Pull Back on US Stocks and RBC Swaps Tech for Health Care, as Staples, Healthcare and Energy Take the Week and the Dow Rises While the Nasdaq Falls 5.5%
The core facts:The week opened with Goldman Sachs going the other way, raising its three-month view on global equities to overweight on Monday. On Tuesday Citi dropped its overweight on US equities, saying its POLLS sentiment gauge had reached levels that historically coincided with peaks, and the BlackRock Investment Institute cut US equities to neutral “to manage potential volatility around the AI buildout” while ending a Treasury underweight it had held for most of six years. On Wednesday RBC upgraded health care to overweight and downgraded technology to market weight on valuation, and Consumer Defensive (+2.30%) and Healthcare (+2.05%) carried the session. On Friday six of 11 sectors rose while the Nasdaq 100 fell 2.50%, led by Energy, Consumer Defensive and Utilities. Walmart, Coca-Cola, Eli Lilly, Home Depot and Chevron were the week’s five best mega-cap performers.
Why it matters:Three large houses cutting tech or US equity exposure inside two sessions is a positioning event, and the tape followed it to the letter: money moved within equities rather than out of them, which is why the Dow and NYSE Composite rose on a week the Nasdaq 100 fell in all five sessions (see the Major Indices table in Section B; Consumer Defensive the week’s top sector — see the sector rotation table). None of the calls says AI demand is breaking — RBC’s case is valuation and BlackRock kept its conviction in AI fundamentals — so this reads as a valuation-led reweighting that tends to run steadily rather than snap back. The open question is breadth: an index that rises only when defensives lead is a weaker index, and the rotation cannot carry the S&P 500 if tech’s weight keeps falling.
What to watch:Whether the defensive leaders’ earnings justify the flows — Thermo Fisher, Abbott and Danaher on Wednesday, October 21, and Procter & Gamble on Thursday, October 22.
BEARISH
5. The Selloff Reaches Software and Security: Palo Alto, Palantir and CrowdStrike Each Fall More Than 7% on Friday, Leaving Palo Alto and CrowdStrike Down 17–18% for the Week
The core facts:The week began with security names already under pressure: CrowdStrike fell 4.37% and Palo Alto Networks 3.57% on Monday, and on Wednesday a report that OpenAI was exploring a purchase of security firm Trail of Bits hit the group again. On Friday the AI-funding selloff spread into software with no company-specific news: Palo Alto fell 7.63%, Palantir 7.22% and CrowdStrike 7.02%, the three largest mega-cap declines of the day, while SentinelOne lost 7.66% and Zscaler 5.92%. Palantir’s fall unwound its breakout to a $213 record high. Communication Services fell 2.22% the same day. Earlier in the week, BofA’s Monday double-upgrade of Salesforce, on the view that AI would deepen enterprises’ reliance on its platform, had briefly argued the opposite case.
Why it matters:Security software companies are not the borrowers the financing worry is about, so their fall shows the market de-rating the whole AI-linked growth complex rather than pricing specific credit risk. Fundamentals were not setting prices: Palo Alto had just grown quarterly revenue 35%, and both security names had more than doubled over six months, so the selling looks like crowded positioning unwinding (Palo Alto and CrowdStrike among the five largest weekly decliners — see the weekly movers table in Section B). The OpenAI–Trail of Bits report added a second, slower-burning worry: that AI developers become competitors to the vendors who secure them.
What to watch:IBM’s report after the close on Wednesday, October 21, the week’s main read on enterprise software demand, and whether security stocks stabilise once the AI-hardware selling slows.
BEARISH
6. The Diesel Truce Unravels: Trump’s Russia-Ukraine “Energy Ceasefire” and Moscow’s 500,000-Ton Diesel Release Give Way to Renewed Refinery Strikes by Friday, as Washington Reaches for Wartime Powers and Emergency Stocks
The core facts:On Sunday, October 11 President Trump announced a Russia-Ukraine energy truce, a day after Russia partially lifted its diesel export ban to let 500,000 tons be sold abroad; Russia struck Kharkiv’s power plant that evening and the Kremlin declined to confirm the arrangement. On Tuesday the administration used the Defense Production Act to expand Delek’s Tyler, Texas refinery, with AAA putting diesel at $6.28 a gallon. On Thursday Ukrainian drones set a refinery in Russia’s Ryazan region on fire and President Zelenskyy told the Financial Times the refinery-strike pause was over: “We’re done.” The same day the IEA said members would release “over 20 million barrels of diesel as soon as possible,” US distillate stocks stood 12% below average, and Reuters reported Washington weighing an easing of sanctions on shadow-fleet tankers. By Friday Ryazan had halted a crude distillation unit and drones had struck a facility near Surgut.
Why it matters:Diesel is the part of the energy shock that reaches freight, farms and heating bills directly, and every relief lever pulled this week depended on Russian refineries staying online — the truce that collapsed by Thursday was meant to guarantee exactly that. With the ceasefire gone, the policy response shifted to slower and smaller tools: one refinery expansion that takes months, an emergency stock release and a sanctions tweak aimed at freight costs. Against Story #3’s Gulf escalation, the week left the US with no fast fix for its tightest fuel market heading into winter.
What to watch:Whether Russia extends its export relief when the broader diesel ban expires on October 31, the US tariff decision on India’s Russian-oil purchases due around October 25, and Valero’s results on Thursday, October 22, for refining margins and diesel output.
— Separating signal from noise since 2007. Apply for membership at join.recessionalert.comD. WEEK IN THE ECONOMY -> TOP
The week’s tension was a policy-vs-data divergence. September’s inflation ran hot at every stage of the price chain — consumer prices up 3.7% on the year, producer prices up 1.3% in a single month, import prices up 8.1% on the year — while the Fed’s leadership leaned toward patience: Williams saw one more hike at most, Bowman felt no urgency and Warsh declined to prejudge October. Markets sided with the leadership rather than the data. October hike odds jumped to about 47% after CPI, then collapsed to a priced hold by Friday, and both the 2-year and 10-year yields finished the week lower (see the Vol & Treasuries table in Section B), while Polymarket’s odds of a cut this year slipped a point. The next test comes Friday, October 23, when the final October Michigan survey shows whether consumers’ year-ahead inflation expectations kept climbing from the preliminary 4.7%.
POLYMARKET ODDS — WEEK-ON-WEEK SHIFT:
| Market | Last Friday | This Friday | Δ |
|---|---|---|---|
| US Recession by end-2026 | 7% | 7% | 0.0 pp |
| Fed rate hike in 2026 | 100% | 100% | 0.0 pp |
| Fed rate cuts ≥1 in 2026 | 4% | 3% | −1.0 pp |
BEARISH
CPI 3.7% YoY — Hotter Than the 3.6% Consensus, With Core Firming to 2.6% (BLS, Wed Oct 14)
What they’re saying:Consumer prices rose 0.6% in September, matching forecasts, and the annual rate climbed to 3.7% from 3.4% against a 3.6% consensus. Gasoline jumped 9.1% and supplied more than half of the monthly increase, with the energy index up 5.2%. Core CPI rose 0.3% for a second straight month against 0.2% expected, lifting the annual core rate to 2.6% from 2.4%, above the 2.5% forecast; shelter rose 0.4% while food was unchanged. Chicago Fed President Goolsbee called the report “discouraging.”
The context:This was the print that set the week’s rates path in motion, and the market’s verdict changed twice. On release day CME FedWatch odds of an October hike roughly doubled to about 47%, Citi moved to a December hike call, the Nasdaq 100 fell 2.02% and silver dropped 6.26%. By Friday October hold odds stood at 85.1% and the 2-year yield was lower on the week, so the print pushed the next move out rather than forward. The core beat matters more than the gasoline headline: energy can be looked through, a second 0.3% core month is harder to dismiss, and the record diesel prices reported this week suggest the energy component is not finished.
What to watch:The final October Michigan inflation-expectations reading on Friday, October 23, then the FOMC decision on October 28.
BEARISH
PPI +1.3% vs 0.5% Consensus, the Largest Monthly Gain Since March 2022, Then Import Prices +1.1% and 8.1% YoY — Pipeline Pressure Spreads Beyond Fuel (BLS, Thu Oct 15 & Fri Oct 16)
What they’re saying:The Producer Price Index for final demand rose 1.3% in September against a 0.5% forecast, lifting the 12-month rate to 6.3%, the highest since December 2022. Goods prices rose 2.6%, the largest increase since the series began in 2009, with energy up 10.8% and gasoline 20.3%; core PPI rose 0.7% against 0.3% expected, and prices excluding food, energy and trade services rose 0.5% on the month and 5.0% on the year. On Friday import prices rose 1.1% against a 0.8% consensus, an 8.1% annual pace and the largest since July 2022; nonfuel import prices rose 0.7%, taking their annual gain to 6.0%, the most since April 2022.
The context:The nonfuel import reading and the 0.7% core PPI are what turn an oil story into a broader inflation story: pressure is now visible in imported goods and producer margins that have nothing to do with the pump. The bond market nonetheless rallied into both releases — the 10-year fell 10.2 bps on PPI day, its largest drop since June 11, and the 2-year fell on import-price day — with October hike odds fading from about 34% after PPI to a priced hold by Friday. That reaction is the clearest sign this week that investors now fear what further tightening does to growth more than they fear the inflation itself.
What to watch:Whether Brent holds near $110, which would carry fuel import inflation into October’s report, and the FOMC’s October 28 statement language on goods-price pass-through.
UNCERTAIN
Hawks Line Up, Leadership Holds Back: Hammack, Collins and Waller Lean Toward More Tightening, Williams Caps the Cycle and Warsh Won’t Prejudge October (Federal Reserve officials, Mon Oct 12 – Fri Oct 16)
What they’re saying:On Monday Cleveland’s Beth Hammack said a restrictive stance is appropriate and that higher yields had left financial conditions only neutral. On Tuesday Boston’s Susan Collins said it will likely be “appropriate to raise rates a bit further before the end of the year,” New York’s John Williams said “it may be appropriate to have one more rate hike” but saw no reason to expect more, and Governor Christopher Waller said AI-driven inflation pressure “could last anywhere from two to three years”; discount-rate minutes showed seven Reserve Banks had sought a higher rate by the September hike. Before Wednesday’s CPI, Vice Chair for Supervision Michelle Bowman said she felt no urgency for further action. On Friday Chair Kevin Warsh said “I don’t prejudge meetings” in his last remarks before the blackout.
The context:The regional presidents argued for more and the committee’s leadership declined to commit, and the market priced the leadership: CME FedWatch odds of an October hold rose to 85.1% from 72.3% on Friday, while Barclays moved its call to hikes in both December and January and Citi to December. The hike was deferred, not dropped — Polymarket still prices a 2026 increase as certain. Waller’s view that AI investment is itself inflationary for two to three years gives the hawks an argument that survives a fall in oil, which is why the curve can rally without the hiking cycle ending.
What to watch:The pre-meeting blackout began Saturday, October 17; the FOMC decides at 2:00 PM ET on Wednesday, October 28.
UNCERTAIN
Growth Holds Up: Industrial Production +0.7% vs 0.4%, Claims 199K and GDPNow 3.6% — but the Retail Control Group Rises Just 0.1% (Census Bureau, Federal Reserve, Labor Department, Atlanta Fed; Thu Oct 15 & Fri Oct 16)
What they’re saying:Retail sales rose 0.8% in September against a 0.3% forecast, but the control group that feeds GDP rose only 0.1% against 0.3% expected, after 1.2% in August. Initial jobless claims were 199,000, in line with forecasts, and continuing claims fell to 1.71 million. The Empire State index jumped to 25.5 against a 10.3 forecast while the Philadelphia Fed gauge cooled to 20.9, short of 28.4. On Friday industrial production rose 0.7% against a 0.4% consensus, with manufacturing up 0.3% and capacity utilisation at 76.9%. Atlanta Fed GDPNow held third-quarter growth at 3.6%.
The context:The economy absorbing the inflation shock is still running above trend, which removes any growth-side case for the Fed to pause. The caveats sit in the composition: the retail beat was mostly gasoline, so volumes barely grew, and inventory building supplies roughly half of the GDPNow estimate, a contribution that tends to reverse. A labor market with claims below 200,000 and a nowcast near 3.6% is the backdrop that makes the bond market’s weekly rally a bet on future slowing rather than a response to present weakness.
What to watch:The Atlanta Fed GDPNow update on Tuesday, October 20, and initial jobless claims on Thursday, October 22.
BEARISH
Housing’s Funding Squeeze: Mortgage Rates Hit 7.5%, the Highest Since November 2023, and Lenders Pull Mortgage-Bond Deals as Investors Demand More Yield (MBA, NAR, Freddie Mac, Bloomberg; Tue Oct 13 – Fri Oct 16)
What they’re saying:Existing-home sales rose 1.5% in September to a 3.99 million pace, above the 3.95 million consensus, but NAR’s Lawrence Yun said August and September were the year’s two slowest months. On Wednesday the MBA put the 30-year fixed rate at 7.5%, the highest since November 2023, with applications down 2.7%, purchase applications down 4% and the adjustable-rate share up to 10.5%. Freddie Mac’s 30-year rate held at 7.40% on Thursday against 6.27% a year earlier. On Friday Bloomberg reported a growing list of lenders holding off on mortgage-backed bond sales, with a Figure Technology unit postponing a $346 million RMBS after struggling to attract demand.
The context:Housing is where higher long rates reach households fastest, and the week added a second channel: when securitisation stalls, non-bank lenders must hold loans longer or charge more, tightening mortgage credit on top of the rate itself. The shift toward adjustable-rate loans adds reset risk to household balance sheets. The 10-year’s weekly decline offers relief only if it lasts; at 5.09% it still sits far above the year-ago level that set 6.27% mortgages.
What to watch:The NAHB Housing Market Index on Monday, October 19, then September housing starts, building permits and pending home sales on Tuesday, October 20.
— Know the probability before the market prices in the risk. Apply for membership at join.recessionalert.comE. WEEK IN EARNINGS -> TOP
TOP EARNINGS OF THE WEEK
BEARISH
1. Bank of America (BAC): −4.76% on Results Day | EPS Misses by 17% as Market-Making Revenue Falls 26% and Expenses Jump 14%, a Day After a $1.2 Billion AML Penalty
The Numbers:Reported before the open on Wednesday, October 14. EPS $0.91 vs. $1.10 estimate (−17.1%), down from $1.04 a year earlier; revenue net of interest expense $29.96 billion vs. $30.58 billion expected, up 3.2% year on year. Net income $6.93 billion vs. $8.33 billion a year ago. Net interest income rose 8.0% to $16.45 billion. Market-making revenue fell 26.3% to $2.36 billion and investment banking fees 10.6% to $1.80 billion. Noninterest expense rose 13.8% to $19.72 billion, with other general operating expense up to $2.33 billion from $0.91 billion; provision $1.27 billion.
The Problem/Win:The miss came from trading and costs, the two lines the rest of the group got right. Goldman’s equities revenue jumped 72% and JPMorgan’s 49% in the same quarter, so Bank of America’s 26% fall in market-making was a franchise-specific shortfall, not an industry one. The release figures do not itemise Tuesday’s $1.2 billion FinCEN penalty (OCC portion $750 million, the largest in its history), so the size of the one-off component inside the expense jump cannot be read from them. Net interest income was the one clean positive.
The Ripple:Bank of America led the financials lower on results day, with State Street down 4.14%, Morgan Stanley 2.75% and Citigroup 1.81%, and the sector fell 0.88%. The same day the OCC’s final debanking report named it among nine large banks that restricted access, and the CFPB opened investigations — a second regulatory overhang within 24 hours. The group recovered on Thursday’s bond rally, leaving Financials up 0.85% on the week.
What It Means:Bank earnings split by franchise this week: the trading-and-advisory houses delivered, and the universal bank carrying a cost blowout and a compliance overhang did not. Until expenses normalise and remediation costs are quantified, Bank of America lacks the operating leverage its peers showed.
What to watch:Capital One after the close on Tuesday, October 20, and American Express on Friday, October 23, for consumer-credit read-through, plus the first CFPB investigative demands to the named banks.
UNCERTAIN
2. ASML Holding (ASML): −3.94% on Results Day | EPS Beats by 19% and a Fourth-Quarter Guide Implies a 21–30% Sequential Jump, but the Stock Falls With the Chip Rout
The Numbers:Reported before the open on Wednesday, October 14. EPS $14.50 vs. $12.17 estimate (+19.1%); revenue $13.05 billion vs. $13.14 billion estimate (−0.7%). In euros: third-quarter net sales €11.7 billion, gross margin 57.5%, net income €5.0 billion. Fourth-quarter guidance: net sales of €14.2–15.2 billion at a gross margin of about 57%. Full-year 2026 outlook: net sales of €44–45 billion at about 56%. Share buybacks of about €4.1 billion in the quarter; no bookings figure disclosed.
The Problem/Win:The win is in the guide: fourth-quarter sales of €14.2–15.2 billion sit 21–30% above the third quarter’s €11.7 billion, at a margin close to this quarter’s, and CEO Christophe Fouquet said planned supply for 2027 and 2028 “will not fully meet the demand of our customers.” The soft spots were a slight revenue shortfall against consensus and the absence of a bookings number, which left investors without the order figure they most wanted in a week asking whether tool demand will outlast the financing worries.
The Ripple:The print landed a day after Applied Materials fell 6.69% on its investor day and did not stop the equipment group: Lam Research fell 4.71% the same day and finished among the week’s six largest mega-cap decliners, alongside Applied Materials.
What It Means:The equipment cycle’s fundamental signal strengthened while its share prices fell, so the group now trades against its own guidance; a 2027 capacity shortfall is the opposite of what a peak-cycle de-rating usually prices.
What to watch:Lam Research after the close on Wednesday, October 21, for whether its wafer-fab-equipment outlook corroborates ASML’s demand view.
BULLISH
3. UnitedHealth Group (UNH): +5.83% Week | Beats by 13% and Raises Its 2026 Adjusted EPS Floor to $20.50 as Margins Recover at Both UnitedHealthcare and Optum
The Numbers:Reported before the open on Tuesday, October 13. Adjusted EPS $4.69 vs. $4.14 consensus (+13.3%), up from $2.92 a year earlier; GAAP EPS $4.56. Revenue $112.69 billion vs. $111.31 billion expected, down about 0.4% year on year. Medical care ratio 88.4% vs. 89.9%, including $610 million of favorable prior-period reserve development. UnitedHealthcare operating earnings $2.8 billion (margin 3.3% vs. 2.1%); Optum operating earnings $3.7 billion (margin 5.6% vs. 3.6%), with Optum Health at $735 million vs. $41 million. Full-year 2026 guidance raised to adjusted EPS of at least $20.50.
The Problem/Win:Margin repair ran ahead of plan in both businesses, and Optum Health’s jump from $41 million to $735 million of operating earnings is the turnaround in one line. The caveat is quality: part of the medical-cost improvement came from releasing prior-period reserves rather than from current trends.
The Ripple:The reward came a day late. The stock slipped 0.20% on results day as Johnson & Johnson’s 5.73% fall dragged Healthcare to the weakest sector, then rose 4.73% on Wednesday as Mizuho reiterated it as its top healthcare pick and RBC upgraded the sector — finishing among the week’s ten best mega-cap performers as Healthcare gained 2.20% on the week.
What It Means:A beat-and-raise that found buyers only once the sector rotation arrived says managed care is being bought as a defensive with earnings momentum, not as a recovery trade in its own right.
What to watch:Monday’s trading in UnitedHealth, CVS and Cigna after Friday’s CMS proposal to limit pharmacy-benefit-manager remuneration in Medicare Part D, which reaches Optum Rx.
WEEK AHEAD PREVIEW:
Q3 2026 earnings season is 9% complete and enters its first heavy week, with the first mega-cap technology reports arriving after this week’s AI-financing selloff. Twenty-seven companies worth more than $100 billion report over the next five sessions, twelve of them on Wednesday, October 21. No company above $100 billion reports on Monday, October 19.
GE Aerospace (GE) — BMO, Tuesday, October 20 — EPS est. $2.01. Aftermarket services growth and engine delivery rates against supply-chain constraints.
RTX (RTX) +3.73% — BMO, Tuesday, October 20 — EPS est. $1.78. Missile and munitions demand linked to the Gulf conflict, and commercial aftermarket at Pratt & Whitney and Collins.
Netflix (NFLX) -2.8% — AMC, Tuesday, October 20 — EPS est. $0.82. Margin guidance after the cut of about 6% of staff, advertising-tier momentum, and content strategy under newly appointed chief content officer Peter Rice.
Intuitive Surgical (ISRG) — AMC, Tuesday, October 20 — EPS est. $2.65. Procedure growth and system placements.
Chubb (CB) — AMC, Tuesday, October 20 — EPS est. $6.79. Catastrophe losses and commercial pricing, after Progressive’s revenue miss.
Capital One (COF) — AMC, Tuesday, October 20 — EPS est. $5.50. Card credit quality and consumer spending trends, after September’s control-group retail sales rose only 0.1%.
Meta Platforms (META) — AMC, Wednesday, October 21 — EPS est. $6.58. Any change to AI capital-spending plans, the first hyperscaler read since the AI-financing selloff and the reported markdown in Anthropic’s IPO valuation.
Tesla (TSLA) — AMC, Wednesday, October 21 — EPS est. $0.45. Automotive gross margin after third-quarter deliveries of 486,532 beat expectations, plus Robotaxi scale-up and the Optimus timeline.
Lam Research (LRCX) — AMC, Wednesday, October 21 — EPS est. $2.18. Wafer-fab equipment outlook and China revenue mix, with the chip index on an eight-session losing streak.
Philip Morris International (PM) +2.65% — BMO, Wednesday, October 21 — EPS est. $2.30. Smoke-free volume growth and currency effects, after the company guided the quarter below consensus.
Thermo Fisher Scientific (TMO) — BMO, Wednesday, October 21 — EPS est. $6.40. Life-science tools demand and pharma spending.
Texas Instruments (TXN) — AMC, Wednesday, October 21 — EPS est. $2.42. Whether analog price increases are flowing through, and automotive and industrial demand.
IBM (IBM) — AMC, Wednesday, October 21 — EPS est. $2.86. Whether large enterprise deals delayed in the second quarter closed in the third, and software growth after this week’s software selloff.
Abbott Laboratories (ABT) — BMO, Wednesday, October 21 — EPS est. $1.42. Medical-device growth and diagnostics trends.
NextEra Energy (NEE) — BMO, Wednesday, October 21 — EPS est. $1.18. Data-center power contracting and renewables backlog, with the 10-year yield above 5%.
Danaher (DHR) — BMO, Wednesday, October 21 — EPS est. $1.92. Core revenue growth after the company cut its 2026 core growth forecast in July.
AT&T (T) — BMO, Wednesday, October 21 — EPS est. $0.60. Wireless subscriber trends amid SpaceX competition concerns, and the agreed $2 billion sale of AT&T Mexico.
CME Group (CME) — BMO, Wednesday, October 21 — EPS est. $2.98. Futures volumes in a quarter of Fed repricing and energy volatility. Market cap $105.67B, within 5% of the $100B threshold.
Procter & Gamble (PG) — BMO, Thursday, October 22 — EPS est. $1.88. Volume versus pricing as producer prices jump, with Consumer Defensive the week’s best-performing sector.
Union Pacific (UNP) — BMO, Thursday, October 22 — EPS est. $3.47. Freight volumes and fuel-cost pass-through with WTI above $100, plus the pending Norfolk Southern merger review.
Blackstone (BX) — BMO, Thursday, October 22 — EPS est. $1.28. Real-estate and private-credit fundraising and deployment with the 10-year above 5%, and exposure to AI data-center financing.
Valero Energy (VLO) — BMO, Thursday, October 22 — EPS est. $20.90. Refining margins and diesel output, with US distillate stocks 12% below their five-year average.
Lockheed Martin (LMT) — BMO, Thursday, October 22 — EPS est. $7.52. Munitions and missile-defense demand from the Gulf conflict, and F-35 delivery rates.
Spotify Technology (SPOT) — BMO, Thursday, October 22 — EPS est. $3.15. Subscriber growth and operating margin. Market cap $109.21B; trades as ordinary shares, not an ADR.
Newmont (NEM) — AMC, Thursday, October 22 — EPS est. $1.95. Realised gold prices and cost guidance with gold near $4,190 an ounce.
Western Digital (WDC) — AMC, Thursday, October 22 — EPS est. $4.08. Nearline shipment growth and AI data-center storage demand, after Wells Fargo cut its target to $450 and the stock fell about 7% on Friday.
American Express (AXP) — BMO, Friday, October 23 — EPS est. $4.58. Billed business growth against the second quarter’s 9% FX-adjusted pace, and whether the company holds its raised 10% full-year revenue growth guidance as rates and fuel prices climb.
Excluded as an ADR: SAP (SAP, $258.88B, AMC October 21). Below the threshold: Elevance Health ($92.88B, October 21) and CSX ($90.18B, October 21). The next FactSet scorecard update is due Friday, October 23.
— US market commentary trusted by family offices and institutions. Apply for membership at join.recessionalert.comF. NEXT WEEK SETUP -> TOP
UPCOMING RELEASES:
| Date | Event | Why It Matters |
|---|---|---|
| Mon Oct 19 | NAHB Housing Market Index Oct 10:00 AM (expected 31, prior 32) | The first builder read since mortgage rates hit 7.5% and lenders began pulling mortgage-bond deals; a drop toward 30 would show the funding squeeze reaching new construction, not just resales. |
| Tue Oct 20 | ADP Employment Change Weekly 8:15 AM (prior 24.75K) | With claims below 200,000, a steady weekly private-hiring pace would keep the Fed’s labor-side case for patience off the table ahead of the October 28 decision. |
| Tue Oct 20 | Housing Starts Sep 8:30 AM (expected 1.30M, prior 1.275M) | September starts were planned before rates crossed 7.5%; a beat would show momentum the October data may yet reverse, a miss that the long-end selloff was already biting. |
| Tue Oct 20 | Housing Starts MoM Sep 8:30 AM (prior -2.6%) | A second straight monthly decline would confirm that construction, not just existing-home turnover, is rolling over under 7%-plus mortgages. |
| Tue Oct 20 | Building Permits Prel Sep 8:30 AM (expected 1.40M, prior 1.403M) | Permits lead starts by months, so this is the cleaner forward read on whether builders are cutting pipelines as financing tightens. |
| Tue Oct 20 | Building Permits MoM Prel Sep 8:30 AM (prior -2.1%) | A third monthly fall in a row would turn a soft patch into a trend and feed directly into the growth-slowdown bet the bond market placed this week. |
| Tue Oct 20 | Pending Home Sales MoM Sep 10:00 AM (expected 0%, prior 0.3%) | Contract signings lead closings by one to two months; a flat or negative reading would put the 3.99 million existing-sales pace at risk heading into year-end. |
| Tue Oct 20 | Pending Home Sales YoY Sep 10:00 AM (prior -4.7%) | The annual comparison strips out seasonal noise; a deeper decline would show affordability, not inventory, as the binding constraint. |
| Tue Oct 20 | Atlanta Fed GDPNow Q3 11:00 AM (prior 3.6%) | Folds in Friday’s 0.7% industrial production and Tuesday’s housing data; a hold near 3.6% keeps the growth-side case for a pause closed, while a slide in the inventory component would support the bond rally. |
| Tue Oct 20 | API Crude Oil Stock Change 4:30 PM (prior -11.1M) | The first read on whether last week’s outsized draw repeats; another large draw with WTI above $100 would keep the US-specific squeeze that narrowed the Brent-WTI spread intact. |
| Wed Oct 21 | MBA 30-Year Mortgage Rate 7:00 AM (prior 7.5%) | The first mortgage-rate read after the 10-year’s weekly decline; relief below 7.5% would show the bond rally reaching households, no change would show lenders’ funding costs offsetting it. |
| Wed Oct 21 | EIA Crude Oil Stocks Change 10:30 AM (prior -8.557M) | Confirms or reverses the API signal; a second draw of this size would put the $100 WTI floor on a domestic-supply footing rather than headline risk alone. |
| Wed Oct 21 | EIA Gasoline Stocks Change 10:30 AM (prior 3.518M) | Gasoline drove more than half of September’s CPI rise; a further build would ease the pump-price pressure feeding October’s print, a draw would extend it. |
| Thu Oct 22 | Initial Jobless Claims 8:30 AM (expected 200K, prior 199K) | Williams and Hammack both tied a softer path to labor deterioration; claims holding near 200,000 leave that condition unmet in the last labor read before the FOMC. |
| Fri Oct 23 | Michigan Consumer Sentiment Final Oct 10:00 AM (expected 46.3, prior 48.1) | The week’s decisive print for the Fed: the final survey shows whether year-ahead inflation expectations rose past the preliminary 4.7% after September’s hot price reports, the one input that would make energy hard to look through. |
WHAT TO WATCH NEXT WEEK:
1. Can Meta’s capex guidance on Wednesday, October 21 stop the AI-hardware unwind? It is the first hyperscaler report since CoreWeave’s bonds broke 15%; a reaffirmed or raised spending plan would answer the demand question, but not the financing one the market is now asking about the companies that build the capacity.
2. Do Lam Research, Texas Instruments and Western Digital confirm ASML’s demand view? With the semiconductor index on an eight-session losing streak, equipment and storage order books holding up on October 21–22 would mark the rout as a valuation reset rather than a cycle turn.
3. Will the Fed’s priced October hold survive Friday’s final Michigan survey? The blackout leaves data, not officials, to move pricing before the October 28 decision, and a rise in year-ahead inflation expectations past 4.7% is the one release that could put October back in play.
4. Does Brent hold $110 with Yanbu now a target? The Saudi bypass around Hormuz is the market’s safety valve; another strike there, or no Russian decision to widen diesel exports before its broader ban expires on October 31, would test whether $100 WTI is a ceiling or a floor.
5. Can the defensives earn their flows? Thermo Fisher, Abbott and Danaher on October 21 and Procter & Gamble on October 22 report after a week in which staples led every sector and healthcare finished third; misses would leave the rotation looking like a parking trade rather than a new leadership.
— US market commentary trusted by family offices and institutions. Apply for membership at join.recessionalert.comG. CHART OF THE WEEK -> TOP
WHY THIS CHARTThursday’s oil-shock comparison told the week’s inflation story and Tuesday’s chart told part of the AI story, but this is the one candidate that explains why the AI selloff landed so hard on the whole index: the stock market’s only margin over a 5% Treasury is an earnings forecast, and this was the week investors began doubting the profits behind that forecast. It joins the week’s two forces — long yields above 5% and a loss of faith in AI returns — on a single valuation line.
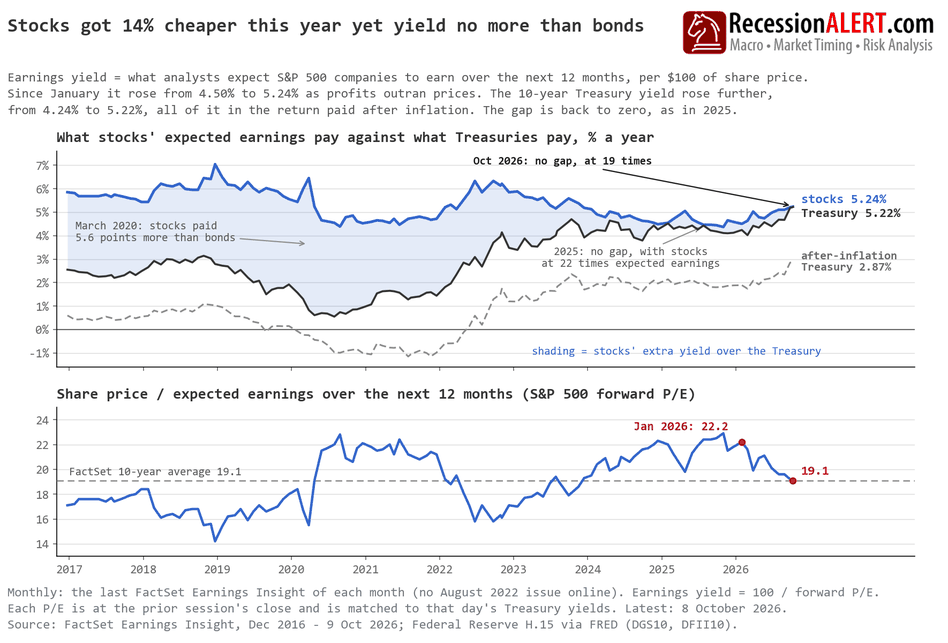
ORIGINAL CHART ANALYSIS — FROM WEDNESDAY’S MIBThe S&P 500 got 14% cheaper this year while climbing 11.4% — earnings did the cheapening, not prices. Since late January analysts have lifted their forecast of the next 12 months’ earnings by 29.5%, so the price paid for each dollar of those earnings slid from 22.2 to 19.1, exactly its ten-year average. That should have opened a cushion over bonds; instead the 10-year Treasury rose nearly a point, all of it in the return left after inflation — 1.89% to 2.87% — with inflation expectations unmoved, under a Fed that hiked in September and is weighing another. Bonds absorbed the whole discount. Stocks’ earnings yield, expected profits per $100 of price, matched the Treasury’s in 2025 too, but stocks were dear then, at 22 times. Measured against the inflation-protected Treasury — the fairer yardstick, since profits tend to rise with prices while a bond’s coupon does not — stocks’ margin is about 2.4 points: wider, yet level with early 2025 as the thinnest in the decade charted. Parity with the ordinary Treasury rests on a forecast: on earnings companies have actually reported, stocks earn about 3.85% of their price, some 1.4 points below the 10-year, and growth is expected to slow from 32.7% in 2026 to 15.8% in 2027. Trim the forecasts and stocks slip beneath the Treasury, which has not happened once in the 118 months charted. This discount was written by analysts, not sellers — and analysts can take it back. What it means: Savers can now lock in about 5.2% a year on a 10-year Treasury, or 2.9% above inflation on the inflation-protected kind. That matches stocks’ expected earnings per dollar, with no forecast needed. For stock investors, unless that yield falls, gains will have to come from profits arriving as forecast, not richer valuations. For the economy, the 10-year anchors long-term borrowing costs for homebuyers and companies, and nearly 3% above inflation will keep them high. The read changes if the 10-year falls toward January’s 4.2% while forecasts hold, giving stocks a cushion of about a point.
MIB Weekly Digest Ver. 2.07
For professional investors only. Not investment advice.
© 2026 RecessionALERT.com

Comments are closed.