
MIB WEEKLY DIGEST
Week of Aug 10–14, 2026
AI capital expenditure moved onto the credit market’s balance sheet this week: Goldman began syndicating Nvidia’s $500 billion financing programme, and the market immediately split the complex — AMD +6.42% after pricing a $4.75B bond through talk, Broadcom -8.13% on a $370B off-balance-sheet estimate. Brent gained 7.65% as Hormuz transits fell to six vessels a day and the UAE accused Iran of piracy. SanDisk surged 35.38% on memory scarcity that simultaneously cost Cisco 210 basis points of gross margin. And two disinflation prints took hike odds to 49% before Friday’s retail sales miss (-0.6%) sent yields the wrong way.
TABLE OF CONTENTS
A. WEEK AT A GLANCE
B. WEEK IN MARKETS
C. WEEK’S TOP STORIES (9)
D. WEEK IN THE ECONOMY (5)
E. WEEK IN EARNINGS (3)
F. NEXT WEEK SETUP
G. CHART OF THE WEEK
A. WEEK AT A GLANCE -> TOP
The S&P 500 gained 0.36% on the week, a third consecutive weekly advance that contained a record close, a fresh intraday record and a Friday reversal inside five sessions. The dominant driver was not a data release but the migration of AI capital expenditure onto the credit market’s balance sheet: Goldman Sachs began syndicating Nvidia’s $500 billion financing programme to insurers and private credit, and the week ended with a 14.5-point performance gap between the AI issuer that disclosed its debt and the one that did not. Beneath that, two disinflation prints took 2026 hike odds down to 49% while a sitting Fed president escalated to demanding an immediate hike — and by Friday the bond market was selling duration into weak consumer data rather than buying it.
• The Dow was the only major index to finish red, at -0.56% — and only because Cisco (-8.03%), Home Depot (-4.71%) and Amazon (-4.31%) are all Dow constituents and all landed among the week’s five worst mega-cap decliners. Russell 2000 +1.21%, NYSE Composite +0.92%.
• Brent +7.65% and Energy the top sector at +5.56% as Hormuz transits collapsed to six vessels a day against a pre-war 140, and the UAE formally accused Iran’s Revolutionary Guard Corps of piracy after two ADNOC tankers were struck — the fifteenth attack on that fleet since February.
• SanDisk +35.38% was the week’s largest mega-cap move, on ninth-generation 2Tb QLC NAND with Kioxia and an Investor Day guiding to roughly 80% non-GAAP gross margins for 2028-2030; Micron gained 10.72% on the same memory scarcity that cost Cisco 210 basis points of gross margin.
• AMD +6.42% against Broadcom -8.13% — the same end market, opposite capital structures. AMD priced a $4.75 billion bond 25 basis points through talk; Broadcom fell on a sell-side estimate of $370 billion of off-balance-sheet debt it partially backstops.
• July retail sales fell 0.6% and August sentiment printed 51.0 — the steepest sales drop in 14 months and an 8% fall in sentiment, with one-year inflation expectations rising to 4.3% into the miss. Atlanta Fed GDPNow was cut to 4.3% from 5.8% eight days earlier.
• The largest US crude build since January 2023 — 17.4 million barrels against a 1.4 million draw expected — landed on the same morning the IEA doubled its third-quarter global deficit to 1.8 million barrels a day, the deepest since 2021.
1. Structure Is Now Priced Above Story — the credit market spent the week discriminating within AI capex on disclosure rather than business quality, and the pattern held across instruments: an on-balance-sheet bond was rewarded, an estimated off-balance-sheet backstop was punished by 14.5 points more, a five-times-covered $20 billion equity book cleared at a 2.6% discount, and a $43 billion software take-private found financing on the same day.
2. The Sector Average Stopped Carrying Information — three separate index and sector lines this week were artefacts of a handful of constituents rather than descriptions of breadth: Technology’s +1.37% spans a 43-point range from SanDisk to Broadcom, Consumer Cyclical’s -1.65% is largely two names, and the Dow’s -0.56% is three. Reading any of them as a market signal would have been wrong in the same way.
3. Weak Growth Stopped Lowering the Discount Rate — retail sales, sentiment and GDPNow all deteriorated, yet the 10-year rose 4.5 basis points on the week and both ends of the curve sold off on Friday’s misses. With a record $432 billion July deficit and tariff receipts running negative, soft data now arrives carrying an inflation-expectations problem and a supply problem instead of the rate relief equity investors normally collect.
4. The Constraint Moved From Production to Shipping — Saudi Aramco abandoned the monthly allocation formula that has anchored Asian crude pricing for decades because buyers cannot secure hulls, Ukrainian grain exports fell 76% at harvest peak with Odesa unreachable, and US crude inventories posted their largest build in three and a half years. Those three facts only reconcile if the binding constraint is vessels rather than barrels — which is why freight and war-risk premia, not production, are now the marginal cost of energy.
 — Leading economic indicators. Accurate market forecasts. Apply for membership at join.recessionalert.com
B. WEEK IN MARKETS -> TOP
The week’s driver was not a data release but a financing decision: Goldman Sachs began syndicating Nvidia’s $500 billion AI-infrastructure programme to insurers and private credit, and the market immediately started charging different prices for different capital structures — AMD gained 6.42% after pricing a $4.75 billion bond through talk, while Broadcom lost 8.13% on a sell-side estimate of $370 billion in off-balance-sheet debt it partially backstops. Beneath that, an in-line CPI and a flat PPI priced 2026 hike odds from roughly 55% to under 35% and carried the S&P to a record 7,799.19 on Thursday, before Friday’s retail sales and sentiment double miss took it back. The most instructive divergence is the Dow’s: it was the only major index to finish red, and only because Cisco, Home Depot and Amazon — all Dow members — were among the five worst mega-cap decliners of the week.
FRIDAY CLOSE & WEEK-ON-WEEK CHANGE — Friday, August 14, 2026:
MAJOR INDICES
The Dow was the week’s only red index, and the reason is constituent overlap rather than macro: Cisco, Home Depot and Amazon are all Dow members and all finished among the five worst mega-cap decliners. Strip them and the tape was broad — Russell 2000 +1.21% and NYSE Composite +0.92% both outran the S&P, and Transports finished second-best despite crude gaining nearly seven percent.
| Index | Fri Close | WoW Change | WoW % | Why It Moved (Week) |
|---|---|---|---|---|
| S&P 500 | 7,785.73 | +28.27 | +0.36% | A round-trip week. A record close of 7,799.19 Thursday as hike odds collapsed, then a fresh intraday record surrendered Friday on the retail sales and sentiment double miss. The net gain is a third consecutive weekly advance built on two sessions. |
| Dow Jones | 53,732.41 | -304.11 | -0.56% | The only major index red on the week, and constituent-driven: Cisco, Home Depot and Amazon are all Dow members and all landed among the five worst mega-cap weekly decliners. |
| DJ Transportation | 21,792.40 | +286.40 | +1.33% | Second-best index despite crude gaining nearly 7% on the week. Wednesday’s +1.44% on the in-line CPI and Thursday’s +1.50% to a fresh 10-session high were large enough to absorb Monday’s and Friday’s declines. |
| Nasdaq 100 | 30,046.14 | +323.84 | +1.09% | Memory and AI-hardware leadership did the lifting — SanDisk +35.4% and Micron +10.7% over the week — while Broadcom’s -8.1% and Applied Materials’ -5.9% capped how far it could run. |
| Russell 2000 | 3,069.96 | +36.78 | +1.21% | The best major index. Small caps held green on Tuesday and Friday when every large-cap benchmark fell, insulated from the AI-financing and platform-litigation questions weighing on mega-caps. |
| NYSE Composite | 24,821.68 | +226.44 | +0.92% | Outran both the Dow and the S&P, confirming the week’s advance was broader than the cap-weighted headline implies once the three Dow decliners are set aside. |
VOLATILITY & TREASURIES
The curve steepened 6.9 basis points to 51.9 as the 2-year fell and the 10-year rose — but the two halves happened on different days and for different reasons. Thursday’s soft PPI priced 2026 hike odds from roughly 55% to under 35% and took the 2-year down 5.0 bps; Friday’s retail sales and sentiment misses then lifted both ends, the 10-year by 5.1 bps. A bond market that sells duration on weak consumer data is pricing an inflation problem, and VIX at 14.25 shows nobody hedged it.
| Instrument | Fri Level | WoW Change | Why It Moved (Week) |
|---|---|---|---|
| VIX | 14.25 | -0.64 (-4.30%) | Collapsed 4.78% on Wednesday to 14.55 as an in-line CPI retired the hot-print tail risk traders had paid to hedge, and never rebuilt. Friday’s 14.25 is a market carrying almost no protection into the August 19 tariff deadline. |
| 10-Year Treasury Yield | 4.692% | +4.5 bps | Rose despite two disinflation prints, adding 5.1 bps on Friday alone against soft retail sales. The record $432 billion July deficit and negative net customs receipts supplied a supply-side reason to sell duration that the policy path does not explain. |
| 2-Year Treasury Yield | 4.173% | -2.4 bps | Fell 5.0 bps Thursday on the soft PPI as 2026 hike odds were priced out, then gave back 3.3 bps Friday when one-year inflation expectations rose to 4.3%. |
| US Dollar Index (DXY) | 99.64 | +0.03 (+0.03%) | Unchanged in net terms across five sessions. No safe-haven bid materialised through either the Hormuz escalation or the Canadian tariff standoff, which is itself the signal. |
COMMODITIES
Metals moved once and then stopped. Monday’s Hormuz escalation produced the entire week’s precious bid — silver +3.81%, gold +1.09% — and neither added anything across the four sessions that followed, including Thursday’s record equity close and Friday’s jump in one-year inflation expectations to 4.3%. Gold declining to bid an inflation-expectations un-anchoring is the week’s most telling non-event. Bitcoin was the only decliner here, down 3.14% while the Nasdaq 100 gained 1.09% — a clean decoupling from equity risk rather than a read on it.
| Asset | Fri Price | WoW Change | WoW % | Why It Moved (Week) |
|---|---|---|---|---|
| Gold | $4,430.90/oz | +$32.03 | +0.73% | A lukewarm week. Monday’s +1.09% on the Hormuz escalation was effectively the whole move; the metal sat out both Thursday’s record equity close and Friday’s inflation-expectations jump. |
| Silver | $64.840/oz | +$1.180 | +1.85% | Outpaced gold on Monday’s broad metals bid (+3.81%) and held the gain. The precious-versus-industrial split that governed the prior week did not repeat. |
| Copper | $6.6093/lb | +$0.0293 | +0.45% | Barely moved across five sessions. No industrial-demand signal in either direction, and no read-through at all from the week’s energy supply shock. |
| Platinum | $1,757.10/oz | +$3.00 | +0.17% | Effectively flat: Friday’s 1.44% gain did little more than recover Thursday’s decline. No independent catalyst all week. |
| Bitcoin | $62,933.00 | -$2,041.00 | -3.14% | Fell in four of five sessions and was the only asset in this table to finish red, decoupling from a Nasdaq 100 that gained 1.09% over the same stretch. |
ENERGY
Crude rose against a falling equity tape on three of five sessions, which makes this week’s energy move a cost shock rather than a demand signal. The arc had a clean break: five straight sessions of gains into Tuesday as Hormuz transits collapsed to six vessels, then Wednesday’s 17.4 million-barrel US crude build — the largest since January 2023 — snapping it, before the UAE’s piracy accusation rebuilt the premium on Friday. Brent outran WTI and Dutch TTF outran Henry Hub by eight points, locating the disruption offshore throughout.
| Asset | Fri Price | WoW Change | WoW % | Why It Moved (Week) |
|---|---|---|---|---|
| Crude Oil (WTI) | $82.41/bbl | +$5.26 | +6.82% | Five consecutive gains through Tuesday on Hormuz transits falling to six vessels a day, broken Wednesday by the largest US crude build since January 2023, then rebuilt Friday on the UAE’s piracy accusation. |
| Crude Oil (Brent) | $88.56/bbl | +$6.29 | +7.65% | Outran WTI as the disruption stayed international, widening the spread to $6.15 from $5.12. Brent absorbed a 2.23% Thursday drop on the IEA demand cut and still closed the week above $88. |
| Natural Gas (Henry Hub) | $2.716/MMBtu | +$0.046 | +1.72% | Weather and the Freeport LNG restart, not the chokepoint. Monday’s 4.36% jump on hotter two-week forecasts was the week’s move; the contract drifted through the four sessions after it. |
| Natural Gas (Dutch TTF) | $20.62/MMBtu | +$1.82 | +9.68% | Monday’s 10.82% spike on Hormuz-linked Qatari LNG delays and a European heat wave set the whole week. European gas is now hostage to the same chokepoint as crude, which is why it outran Henry Hub by eight points. |
S&P 500 SECTORS — WEEKLY ROTATION
Energy led at +5.56% and is green across every horizon out to twelve months (+41.14%) — regime leadership rather than a bounce, and broadly held: Chevron is the only Energy name among the week’s five biggest mega-cap gainers, so the barrel re-rated the sector, not a stock. Consumer Cyclical inverts both halves. At -1.65% it was the worst sector and is negative on 1-week, 3-month and YTD alike, with two of the five worst weekly decliners — Amazon -4.31%, Home Depot -4.71% — sitting inside it.
| Sector | 1-Week | 1-Month | 3-Month | 6-Month | YTD | 12-Month |
|---|---|---|---|---|---|---|
| Energy | +5.56% | +7.33% | +3.16% | +15.24% | +35.47% | +41.14% |
| Technology | +1.37% | +7.22% | +5.39% | +29.62% | +26.34% | +33.20% |
| Industrials | +0.92% | +3.49% | +1.86% | +4.36% | +17.23% | +20.06% |
| Financial | +0.73% | +2.34% | +12.62% | +11.39% | +9.06% | +15.52% |
| Consumer Defensive | +0.47% | -0.25% | -1.84% | -5.44% | +8.84% | +4.84% |
| Utilities | +0.45% | -3.39% | -3.54% | -4.36% | +2.70% | +3.81% |
| Healthcare | +0.33% | +2.38% | +11.94% | +6.39% | +7.75% | +24.90% |
| Real Estate | +0.30% | -1.44% | +3.55% | +5.44% | +11.33% | +9.04% |
| Communication Services | -0.82% | -3.05% | -8.90% | +2.87% | -0.53% | +11.65% |
| Basic Materials | -1.09% | +8.71% | -3.32% | -1.89% | +15.30% | +32.04% |
| Consumer Cyclical | -1.65% | +0.51% | -1.82% | +1.20% | -2.39% | +1.48% |
TOP WEEKLY MOVERS:
Memory is the whole leaderboard. SanDisk +35.38% and Micron +10.72% top the gainers on the same NAND and DRAM tightness that Cisco named as a 210 basis-point gross-margin headwind — the identical scarcity priced as an asset on one side of the table and a liability on the other. The underlying screener puts SanDisk at +591% YTD and Micron at +200%, so this is momentum extension, not a counter-trend bounce. Note what the sector table above cannot show: all five decliners are Technology or Consumer Cyclical names, yet Technology still closed the week green. Dispersion, not direction.
TOP 5 WEEKLY GAINERS
| Ticker | Week | YTD | Year | Why It Moved |
|---|---|---|---|---|
| SNDK | +35.38% | +591.34% | +3415.66% | Two catalysts in three sessions. SanDisk and Kioxia unveiled ninth-generation 2Tb QLC 3D NAND on Wednesday, then the company’s Investor Day on Thursday laid out mid-to-high-teens annual revenue growth for 2028-2030 and non-GAAP gross margins near 80%, built on multi-year hyperscaler agreements. The stock rose 13.67% Thursday and a further 7.39% Friday; RBC Capital lifted its target to $1,600 from $1,300. |
| MU | +10.72% | +200.44% | +675.53% | Rode the same memory-scarcity trade as SanDisk, gaining 4.92% Wednesday and 4.23% Thursday, with a new $250 million Micron Ventures Paradigm Fund pushing the company further into the AI stack. Citi trimmed its target to $1,150 on valuation while keeping a Buy, against a Street mean near $1,568. |
| DELL | +8.16% | +289.90% | +253.46% | Almost the entire week’s gain landed on Wednesday, when Dell rose 9.87% as Super Micro guided fiscal 2027 revenue to $65-72 billion against roughly $52.5 billion of consensus, and the AI-server read-through pulled the whole hardware complex up. Goldman Sachs named Dell among its top hardware picks; Morgan Stanley trimmed its target to $430. |
| GEV | +7.36% | +62.68% | +70.05% | The power-constraint trade. GE Vernova gained through the week on rating upgrades citing consistent guidance raises and record equipment-and-services backlog, as AI data-centre electricity demand kept re-rating the sector — reinforced by the week’s data-centre lease and turbine-order announcements. |
| CVX | +7.20% | +31.22% | +28.90% | A pure barrel trade. Chevron rose 4.48% on Monday alone as crude jumped more than 5% on Iran hardening its Hormuz terms, and held the gain as the supply premium was rebuilt Friday. TD Cowen raised its target to $205 while keeping a Hold; the $1.78 quarterly dividend goes ex on August 19. |
TOP 5 WEEKLY DECLINERS
| Ticker | Week | YTD | Year | Why It Moved |
|---|---|---|---|---|
| AVGO | -8.13% | +13.55% | +26.27% | Two unrelated problems landing on Friday cost 5.94% in a session. BofA estimated Broadcom’s AI chip-financing vehicle could carry up to $370 billion of senior debt by mid-2029, a structure Broadcom partially backstops; separately, researchers confirmed the VMware vCenter flaw disclosed on July 29 is being actively exploited across 361 IP addresses in 47 countries. Q3 results are due in early September. |
| CSCO | -8.03% | +44.98% | +61.15% | Beat on every reported line and fell 8.40% anyway. Fiscal Q4 revenue rose 18% to a record $17.3 billion with $4 billion of hyperscaler AI orders, but gross margin fell 210 basis points on memory costs and management guided fiscal 2027 AI infrastructure revenue to $7.5 billion against $9.3 billion of fiscal 2026 orders. Truist and Rosenblatt both raised targets into the selloff. |
| AMAT | -5.93% | +97.35% | +169.43% | Sold off twice on a record quarter. Fiscal Q3 revenue of $9.12 billion rose 25% and Q4 guidance beat consensus by roughly $710 million, but China fell to about 28% of sales from 35% a year earlier and the stock had run more than 140% into the print. Erste Group cut to Hold; Morgan Stanley lowered its target to $646. |
| HD | -4.71% | -1.52% | -15.35% | CEO Ted Decker began an open-ended medical leave on Wednesday, six days before earnings, and the stock fell 3.12% on the disclosure. Friday’s retail sales miss compounded it. Note the disagreement: Bank of America and TD Cowen both raised targets early in the week, to $412 and $410, before the leave was announced. |
| AMZN | -4.31% | +13.79% | +13.71% | No single catalyst — a give-back after hitting an all-time high above $287 earlier in the month. Amazon was sold on Wednesday (-1.83%) as part of the rotation funding AI-hardware names, then tracked the consumer complex lower into Friday’s retail sales miss. |
— Institutional-grade intelligence for serious investors. Apply for membership at join.recessionalert.comC. WEEK’S TOP STORIES -> TOP
Four threads, not nine stories. The AI capital cycle runs through #1, #4 and #9, and is the week’s genuinely new architecture: financing, not demand, is now where the differentiation happens. The chokepoint thread — #2 and #6 — is unusual in carrying its own contradiction, a supply panic and a record inventory build inside the same five sessions. Policy runs through #3 and #5, both approaching hard dates. And #7 and #8 describe demand-side erosion arriving from opposite directions. The threads converge on one question: who pays for the buildout.
UNCERTAIN
1. AI Capital Expenditure Moved Onto the Credit Market’s Balance Sheet This Week — and the Market Began Charging Different Prices for Different Structures
The core facts:The week opened Monday with Nvidia signing memoranda of understanding with Apollo, BlackRock, Blackstone, Brookfield, Goldman Sachs and KKR to mobilise more than $500 billion of third-party capital for AI compute infrastructure; Nvidia fell 2.87% on its own announcement. Intel announced a $15 billion equity offering the same session, upsized it to $20 billion on Tuesday and priced 210,526,315 shares at $95 against roughly $100 billion of institutional demand. By Friday the programme had a syndication desk: Goldman Sachs began approaching insurers, asset managers, banks and private-credit firms to place the paper, contributing junior capital through its asset-management arm. The same session produced the two prices the market has now set. AMD priced a $4.75 billion four-tranche investment-grade bond — its largest ever — roughly 25 basis points inside initial talk, with the 2036 maturity clearing near 90 basis points over Treasuries, and rose 6.50%. Broadcom fell 5.94% after a BofA analyst estimated its AI chip-financing vehicle could carry up to $370 billion of senior debt by mid-2029, including $150 billion of issuance in 2027, against lease obligations Broadcom partially backstops.
Why it matters:Until this week the AI buildout was an equity story about whether demand was real. It is now a credit story about whether GPUs and the buildings around them are financeable collateral, and that question is being answered by insurance companies and private-credit funds rather than by equity investors. The week’s decisive evidence is that the market did not reject AI capex — it discriminated within it, and did so on structure rather than on business quality. AMD and Broadcom sell into the same end market; the one that issued disclosed on-balance-sheet debt with a named issuer gained 6.42% on the week while the one carrying an off-balance-sheet backstop that a sell-side analyst had to estimate lost 8.13%. That 14.5-point spread is the price of disclosure, and it will apply to every AI-infrastructure name that comes to market from here. The structural consequence is that AI capital expenditure is becoming a credit-spread input rather than an idiosyncratic equity exposure. Once this paper reaches public markets, a repricing transmits to every name in the complex simultaneously — a channel that did not exist twelve months ago. Two constraints belong on the reading. Intel’s book was five times covered at a 2.6% discount, which is an emphatic institutional vote rather than a distressed clearing, and the demand side kept confirming itself all week: $15.6 billion of 15- and 20-year data-centre leases were signed on Tuesday alone, and IREN delivered Microsoft the first 50MW under a five-year, $9.7 billion contract on Thursday. Financing difficulty is not the same as demand weakness, and this week supplied fresh evidence of both.
What to watch:The terms on the first Goldman tranche to clear — specifically the spread over Treasuries and the assumed residual value on the compute assets. Those two numbers disclose what the credit market actually believes about GPU depreciation, which no equity multiple currently reveals. Watch also whether Anthropic’s reported October listing, which investors are modelling at $2 trillion or more without company guidance, prices anywhere near that figure; a large shortfall would be read as a verdict on the whole complex rather than on one issuer.
BEARISH
2. Hormuz Goes From Rhetoric to Measurement to State-Level Accusation — Six Vessels a Day, and Brent Closes the Week +7.65%
The core facts:The week escalated in three distinct steps. Monday, Iran attached an explicit precondition to reopening the Strait — a Foreign Ministry spokesman said the conditions for reopening “do not exist” while the US naval blockade continues, and Foreign Minister Abbas Araghchi confirmed no direct talks with Washington; WTI rose 5.23% and Brent 5.10%. The same weekend the Houthis struck Aramco’s Jizan refinery for the second time in two weeks, a facility already offline since July 27. Tuesday supplied the measurement: Kpler recorded six transits on Monday against a ten-day average near eleven and a pre-war run rate near 140, with two of the four inbound vessels empty. Friday brought the state-level escalation — the UAE Foreign Ministry publicly attributed drone attacks on two ADNOC tankers to Iran’s Revolutionary Guard Corps, calling them “acts of piracy”; ADNOC says fifteen of its vessels have now been hit since February. Saudi Aramco began handling September Asian allocations cargo by cargo rather than through its standing monthly formula, and set its September Arab Light price to Asia at $2.00 below the Oman/Dubai average, the deepest discount since June 2020.
Why it matters:The week converted the Hormuz story from a negotiation the market could handicap into a physical constraint it has to price. A vessel count is not a statement, and six against a pre-war 140 describes a waterway that has stopped functioning rather than one operating at reduced volume. The Aramco detail is the sharper development and the one most likely to be underweighted: when the world’s swing producer abandons the allocation formula that has anchored Asian crude pricing for decades because buyers cannot secure hulls, the binding constraint has moved from production to shipping — and freight and war-risk premia, not the barrel, become the marginal cost of energy. That is a bearish price signal and a bullish supply-risk signal simultaneously, which is why Saudi differentials collapsed to a six-year low in the same week Brent gained 7.65%. The market receipts are unusually clean. Brent +7.65% and WTI +6.82% on the week, with the spread widening to $6.15 from $5.12 as the disruption stayed international (see Energy table in Section B); Energy the top sector at +5.56% and green across every horizon to twelve months (see sector rotation table); Chevron +7.20% and the only Energy name among the week’s five biggest mega-cap gainers (see weekly movers table). The transmission to US portfolios is an energy-cost floor beneath every inflation print, which is exactly the mechanism the consumer surveys registered on Friday when one-year inflation expectations rose to 4.3%. A second chokepoint is now running in parallel: Russia rejected a Black Sea shipping truce and ruled out reviving the grain deal, with Ukrainian grain exports down 76% year-on-year in August at harvest peak. Two supply-side inflation impulses at once is the configuration that makes a central bank reluctant to look through a soft demand print.
What to watch:Aramco’s October official selling price, due in early September — a further widening beyond the $2.00 discount confirms delivery risk is deepening rather than stabilising. Watch for an Iranian response to the UAE’s piracy accusation, and for whether ADNOC suspends transits; a Gulf state drawn into direct confrontation over the blockade would be the first genuine escalation beyond attritional attacks.
UNCERTAIN
3. A Sitting Fed President Escalated to Demanding an Immediate Hike in the Same Week the Market Priced One Out — and by Friday the Bond Market Sided With Her
The core facts:Cleveland Fed President Beth Hammack, who dissented at the July 28-29 FOMC in favour of a quarter-point hike, escalated her position twice this week. On Monday she told Yahoo Finance that “one 25 basis point move probably doesn’t do a whole lot for the economy” and that it would take “some number” of moves, adding that the current 3.50%-3.75% range is not “meaningfully restricting” the economy. On Thursday, speaking in Dayton hours after the soft July PPI print, she called for the Fed to raise rates now and said she lacks confidence the cooler readings will persist. Markets moved the opposite way across the same days: implied odds of a 2026 hike fell from roughly 55% to under 35%, the 2-year yield dropped 5.0 basis points on Thursday to 4.149%, and the S&P 500 closed at a record 7,799.19. Richmond’s Barkin, speaking the same day, described the economy as a set of unresolved “mysteries.” Then Friday inverted the picture: on a retail sales and consumer sentiment double miss, the 10-year rose 5.1 basis points and the 2-year 3.3, while one-year inflation expectations climbed to 4.3%.
Why it matters:A hawk who does not soften on good news is different information from a hawk who has not been tested. Hammack was handed a downside inflation surprise and escalated rather than retreated, which converts her position from commentary into a standing constraint on the September meeting. The market spent Wednesday and Thursday concluding the opposite, and then, on Friday, quietly agreed with her: a genuine growth scare produces a bid for duration, and instead both ends of the curve sold off on weak consumer data. That is the market reading soft activity as an inflation problem, and it removes the cushion equity investors normally rely on when data disappoints — weak growth would ordinarily lower the discount rate, and here it raised it. The weekly receipts show a curve that steepened 6.9 basis points to 51.9 while VIX finished at 14.25 (see Vol & Treasuries table in Section B), which is a market that repriced the policy path and bought no protection against being wrong about it. Polymarket ratified the dovish half only partially: 2026 hike odds fell 6 points to 49% while at-least-one-cut odds rose just 1.2 points to 14.7% (see Polymarket table in Section D). The restraint is that Hammack is one voice on a committee that voted to hold, and the absence of forward guidance from Chair Warsh at two consecutive meetings means individual district presidents are filling a vacuum rather than signalling a consensus. One dissenter is noise; the question the week leaves open is whether a second joins her.
What to watch:Wednesday’s FOMC minutes are the week’s highest-leverage scheduled release — they will show whether Hammack’s July dissent had sympathisers on the committee or was genuinely isolated. Watch whether the 10-year holds above 4.70%; a yield that keeps climbing on soft activity data confirms the inflation-fear reading and puts September 15-16 back in play as a live hike meeting. The Jackson Hole symposium in late August is the next platform on which the Board can answer or ignore her.
UNCERTAIN
4. Memory Scarcity Split the AI Trade in Half — SanDisk +35% and Broadcom -8% Inside a Technology Sector That Finished the Week Up 1.37%
The core facts:The same input scarcity was marked as an asset on one side of the tape and a liability on the other, in the same sessions. SanDisk and Kioxia unveiled ninth-generation 2Tb QLC 3D NAND on Wednesday — a 4.8 Gb/s interface, 33% faster than the eighth generation, the industry’s highest QLC bit density — then SanDisk’s Thursday Investor Day guided to mid-to-high-teens annual revenue growth for 2028-2030 on roughly 80% non-GAAP gross margins, backed by multi-year hyperscaler agreements. The stock rose 13.67% Thursday and 7.39% Friday, closing the week +35.38%; Micron gained 10.72%. On the other side, Cisco’s fiscal Q4, released Wednesday after the close, attributed a 210 basis-point year-over-year gross-margin decline to a heavier hardware mix and higher memory costs, and the shares fell 8.40% on Thursday. Applied Materials beat on revenue and adjusted EPS and guided fiscal Q4 roughly $710 million above consensus, and fell 5.12% Friday as China dropped to about 28% of sales from 35% a year earlier. Earlier in the week the split ran along a different seam: Wednesday’s session sold Microsoft (-2.26%), Amazon (-1.83%) and Palantir (-2.23%) to buy Dell (+9.87%), Arista (+6.39%), Oracle (+5.36%) and Micron (+4.92%).
Why it matters:For most of this cycle the AI trade moved as a single instrument. This week it stopped, and the dividing line was specific enough to act on: memory is no longer a semiconductor sub-sector call, it is a margin variable running through every systems vendor that buys NAND and DRAM as an input. Exposure to one side is now an implicit short of the other, and the week priced that relationship explicitly rather than by inference. The weekly evidence is unusually stark. Technology closed +1.37% while spanning SanDisk +35.38% and Broadcom -8.13% — a 43-point range inside one sector line (see sector rotation and weekly movers tables in Section B), which means the sector average this week carried close to zero information. Three of the five worst weekly decliners are Technology names and two of the five best gainers are memory names, in the same sector, in the same week. What keeps this uncertain is that hardware revenue is somebody else’s capital expenditure, and Wednesday’s rotation funded the suppliers by selling the customers — Microsoft and Amazon are the hyperscalers whose spending decisions constitute the revenue being bid up. That trade is internally inconsistent if held long enough. Cisco supplied the first hard number pointing that way, guiding fiscal 2027 AI infrastructure revenue to $7.5 billion against $9.3 billion of fiscal 2026 orders — a plateau, not a compounding, from a major supplier’s own mouth.
What to watch:Whether the memory-cost language that cost Cisco 210 basis points appears in other systems vendors’ gross-margin guidance — that is how the input squeeze propagates from a sector call into an earnings problem. Watch Applied Materials’ China mix in the fiscal Q4 report against this quarter’s 28%: stabilisation means the export-control hit has been absorbed, a further decline means the revenue base is still shrinking underneath the AI growth.
BEARISH
5. Canada Rejected a Sweetened Offer and Washington Demanded Unilateral Disarmament — the 50% Section 338 Cliff Is Now Four Days Away
The core facts:Three Section 338 proclamations signed July 20 impose an additional 50% tariff on roughly $20 billion of Canadian imports — motor vehicles, alcohol, dairy and consumer goods from wine to textiles — effective 12:01 AM ET on Wednesday, August 19, and applying regardless of USMCA origin. Energy, potash, fish, critical minerals and Section 232 goods are carved out. The week ran the wrong way. On Wednesday Ottawa rejected a newly sweetened US proposal, and it emerged that chief negotiator Janice Charette had told USTR Jamieson Greer the August 19 date would be a “cliff” risking the collapse of talks, because Ottawa could not restrain provincial premiers or public reaction. Negotiators met again Thursday with no established outcome. On Friday Greer said publicly in Des Moines that Canada must lift its retaliatory measures to avoid the new duties, comparing Canadian conduct to “the kind of things that China would do.” The sticking point is circular: Canada cannot push the provinces to return US alcohol to shelves without comprehensive steel and aluminium relief, which Washington has withheld. Separately, the administration signed 100% drone tariffs on Thursday effective September 3 — the second sectoral proclamation in nine days — and the Court of International Trade upheld the end of the $800 de minimis exemption.
Why it matters:The market has spent this year treating tariff deadlines as instruments that move, and that assumption has generally paid. This week supplied the first concrete evidence that this date may not. A rejection of an improved offer establishes that the gap is structural rather than a matter of splitting a difference, and Charette’s warning is a constraint argument rather than a threat — a counterpart can call a bluff but cannot legislate Canadian provincial politics. Greer’s Friday demand that Canada disarm first, four days out, is not the posture of a side expecting to sign. The design of Section 338 is what makes the size misleading. Twenty billion dollars is small against bilateral trade, but overriding USMCA origin rules strikes integrated North American automotive supply chains directly: cross-border content crosses multiple times before final assembly, so a 50% duty compounds through each crossing rather than applying once. It lands on the market’s weakest ground — Consumer Cyclical was the worst sector on the week at -1.65% and is negative year to date at -2.39% (see sector rotation table in Section B). The cadence around it matters as much as the event: two sectoral proclamations in nine days, both targeting China-dominated inputs, both tiered with allied carve-outs, describes a policy machine running on a schedule rather than a series of decisions. The reason to stay calm is that negotiators talk right up to deadlines precisely because concessions get cheap near them, a steel and aluminium tariff-quota is a recognised landing zone both sides have used before, and the equity market’s own verdict this week was to close at records four days out.
What to watch:Any Canadian move to suspend its counter-tariffs before Wednesday — that is the single condition Greer named, and its absence by Monday’s close makes the cliff the base case. Watch auto suppliers and dealers, where the pass-through is most direct, and watch whether a third sectoral proclamation lands before month-end, which would confirm the weekly cadence as deliberate policy.
UNCERTAIN
6. The Largest US Crude Build Since January 2023 Landed in the Same Week as the Tightest IEA Balance Since 2021 — the Supply Panic Has a Demand Problem
The core facts:The counter-evidence accumulated from three independent directions. Tuesday after the close the American Petroleum Institute reported a 9.072 million barrel US crude build against consensus for a 0.50 million draw. Wednesday morning the EIA nearly doubled it: commercial crude rose 17.422 million barrels in the week ended August 7 to 424.4 million, versus a 1.4 million draw expected — a roughly 18.8 million barrel miss and the largest weekly build since January 2023. It was the second consecutive weekly accumulation. The Strategic Petroleum Reserve fell a further 6.1 million barrels to 298.7 million, dropping below 300 million. The same morning the International Energy Agency moved the opposite way, raising its third-quarter global deficit to 1.8 million barrels a day from roughly 800,000, the deepest since Q4 2021, and cutting 2026 demand a further 510,000 barrels a day to a 1.6 million decline. OPEC, publishing the same day, cut its own 2026 demand growth forecast for a fourth consecutive month — to 580,000 barrels a day from 780,000 in mid-July and 1.0 million in June — leaving a 2.2 million barrel-a-day gap between the two forecasters on the same calendar year. Crude broke a five-session run of gains: WTI -0.70%, Brent -0.60%.
Why it matters:Two official agencies published shocks of opposite sign within hours, and the resolution is geographic rather than contradictory: barrels are accumulating in the country furthest from the disrupted chokepoints while the deficit concentrates where the chokepoints are. The United States is becoming an inventory island — comfortable in the short run, and a poor guide to the global price, which is why an 18.8 million barrel miss moved WTI only 0.70%. The more useful signal is what the build points at. With the IEA reporting global supply down 4.3 million barrels a day for the year, an accumulation of this size in the world’s largest consumer is a demand statement, not a supply one, and OPEC’s trajectory corroborates it: four consecutive downgrades running 1.0, 0.78 and 0.58 million is a forecaster converging on a worse answer one increment at a time, while the group still restores 188,000 barrels a day from September 1. A producer cutting its demand forecast monthly while increasing supply is running a strategy its own analysis undermines. The practical consequence for positioning is that consensus energy forecasts currently carry far wider error bars than their point estimates suggest — any oil view is implicitly a bet on which institution is right. The SPR line deserves more weight than it will get: drawn below 300 million during a chokepoint closure, the instrument that exists precisely for a chokepoint closure is being spent into the tightest quarter the IEA has forecast in five years.
What to watch:Wednesday’s EIA report — a third consecutive build converts one outsized print into a demand signal, while a revision away from the 17.4 million figure restores the supply narrative. Watch the September 6 OPEC+ ministerial for whether the group pauses the supply restoration, which is the decision that would show it believes its own demand numbers.
BEARISH
7. Consumer Softness Finally Reached the Mega-Caps — Amazon and Home Depot Both Landed Among the Week’s Five Worst Decliners, and Home Depot Lost Its CEO Six Days Before Earnings
The core facts:The week began with the evidence confined to small caps. Tuesday brought a coordinated round of sell-side cuts — Barclays downgraded Under Armour and Gap and held Abercrombie at Equal Weight, three consumer decisions from one house in a session — alongside independent full-year guidance reductions from On Holding (-18%), Purple Innovation (-23%, explicitly citing industry softness) and OppFi (-18%), none above $25 billion. Wednesday it crossed the threshold: Home Depot disclosed in an 8-K that chair and chief executive Ted Decker, 63, had begun a temporary medical leave expected to last several months, six days before fiscal Q2 results. Rather than name a single interim chief, the board split his duties three ways — Ann-Marie Campbell over operations, CFO Richard McPhail as interim principal executive officer, lead director Greg Brenneman as board chair. The stock fell 3.12%. By Friday, July retail sales had fallen 0.6% against a 0.1% expected gain, the steepest drop in 14 months, with the GDP-relevant control group down 0.4%. Home Depot closed the week -4.71% and Amazon -4.31%, both among the five worst mega-cap weekly decliners.
Why it matters:The escalation across the five days is the story: a signal that began in sub-$25 billion apparel and furnishings names on Tuesday was confirmed by a mega-cap governance event on Wednesday and by the official data on Friday. That sequence is much harder to dismiss as idiosyncratic than any single leg of it. The market receipts are unambiguous — Consumer Cyclical was the week’s worst sector at -1.65% and is negative on 1-week, 3-month and YTD horizons alike, and the two mega-caps driving it are the two that sit in the weekly decliners table (see sector rotation and weekly movers tables in Section B). Home Depot’s leave matters beyond the company because of what it does to the calendar. Tuesday’s print is the single clearest mega-cap read on discretionary and big-ticket household spending, and it will now be delivered by an interim structure. The reported quarter is the CFO’s to present and McPhail has been in the seat for years; forward guidance is a different exercise, because it requires an executive willing to attach personal authority to a forecast, and interim leadership reliably produces more conservative numbers. If second-half guidance comes in soft, the market faces a genuine attribution problem — weak demand or cautious stewardship — and will most likely price the worse of the two. Worth holding in proportion: Bank of America and TD Cowen both raised Home Depot targets early in the week, to $412 and $410, and On Holding still grew revenue 21.6% while missing its own aggressive projection. Missing an ambitious forecast is not demand collapsing.
What to watch:Home Depot on Tuesday, and specifically whether full-year guidance is reaffirmed or trimmed — a trim under interim leadership is the ambiguous outcome that would weigh on the entire discretionary complex. Watch for any update on the expected duration of Decker’s leave, since “several months” spans two more earnings cycles.
BEARISH
8. Three Platforms, Three Jurisdictions, One Week — and a Ninth Circuit Holding That Strips Section 230 of Its Pre-Discovery Shield
The core facts:Tuesday, the Alliance de la Presse d’Information Générale — roughly 300 French daily newspapers — filed a complaint with France’s Autorité de la concurrence against Google’s AI Overviews, claiming referral traffic to member sites has already fallen 33% to 38% and that the practice contradicts commitments Google made in 2022 under the neighbouring-rights framework. Alphabet’s two classes were among the day’s largest decliners, GOOGL -3.84% and GOOG -3.61%. Wednesday, jury selection began in Oakland in the suit brought by 29 state attorneys general against Meta over children’s data and addictive design, with opening arguments set for August 18; the trial proceeded because the Ninth Circuit, ruling August 10, denied Meta’s emergency motion to delay. In the same decision the court declined to dismiss more than 3,000 federal design-liability suits against Meta, Google, TikTok and Snap, holding that Section 230 provides a defence to liability rather than immunity from suit. Meta fell 3.38%. Friday brought the Epic remedy phase: Judge Donato ordered Google to change Play Store search within a week so that queries for rival stores resolve directly, and Apple filed a proposed link-out commission schedule of 15% standard, 10% for subscriptions and certain programmes, 5% for small business.
Why it matters:Three separate proceedings against three companies in three jurisdictions inside five sessions is a pattern, and the Section 230 holding is the piece that makes it structural rather than incidental. By characterising the statute as a defence rather than an immunity, the Ninth Circuit removed the mechanism platform defendants have used to dispose of design-liability claims before discovery. More than 3,000 cases now proceed past a gate that used to stop them, and they run against four companies rather than one. That is a change in the cost structure of operating a consumer platform, not a single adverse outcome. The sector data says the market is treating it that way: Communication Services is down 8.90% over three months against a Technology sector up 5.39%, and finished this week red at -0.82% (see sector rotation table in Section B). A sector losing nearly nine points over a quarter while its nearest peer gains five is being re-rated, not rotated out of, and the legal environment is the common factor. The Alphabet complaint carries the most transferable content: the 33-38% traffic-decline figure, if it is ever established as fact in one proceeding, becomes evidence in every other, and it describes the mechanism by which generative search erodes the open web that the index depends on. The counterweight is real. Complaints initiate investigations, not remedies; jury selection is not a verdict, and multi-state actions settle at a high base rate. The Epic developments actually cut the other way — both outcomes are behavioural rather than structural, and Apple’s proposed 15% preserves roughly half the standard take rate on transactions bears had assumed would leave at zero.
What to watch:Opening arguments in Oakland on Tuesday and the first tranche of internal documents entered into the record — that evidence, not the eventual verdict, is what typically moves the stock during a trial of this kind. Watch whether the court accepts Apple’s 15% link-out rate or reduces it, since that single number sets the ceiling on link-out economics for the entire mobile ecosystem.
BULLISH
9. Two Very Different Kinds of Capital Took the Other Side of the AI-Disruption Discount on the Same Day — Silver Lake at Workday, Pershing Square Across Six Names
The core facts:Both disclosures landed Thursday. Reuters reported that Silver Lake has held discussions in recent months about taking Workday private, in what would rank among the largest software buyouts ever attempted; Workday was valued near $43 billion before the report and closed at $206.45, up roughly 18% after rising as much as 25% intraday and triggering volatility halts three times, valuing it near $51 billion. Silver Lake previously partnered with Saudi Arabia’s Public Investment Fund and Affinity Partners on the roughly $55 billion Electronic Arts take-private last year. Separately, Pershing Square’s Q2 report disclosed six new positions — Netflix, Visa, Mastercard, S&P Global, Intercontinental Exchange and Alcon — its largest overhaul in years. The Netflix stake ran to 3.15 million shares at June 30, roughly 4.9% of the portfolio, acquired after the stock fell about 50% from its June 2025 high and de-rated from 40 times forward earnings to 21. Alcon and ICE were added after June 30. Netflix closed Thursday +5.43%.
Why it matters:The coincidence is the content. Two allocators with entirely different mandates, time horizons and cost of capital independently concluded on the same day that the market’s AI-disruption discount has overshot, and both expressed it by buying toll-like franchises rather than by shorting AI. Workday had been de-rated on the thesis that seat-based enterprise software does not survive agents that reduce the headcount those seats are sold against; four of Pershing’s six — Visa, Mastercard, S&P Global and ICE — are financial-infrastructure and exchange businesses marked down on the same class of fear. Two independent votes are a materially stronger signal than either position alone. The Workday development answers a second question that has been open since rates repriced: the financing market will underwrite a technology leveraged buyout above $40 billion. That has a direct read-across to every large-cap application-software name trading at a comparable discount, and it arrived in a week when the credit market was simultaneously proving willing to fund AI hardware on-balance-sheet at 90 basis points over Treasuries. Capital is available at scale for both sides of the AI trade; what it is discriminating on is structure and disclosure, not narrative. Two constraints. Reuters characterised the Workday discussions as occurring “in recent months,” which is materially weaker than a deal in hand, and no price has been confirmed. Pershing’s Netflix position is also a re-entry — the 2022 stake committed more than $1 billion and was exited at a loss above $400 million — so conviction here is not the same as a track record.
What to watch:Whether a confirmed price or a competing bidder emerges for Workday, and whether application-software peers sustain a re-rating rather than fading the single-name event — the latter is what would confirm the market is revising the AI-disruption discount itself. Watch third-quarter filings from other large concentrated funds for the same rotation; if it is crowding, it shows first in payment networks and exchange operators.
— Separating signal from noise since 2007. Apply for membership at join.recessionalert.comD. WEEK IN THE ECONOMY -> TOP
The week’s tension is a policy-vs-data divergence, and it sharpened rather than resolved. Every hard print argued one way — core CPI at 2.5% year-on-year, the slowest since March 2021; PPI flat with the annual rate down to 4.7%; retail sales -0.6%, the steepest fall in 14 months; sentiment at 51.0 — while Cleveland’s Hammack, speaking hours after the soft PPI, demanded an immediate hike and said one would not be enough. Underneath sits a stagflation pulse the disinflation headlines obscure: Atlanta Fed GDPNow fell from 5.8% to 4.3% in eight days while one-year inflation expectations rose to 4.3%. Markets took the dovish side and then reversed — 2026 hike odds fell to 49% on Polymarket, yet Friday’s soft consumer data lifted the 10-year 5.1 basis points rather than bidding duration. Wednesday’s FOMC minutes will show whether Hammack’s July dissent had company or was genuinely isolated.
POLYMARKET ODDS — WEEK-ON-WEEK SHIFT:
| Market | Last Friday | This Friday | Δ |
|---|---|---|---|
| US Recession by end-2026 | 8.0% | 8.0% | 0.0 pp |
| Fed rate hike in 2026 | 55.0% | 49.0% | -6.0 pp |
| Fed rate cuts ≥1 in 2026 | 13.5% | 14.7% | +1.2 pp |
BEARISH
1. The Consumer Broke on Friday — Retail Sales -0.6% and Sentiment at 51.0, With Inflation Expectations Rising Into It (Census Bureau / University of Michigan, Fri Aug 14)
What they’re saying:Retail and food services sales fell 0.6% in July to $763.6 billion against roughly 0.1% expected — the largest monthly decline in 14 months and the first outright drop since last October. The GDP-relevant control group fell 0.4% versus a 0.3% expected gain, and sales ex-autos fell 0.3% against a 0.2% expected rise; year-on-year growth slowed to 5% from June’s 6.7%. Ninety minutes later, preliminary August UMich sentiment printed 51.0 against 54.5 consensus, down roughly 8% from July’s final 55.2, with Current Conditions at 51.8 from 54.8 and Expectations at 50.6 from 55.4. One-year inflation expectations rose to 4.3% from 4.2%; five-year held at 3.3%.
The context:Two independent measures of the same household, missing in the same direction on the same morning, is much harder to write off than either alone — and the sentiment decline was broad-based across demographics, sharpest among lower-income and non-college households. The market reaction is what makes this the week’s most consequential macro event rather than simply its weakest print. Soft consumer data should bid duration; instead the 10-year rose 5.1 basis points and the 2-year 3.3 (see Vol & Treasuries table in Section B), because the survey’s own internals gave investors an inflation reason to sell. CME odds of a September hike fell to roughly 30.6% from 33.9% the prior day, but the curve steepened rather than rallying. The equity expression was equally specific: the S&P surrendered a fresh intraday record to close -0.17%, and Consumer Cyclical finished the week the worst sector at -1.65% with Amazon and Home Depot among the five worst mega-cap decliners (see weekly movers table in Section B).
What to watch:The final August UMich reading on August 28 confirms whether the preliminary miss holds. August retail sales, due mid-September, is the test of persistence — and Home Depot on Tuesday is the mega-cap read that arrives first.
BULLISH
2. Back-to-Back Disinflation: Core CPI at Its Slowest Since March 2021, Then PPI Flat Against a 0.2% Forecast (BLS, Wed Aug 12 & Thu Aug 13)
What they’re saying:July CPI landed exactly on consensus across all four measures: headline +0.1% month-on-month and 3.4% year-on-year, core +0.2% and 2.5% — the slowest annual core pace since March 2021, down from 2.6% in June. Every major component matched the Dow Jones/FactSet consensus. A day later, headline producer prices were unchanged against a 0.2% forecast, pulling the annual rate to 4.7% from 5.5% in June; core PPI rose 0.2% against 0.3% expected, while the ex-food/energy/trade measure ticked up 0.4%. On the PPI print the 2-year fell more than 5 bps to 4.145% and the 30-year 3 bps to 5.213%.
The context:Two consecutive months of cooling consumer and wholesale inflation is the strongest disinflation evidence of the quarter, and the market treated it as a tail-risk retirement rather than a regime change — VIX collapsed 4.78% on CPI day to 14.55 while the 10-year actually rose 0.8 bps. That asymmetry is the tell: an in-line print contains no new information by construction, so what moved was the hedge, not the view. By Thursday the implied probability of a 2026 hike had fallen from roughly 55% to under 35% and the S&P closed at a record 7,799.19. The caveat the week supplied itself is that both prints measure July, and July is already overtaken — the EIA lifted its 2026 diesel forecast 8.5% and gasoline 5.9% on Tuesday, Brent gained 7.65% over the five sessions, and Friday’s survey showed households raising their own inflation expectations. Cooling prints describing a period that has been superseded are not the reassurance the headline suggests.
What to watch:The August CPI and PPI prints in mid-September, and specifically the motor-fuel line — that is where the Hormuz premium first becomes a consumer price rather than a commodity one.
BEARISH
3. A Third of Q3 Growth Evaporated in Eight Days — GDPNow Cut to 4.3% From 5.8% (Federal Reserve Bank of Atlanta, Fri Aug 14)
What they’re saying:The Atlanta Fed cut its Q3 2026 GDP growth estimate to 4.3%, down from 5.8% eight days earlier and from a 6.2% peak on August 3. The revision was driven by the nowcast for real personal consumption expenditures falling from 4.1% to 2.5%, and real gross private domestic investment easing from 17.9% to 15.2%. The cut followed the same morning’s retail sales release directly.
The context:Last Friday the model was tracking 5.8% and the widest growth-versus-hiring gap of the cycle; this Friday it is tracking 4.3% and the gap has closed from the growth side rather than the hiring side. The consumption component is where the entire revision sits, which makes this the cleanest confirmation available that the retail sales miss is a genuine spending signal rather than a seasonal artefact — GDPNow reads hard spending and investment data, not surveys. Note that 4.3% remains a strong absolute number, and the model is volatile by construction this early in a quarter. The useful content is the direction and the speed: losing 1.9 points of tracked growth in eleven days is the kind of move that normally precedes a shift in Fed tone, and it arrived in the same week a district president escalated to demanding an immediate hike.
What to watch:The next GDPNow revisions as August industrial production (Tuesday) and housing data arrive; the BEA’s official Q3 advance estimate is not due until late October.
UNCERTAIN
4. Private Hiring Decelerates for a Sixth Straight Week While Continuing Claims Fall — a Labour Market Slowing Without Breaking (ADP / DOL, Tue Aug 11 & Thu Aug 13)
What they’re saying:ADP’s weekly tracker showed private payrolls rising just 8,300 in the week reported August 11, down from 15,000 the prior week and less than half the roughly 21,000 four-week average through late June — a sixth consecutive weekly deceleration. On Thursday, initial jobless claims for the week ended August 8 rose to 209,000 from 200,000, above the 202,000 consensus, while continuing claims fell 22,000 to 1,777,000, below the roughly 1.8 million forecast. The federal funds target range remains 3.50%-3.75% after the July 28-29 meeting.
The context:Six consecutive weeks removes the interpretive escape route a single soft reading offers, and 8,300 a week annualises to a pace that does not absorb labour-force growth. In an ordinary cycle that would be unambiguous policy relief and the front end would rally hard; instead the 2-year fell 1.9 basis points on the day, which is the market declining to trade it. The reason sits in the energy and expectations data running alongside — a committee facing decelerating hiring and a chokepoint-driven cost shock is choosing between mandates rather than reading a signal. The split inside the claims data is the honest summary: rising new filings against falling ongoing claims describes a market that is neither deteriorating sharply nor tightening. Both readings deserve weight, and ADP’s weekly series is heavily revised with a documented tendency to overstate turning points; six weekly observations across the summer hiring trough is a short window. The monthly establishment survey remains the authority and the next one is weeks away.
What to watch:Tuesday’s weekly ADP print — a seventh consecutive deceleration, or a break below zero, becomes impossible to dismiss as summer noise. Watch whether initial claims sustain a trend above 200,000.
BEARISH
5. A Record $432 Billion July Deficit With Tariff Receipts Running Negative — and Fitch Puts Debt-to-GDP at 127% by 2027 (US Treasury, Wed Aug 12; Fitch Ratings, Thu Aug 13)
What they’re saying:The July federal deficit hit a record $432 billion, the largest monthly gap since March 2021 and 48% wider than July 2025, taking the fiscal-year-to-date shortfall to $1.799 trillion with two months still to run — already above the entire fiscal 2025 total. Net customs receipts were negative $8.55 billion for the month after $33.38 billion of tariff refunds traceable to the Supreme Court’s February ruling striking down the IEEPA tariffs; the Court of International Trade’s order covers roughly $166 billion owed to about 330,000 importers. Adjusted for the calendar shift that pulled August benefit payments into July, the deficit was $333 billion, still up 18% year-on-year. Fitch affirmed the sovereign at AA+ with a stable outlook on Thursday while projecting debt-to-GDP climbing to 127% by 2027 from 114.5%, a general government deficit of 7.4% of GDP — the highest among AA-rated sovereigns — and growth of just 1.9% in 2026-2027.
The context:A tariff programme scored as a revenue source has become, for at least one month, a net cash outflow, and roughly a fifth of the court-ordered refund liability has been discharged — the remainder is a known claim that keeps suppressing the customs line for months. The transmission runs through issuance, and the curve behaved accordingly. On a week containing two disinflation prints and a collapse in 2026 hike odds, the 10-year still rose 4.5 basis points while the 2-year fell (see Vol & Treasuries table in Section B). That is difficult to explain with the policy path, which moved dovishly, and straightforward to explain with supply. BofA’s Hartnett added the long-run frame the same week, projecting national debt reaching $50 trillion by mid-2029 from roughly $39.9 trillion now, with federal interest costs already near $1.4 trillion over the past twelve months. Two limits: the refund liability is large but finite and largely known, and the administration retains Section 232, 301 and 338 authorities unaffected by the IEEPA ruling that can replace some of the lost receipts.
What to watch:Wednesday’s 20-year bond auction is the week’s direct test of demand sensitivity to the fiscal outlook, with the prior yield at 5.163%. Watch the customs receipts line in the August Monthly Treasury Statement for whether a second consecutive negative print confirms the refund pace.
— Know the probability before the market prices in the risk. Apply for membership at join.recessionalert.comE. WEEK IN EARNINGS -> TOP
TOP EARNINGS OF THE WEEK
BEARISH
1. Cisco Systems (CSCO): -8.03% on the week | Beat Every Line, Raised Every Number, and Lost 210 Basis Points of Gross Margin to the Memory Bill
The Numbers:Fiscal Q4 revenue of $17.3 billion, a record, up 18% year-on-year against $16.84 billion consensus, with product revenue up 24% to $13.5 billion. Non-GAAP EPS $1.22 versus $1.17 expected, up 23%; GAAP EPS $0.97, up 52% against a $0.85 estimate. Full-year fiscal 2026 revenue $63.3 billion (+12%) on non-GAAP EPS of $4.33 (+14%). Fiscal 2027 guidance of $72.2-73.4 billion against roughly $68.69 billion consensus — a $3.5 billion beat at the midpoint — with non-GAAP EPS guided to $5.05-5.11 and fiscal Q1 revenue to $18.0-18.2 billion. Gross margin fell 210 basis points to 66.3%, while operating expenses fell 370 basis points as a share of revenue, lifting operating margin to 35.9% from 34.3%. Quarterly dividend $0.42; roughly 13 million shares repurchased for $1.5 billion.
The Problem/Win:The win is an order book that is no longer arguable: $4 billion of hyperscaler AI infrastructure orders in the quarter alone took fiscal 2026 to $9.3 billion, roughly 4.5 times fiscal 2025, clearing inside one quarter a full-year target the company had already raised to $9 billion. Total product orders rose 35% year-on-year and 25% excluding hyperscalers, with double-digit growth across every geography and customer market and networking product orders up 40% — an eighth consecutive quarter of double-digit growth. CEO Chuck Robbins confirmed five new hyperscaler design wins including first deployments of the proprietary Silicon One P200. The problem is two numbers sitting beside each other in the same disclosure. Gross margin fell 210 basis points on heavier hardware mix and memory costs, and management guided fiscal 2027 AI infrastructure revenue to $7.5 billion against $9.3 billion of fiscal 2026 orders — an orders-to-revenue conversion question the reaction largely skipped past in favour of the margin line.
The Ripple:Arista fell 3.27% and Amphenol 2.48% on Thursday even as the Nasdaq gained 1.15%, while SanDisk rose 13.67% and Micron 4.23% on the same NAND and DRAM tightness Cisco booked as a cost. Truist raised its target to $140 and Rosenblatt to $165 into the selloff, and the stock still finished the week the second-worst mega-cap decliner at -8.03%.
What It Means:Operating margin expanded 160 basis points on cost discipline while gross margin fell 210 on inputs — Cisco is holding profitability by managing the lines it controls, which is durable but finite. AI-infrastructure exposure taken through a systems vendor now carries an embedded short of memory pricing that a pure-play does not.
What to watch:Whether fiscal Q1 guidance in November holds the ~15% revenue growth path with gross margin stabilising above 66%, and how management characterises the $7.5 billion AI figure — conservatism or visible demand determines whether this selloff was positioning or repricing.
UNCERTAIN
2. Applied Materials (AMAT): -5.93% on the week | Record Quarter, $710 Million Guidance Beat, and Two Consecutive Down Sessions on the China Line
The Numbers:Fiscal Q3 revenue of $9.12 billion, a record, up 25% year-on-year against an $8.99 billion estimate (+1.33%). Non-GAAP EPS $3.50 versus $3.40 consensus (+2.86%) and up 41% year-on-year; GAAP EPS $3.17 against a $3.44 estimate (-7.91%). GAAP gross margin 50.3%, with record operating income of $3.08 billion, or 33.7% of revenue. Record cash from operations of $3.04 billion; $860 million returned via $440 million of buybacks and $420 million of dividends. Fiscal Q4 guidance of approximately $10.25 billion ± $0.50 billion against $9.54 billion consensus — the low end of the range still clears consensus by $210 million — with non-GAAP EPS of $4.02 ± $0.20 against $3.69. Calendar-2026 Semiconductor Systems revenue expectations were raised on AI-driven demand. China was approximately 28% of sales, down from roughly 35% a year earlier. Shares fell 2.48% Thursday on pre-earnings positioning, 3.14% after hours, and a further 5.12% Friday to $507.18.
The Problem/Win:There is no operational problem in this report, which is what makes it the week’s most instructive print. A guide beating consensus by roughly $710 million at the midpoint is unusually decisive, and raising the calendar-2026 Semiconductor Systems outlook is the largest equipment vendor underwriting the capital-intensity assumptions the entire AI complex rests on. The problem is composition and setup. China falling seven points of revenue mix in twelve months quantifies what export restrictions have removed, and it arrived against a stock that had run more than 140% over the prior year and roughly 200% into the print. Against that bar, growth alone was insufficient — investors wanted evidence AI demand is replacing Chinese demand faster than policy removes it, and a seven-point mix drop did not settle it. The GAAP-versus-non-GAAP gap reinforced the caution.
The Ripple:The reaction did not generalise. On Friday, AMD rose 6.50% and Micron 2.30% while Applied fell 5.12% and Broadcom 5.94% — the market separating names whose AI exposure is unencumbered from those carrying China-policy risk or contingent financing risk, rather than trading semis as a block. Erste Group cut to Hold; Morgan Stanley lowered its target to $646; UBS maintained Buy at $675.
What It Means:The rebalancing away from China structurally reduces export-control exposure even as total revenue climbs — a better business in two years, a worse print today. A beat-and-raise that sells off twice is multiple compression on a crowded position, not a verdict on the equipment cycle.
What to watch:The China mix in the fiscal Q4 report against this quarter’s 28% — stabilisation means the hit is absorbed, a further decline means the base is still shrinking underneath the AI growth. Watch whether gross margin holds above 50% in the Q4 guide, since that is where memory-driven input costs would first appear.
BULLISH
3. Brookfield Corporation (BN): +0.94% on the print | A Record $77 Billion Fundraising Quarter Behind a Two-Cent Headline Miss
The Numbers:Released before the bell Thursday, August 13. Distributable earnings before realisations of $1.4 billion, or $0.61 per share, up 15% per share year-on-year but a shade below the $0.62 consensus (-2.31%). Total distributable earnings of $1.5 billion, or $0.66 per share, ahead of the $0.64 estimate (+2.98%). Revenue of $1.67 billion was in line. Net income $703 million for the quarter and $3.7 billion over the trailing twelve months; distributable earnings before realisations $5.7 billion over the same period. Brookfield raised a record $77 billion during the quarter, lifting fee-bearing capital 19% to $672 billion. Wealth Solutions generated $480 million of distributable earnings, up 23%, with insurance assets above $190 billion. Asset-management fee-related earnings rose 20%. Market capitalisation approximately $110.6 billion.
The Problem/Win:The franchise metrics are unambiguous and the headline number is not. A record $77 billion raised in a single quarter, with fee-bearing capital up 19% to $672 billion, is the strongest available statement about institutional appetite for private capital; the two-cent shortfall on distributable earnings before realisations is realisation timing rather than a franchise signal. Wealth Solutions is doing the compounding — distributable earnings up 23% with insurance assets now above $190 billion.
The Ripple:Financials rose 0.52% on the day and finished the week +0.73%, sitting third on 3-month performance at +12.62% (see sector rotation table in Section B). The result reads directly into the week’s dominant thread: Brookfield is one of the six partners on Nvidia’s $500 billion AI-infrastructure financing platform, and a record private-capital raise is exactly the funding capacity that programme is designed to tap.
What It Means:The distributable-earnings miss is the wrong number to trade. Fee-bearing capital is the annuity and it grew 19%; the earnings line follows as realisations normalise. On a week when the market was actively repricing who can fund the AI buildout, a record raise from a named platform partner is a more useful datapoint than two cents of timing.
What to watch:Whether fee-bearing capital growth holds near 19% next quarter and Wealth Solutions insurance assets extend past $200 billion. Watch also for Brookfield’s first named commitment under the Nvidia platform, which would convert partnership into deployed capital.
WEEK AHEAD PREVIEW:
Q2 2026 earnings season is nearly complete at 88% of the S&P 500 reported, and the calendar thins sharply from here. The remaining names are concentrated in the retail and industrial reporters that close out the quarter, and both of next week’s mega-caps speak directly to the consumer question today’s data raised.
Home Depot (HD) — BMO, Tuesday, August 18 — the most consequential read on the US consumer on next week’s calendar, arriving days after July retail sales posted their first decline in nine months. Key focus: comparable-store sales and any change in the big-ticket discretionary trend, the split between professional and DIY demand, and whether management revises full-year guidance in light of the housing-turnover backdrop and elevated mortgage rates. Consensus stands at $4.73 EPS on $47.25 billion of revenue.
Deere & Co (DE) — BMO, Thursday, August 20 — the quarter’s cleanest read on North American agricultural capital spending, reporting into a grain market disrupted by the Black Sea export collapse. Key focus: large agriculture equipment order books and early commentary on the 2027 season, construction and forestry segment margins, and whether farmer income pressure is deferring replacement demand.
Note that Monday, August 17 carries no >$100B reporters; the week’s earnings risk is concentrated in Tuesday and Thursday. Q3 2026 earnings season begins in mid-October.
— US market commentary trusted by family offices and institutions. Apply for membership at join.recessionalert.comF. NEXT WEEK SETUP -> TOP
UPCOMING RELEASES:
| Date | Event | Why It Matters |
|---|---|---|
| Mon, Aug 17 | NY Empire State Manufacturing Index (Aug, prior 15.60) | First regional read on August activity, and the first hard datapoint arriving after Friday’s retail sales and sentiment misses. A soft print extends the growth-side deterioration that took GDPNow from 5.8% to 4.3%. |
| Mon, Aug 17 | NAHB Housing Market Index (Aug, prior 34) | Builder sentiment against a 30-year mortgage near 6.77%. At 34 the index is already deep in contraction; the direction matters more than the level for read-through to Tuesday’s starts and permits. |
| Tue, Aug 18 | ADP Employment Change Weekly (prior 8.25K) | A seventh consecutive weekly deceleration — or the first break below zero — would move the labour-cooling read from summer noise to trend, and is the series the front end has so far declined to trade. |
| Tue, Aug 18 | Building Permits Prelim (Jul, prior 1.374M) | The forward-looking half of the housing pair and the more useful of the two. Permits lead starts by roughly a quarter and speak directly to the residential-investment component GDPNow just cut. |
| Tue, Aug 18 | Housing Starts (Jul, prior 1.427M) | Existing home sales already slipped 1.7% in July on tight 4.6-month inventory. Weak starts alongside that would confirm the constraint is affordability rather than supply, keeping rate-sensitive sectors under pressure. |
| Tue, Aug 18 | Industrial Production MoM (Jul, expected 0.3%, prior 0.1%) | A direct GDPNow input and the cleanest test of whether July’s weakness was confined to the consumer. A miss here broadens the growth story beyond retail. |
| Tue, Aug 18 | Capacity Utilization (Jul, expected 76.3%, prior 76.1%) | Slack in the industrial base is a disinflationary offset the Fed’s hawks tend to discount. A reading below expectations weakens the case for the immediate hike Hammack is demanding. |
| Tue, Aug 18 | NY Fed Services Activity Index (Aug, prior 8.7) | Services is where inflation has been stickiest and where the labour slowdown would show up last. A firm print alongside soft manufacturing is the bifurcated read that keeps the policy debate unresolved. |
| Tue, Aug 18 | Pending Home Sales MoM (Jul, expected 1.5%, prior -5.4%) | The expected rebound from June’s -5.4% is the market’s assumption that the rate reprieve to 6.77% translated into contracts. A miss says affordability is binding regardless of small rate moves. |
| Wed, Aug 19 | 20-Year Bond Auction (prior yield 5.163%) | The week’s direct test of the fiscal story. With a record $432 billion July deficit, negative net customs receipts and Fitch flagging debt-to-GDP at 127% by 2027, weak demand at the long end would confirm that the 10-year’s rise is supply rather than policy. |
| Wed, Aug 19 | FOMC Minutes | The highest-leverage release of the week. The minutes cover the July 28-29 meeting at which Hammack dissented in favour of a hike, and will show whether her position had sympathisers or was genuinely isolated — the single question the market cannot currently price. |
WHAT TO WATCH NEXT WEEK:
1. Does Canada blink before 12:01 AM Wednesday, or does the market discover it mispriced a tariff deadline? Greer named one condition — Canada lifting its retaliatory measures — and Ottawa spent the week refusing. The S&P closed at records four days out, which means the downside branch is not in the price. Autos are the transmission channel, because Section 338 overrides USMCA origin rules and a 50% duty compounds at each border crossing.
2. Do Wednesday’s FOMC minutes show Hammack had company in July? One dissenter is noise and two is a bloc. The market has priced 2026 hike odds down to 49% on the assumption she is isolated; the minutes are the first document that can test it, and they arrive before Jackson Hole rather than after.
3. Does Home Depot’s interim leadership trim full-year guidance on Tuesday — and can anyone tell why? The quarter will be delivered by a three-way interim structure six days after the CEO’s medical leave. A soft outlook creates a genuine attribution problem between weak demand and cautious stewardship, and a market that just watched retail sales fall 0.6% will price the worse of the two.
4. Does a third consecutive US crude build turn the supply panic into a demand story? Brent gained 7.65% on the week while US inventories posted their largest build since January 2023. Those cannot both describe the same market for long. Wednesday’s EIA report either confirms the accumulation or revises the 17.4 million-barrel figure away.
5. What spread clears on the first tranche of Nvidia’s syndicated AI financing? Goldman began placing the paper with insurers and private credit on Friday. The spread over Treasuries and the assumed residual value on the compute assets are the two numbers that reveal what the credit market believes about GPU depreciation — a belief no equity multiple in the complex currently discloses.
— US market commentary trusted by family offices and institutions. Apply for membership at join.recessionalert.comG. CHART OF THE WEEK -> TOP
WHY THIS CHARTFour of the week’s five candidates examined earnings quality or employment revisions; this is the only one that explains the week’s central contradiction — how headline CPI can print 3.4% while the three-month rate annualises at 0.5%, and why the hawkish-looking energy prints arriving between now and January are already written into the base rather than carrying new information. In a week when a sitting Fed president demanded an immediate hike hours after a soft PPI, and Brent still gained 7.65%, the arithmetic underneath that disagreement is the most useful thing a portfolio manager can be shown.
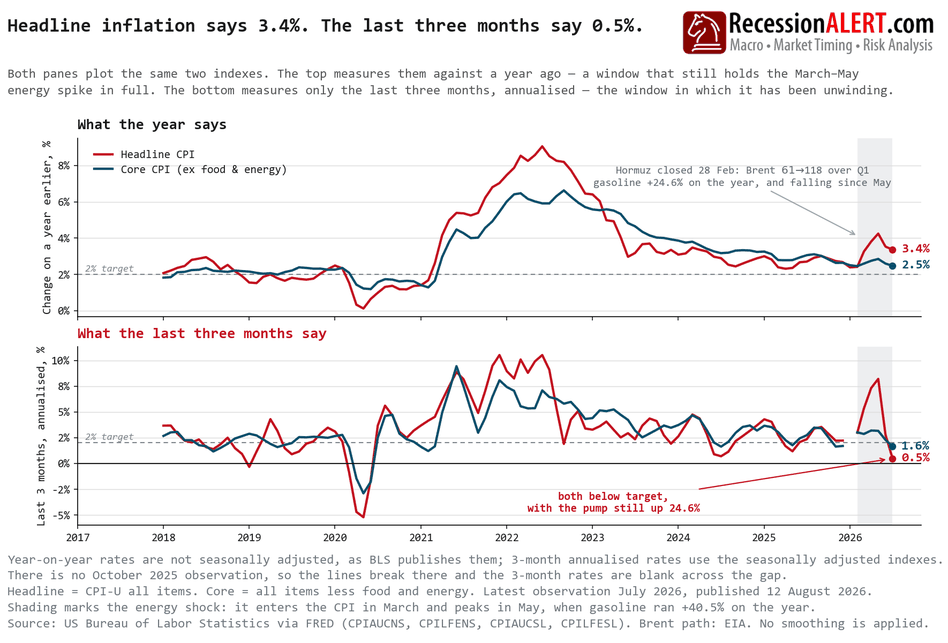
ORIGINAL CHART ANALYSIS — FROM THURSDAY’S MIBGasoline is $4.04 a gallon. A year ago it was $3.14, and that gap is what separates a 3.4% headline print from a three-month rate of 0.5%. Hold the energy index dead flat at July’s level — no barrel moves, no pump price changes — and energy on a year earlier still climbs from +14.7% now to +18.6% in December and +19.2% in January, gasoline touching +34%, before lapping the shock and collapsing to roughly +5% in March 2027. Nothing rises; the base beneath it falls. That is why the two panes disagree: the twelve-month window spans August 2025 to July 2026 and contains the Hormuz shock in full, while the three-month window covers the months in which it has been unwinding — energy -1.5% in July, gasoline -2.9%, after -5.7% in June — annualising headline at 0.5% and core, the steadier half, at 1.64%, the softest since July 2024. The shock did reach core: airline fares ran from +7.1% year-on-year in February to +25.6% in July, and core still round-tripped, 2.47% to 2.82% in May and back to 2.47%, the return paid for by medical care services falling from 3.56% to 2.65% and core goods from 1.07% to 0.78%. The Fed can read the bottom pane — futures put roughly 64% on a hold on 15-16 September — and a household reads the receipt. The constraint is not the trend. It is the pump, and pumps unwind faster than labour markets repair.
What it means: front-end duration is the exposure — hawkish repricing into year-end will run on prints the base has already written, not on new information. That reverses only if a second energy leg or re-accelerating shelter moves core itself.
MIB Weekly Digest Ver. 1.91
For professional investors only. Not investment advice.
© 2026 RecessionALERT.com

Comments are closed.