
MARKET INTELLIGENCE BRIEF (MIB)
Tuesday, August 11, 2026
Hormuz transits collapse to six vessels against a pre-war 140 — crude posts a fifth straight gain and equities slip into tomorrow’s CPI. The EIA picks the same day to raise its 2026 diesel forecast 8.5% and sees crude stocks below the five-year low all year. Private payrolls decelerate for a sixth week; the front end barely blinked. Alphabet -3.84% as 300 French publishers file over AI Overviews. Intel prices an upsized $20B raise at $95 on $100B of demand.
TABLE OF CONTENTS
A. EXECUTIVE SUMMARY
B. MARKET DATA
C. HIGH-IMPACT STORIES (5)
D. MODERATE-IMPACT STORIES (8)
E. ECONOMY WATCH (6)
F. EARNINGS WATCH (0)
G. WHAT’S NEXT
H. CHART OF THE DAY
A. EXECUTIVE SUMMARY -> TOP
US equities gave way modestly and narrowly into tomorrow’s July CPI print — the S&P 500 fell 0.32% to 7,728.09, the Dow 0.34% and the Nasdaq 100 0.33%, while the Russell 2000 rose 0.36% for a second straight session of small-cap resistance to a falling mega-cap tape. The proximate driver was crude’s fifth consecutive gain, WTI +1.47% to $83.34 and Brent +1.53% to $89.06, after vessel-tracking data put Strait of Hormuz transits at six against a pre-war 140. The heavier signal was the EIA’s same-day decision to raise its 2026 diesel forecast 8.5% and project commercial crude inventories below the five-year low through year-end — energy pressure tomorrow’s July data cannot yet capture, arriving as private payrolls decelerate for a sixth straight week. Breadth was narrow rather than defensive: Communication Services fell 2.06% on Alphabet’s French antitrust complaint while Technology closed green at +0.13% and Energy added 0.53%, with Utilities leading at +0.98%.
• Hormuz traffic collapses to six vessels against a ten-day average near eleven and a pre-war 140 — two of the four inbound ships were empty. Crude rose a fifth straight session; Energy +0.53% and +33.94% year to date.
• EIA raises 2026 fuel forecasts the day before CPI — wholesale diesel +8.5% to $3.37/gal, gasoline +5.9% to $2.91, and commercial crude stocks projected below the 2021-2025 five-year low through end-2026 (2026 estimate cut 8.6% to 396mn barrels).
• Labour signals split. ADP weekly private payrolls +8,300, a sixth consecutive deceleration — yet the 2-year yield fell only 1.9 bps to 4.220%. NFIB small-business optimism hit an eleven-month high at 99.8 versus 97.5 expected, on improved hiring plans.
• Alphabet -3.84% to $343.80 as roughly 300 French publishers file an antitrust complaint over AI Overviews, claiming referral traffic down 33-38%. Communication Services was the worst sector today (-2.06%), on one week (-4.53%) and on three months (-7.53%).
• The AI trade split in two. Equipment and power rallied — KLA +4.01%, Arista +3.31%, GE Vernova +2.12%, Lam +1.64% — while platforms fell (Oracle -3.69%, Dell -3.69%). Intel priced an upsized $20bn share sale at $95 on roughly $100bn of demand, five times covered.
• API reported a 9.07mn barrel crude build after the close against expectations of a 0.5mn draw — a second straight weekly accumulation that contradicts the supply-shock tape, ahead of tomorrow’s official EIA inventory report.
1. Energy is repricing the inflation path faster than the data can measure it — five consecutive crude gains, an 8.5% upward revision to the government’s own 2026 diesel forecast, and inventories projected below the five-year floor all year describe pressure that tomorrow’s July CPI covers a period too early to capture. A benign print is therefore not the reassurance it looks like. The offsetting evidence is real and should be weighed: natural gas fell on both sides of the Atlantic, ruling out a broad energy-inflation read, and the API’s 9.07mn barrel build says barrels are arriving regardless of the chokepoint.
2. Weak labour data has stopped functioning as a dovish input — a sixth straight week of payroll deceleration, following July’s monthly contraction, produced a 1.9 bp move in the 2-year and an unchanged curve. That non-reaction is the market recognising that a committee facing softening employment alongside a propagating energy shock is choosing between mandates rather than reading one signal, with a district president already dissenting for hikes. The configuration this market has not yet had to price is a CPI that lifts the front end while hiring momentum keeps deteriorating.
3. The distribution has widened at both ends while the tape prices the middle — the VIX fell 1.16% to 15.28 on a down session on the eve of the week’s highest-leverage release, recession probabilities eased across nearly every model (RSM to 30%, NY Fed 15.2%, Polymarket 8%, Moody’s the outlier near 50%), and Deutsche Bank’s near-perfect-landing warning was corroborated by the same tape that ignored it. The AI complex is already positioning accordingly, paying for the toll road — equipment, networking, power — rather than the destination whose terminal economics remain contested.
 — Leading economic indicators. Accurate market forecasts. Apply for membership at join.recessionalert.com
B. MARKET DATA -> TOP
US equities eased modestly (S&P -0.32%, Dow -0.34%, Nasdaq -0.33%) as Iran’s continued closure of the Strait of Hormuz lifted crude oil (WTI +1.47%, Brent +1.53%) ahead of tomorrow’s CPI print. The decline was narrow and large-cap-led — Russell 2000 (+0.36%) and NYSE Composite (flat) held up while Communication Services (-2.06%) dragged the tape on steep Alphabet declines (GOOGL -3.84%, GOOG -3.61%). Chip-equipment names bucked the tape on AI capex optimism — KLA (+4.01%), Arista (+3.31%) — while SpaceX (-3.93%) extended losses as a fading rally met share-unlock supply concerns. VIX and yields both eased despite the dip, pointing to controlled positioning rather than fear-driven selling.
CLOSING PRICES – Tuesday, August 11, 2026:
MAJOR INDICES
The decline was shallow and evenly distributed across large-cap benchmarks (S&P, Dow, Nasdaq all -0.32% to -0.34%), while Russell 2000 (+0.36%) and NYSE Composite (+0.07%) held essentially flat to positive — a narrow, large-cap-led dip rather than broad market stress. DJIA and DJTA moved in lockstep (-0.34% vs -0.32%), showing no Dow Theory divergence today.
| Index | Close | Change | %Move | Why It Moved |
|---|---|---|---|---|
| S&P 500 | 7,728.09 | -25.02 | -0.32% | Iran’s continued Strait of Hormuz closure lifted oil and unsettled sentiment ahead of tomorrow’s CPI print. |
| Dow Jones | 53,791.85 | -184.13 | -0.34% | Tracked the broader Iran-driven risk-off tone. |
| DJ Transportation | 21,297.60 | -68.50 | -0.32% | Higher crude oil weighed on transports’ fuel-cost outlook. |
| Nasdaq 100 | 29,525.48 | -96.33 | -0.33% | Big Tech weakness led by Alphabet (GOOGL -3.84%, GOOG -3.61%). |
| Russell 2000 | 3,028.38 | +10.98 | +0.36% | Small-caps decoupled from the mega-cap tech pressure weighing on Nasdaq. |
| NYSE Composite | 24,685.57 | +17.68 | +0.07% | Broad tape held roughly flat, confirming the decline was concentrated in large-cap tech. |
VOLATILITY & TREASURIES
VIX eased (-1.16%) alongside modestly lower yields (10Y -0.4 bps, 2Y -1.9 bps) even as equities dipped — a signature of controlled, ahead-of-data positioning rather than fear-driven selling. DXY held flat (+0.03%), showing no dollar safe-haven bid despite the Iran-driven oil-supply headline.
| Instrument | Level | Change | Why It Moved |
|---|---|---|---|
| VIX | 15.28 | -0.18 (-1.16%) | Eased despite the equity dip — orderly positioning, not panic. |
| 10-Year Treasury Yield | 4.694% | -0.4 bps | Little changed; no growth-scare bid into duration. |
| 2-Year Treasury Yield | 4.220% | -1.9 bps | Marginally lower ahead of tomorrow’s CPI print. |
| US Dollar Index (DXY) | 99.84 | +0.03 (+0.03%) | Essentially flat; no safe-haven bid from the Iran headline. |
COMMODITIES
Precious metals split — gold’s modest +0.17% safe-haven bid on the Iran headline contrasted with silver’s -0.62% slip on industrial-demand concerns. Copper held firm (+0.19%), a stable industrial-demand signal. Bitcoin fell -0.69%, tracking the broader risk-off tape rather than decoupling.
| Asset | Price | Change | %Move | Why It Moved |
|---|---|---|---|---|
| Gold | $4,427.25/oz | $7.55 | +0.17% | Modest safe-haven bid on the Iran/Strait of Hormuz headline. |
| Silver | $64.87/oz | -$0.41 | -0.62% | Slipped on industrial-demand concerns, diverging from gold. |
| Copper | $6.6288/lb | $0.0128 | +0.19% | Held firm; no read-through from the day’s risk-off tone. |
| Platinum | $1,753.45/oz | -$0.15 | -0.01% | Essentially unchanged. |
| Bitcoin | $63,744 | -$441.00 | -0.69% | Tracked the broader risk-off tape rather than decoupling. |
ENERGY
WTI and Brent moved in lockstep (+1.47% / +1.53%) on Iran’s refusal to reopen the Strait of Hormuz — a pure crude supply-risk story. Natural gas fully decoupled: Henry Hub (-1.57%) and Dutch TTF (-1.30%) both fell, confirming no broader energy-inflation read-through. Oil rising while equities dip is a mild stagflationary/cost-pressure signal, not a demand-growth one.
| Asset | Price | Change | %Move | Why It Moved |
|---|---|---|---|---|
| Crude Oil (WTI) | $83.34/bbl | $1.21 | +1.47% | Iran kept the Strait of Hormuz shut, lifting crude on supply risk. |
| Crude Oil (Brent) | $89.06/bbl | $1.34 | +1.53% | Moved with WTI on the same Hormuz supply-risk headline. |
| Natural Gas (Henry Hub) | $2.750/MMBtu | -$0.044 | -1.57% | Decoupled from crude — no supply-risk read-through to gas. |
| Natural Gas (Dutch TTF) | $20.31/MMBtu | -$0.27 | -1.30% | European gas also decoupled from the crude-driven move. |
S&P 500 SECTORS
Utilities led today (+0.98%) despite a -4.61% 1-month and -5.18% 3-month slide — a defensive rotation into the sector’s weakest recent laggard ahead of tomorrow’s CPI print. Communication Services was today’s worst performer (-2.06%) and is also the worst on 1-week (-4.53%) and 3-month (-7.53%) horizons — a deepening, structural laggard rather than a one-day blip, consistent with Alphabet’s sharp declines in the movers table.
| Sector | 1-Day | 1-Week | 1-Month | 3-Month | 6-Month | YTD | 12-Month |
|---|---|---|---|---|---|---|---|
| Utilities | +0.98% | -1.21% | -4.61% | -5.18% | -1.85% | +1.94% | +3.75% |
| Energy | +0.53% | +2.55% | +5.85% | +3.45% | +14.46% | +33.94% | +40.67% |
| Technology | +0.13% | +0.14% | +3.85% | +4.86% | +23.60% | +23.62% | +31.23% |
| Industrials | +0.02% | -0.04% | +1.67% | +0.65% | +2.47% | +15.99% | +20.94% |
| Financial | -0.15% | -0.18% | +2.85% | +11.95% | +6.93% | +8.23% | +16.88% |
| Basic Materials | -0.29% | +5.08% | +9.59% | -3.11% | -1.41% | +16.91% | +37.06% |
| Consumer Defensive | -0.32% | -0.67% | +0.09% | -0.85% | -4.54% | +7.54% | +3.47% |
| Healthcare | -0.40% | +3.46% | +3.11% | +14.87% | +6.83% | +8.33% | +29.10% |
| Consumer Cyclical | -0.59% | -0.01% | +3.14% | -0.81% | +0.86% | -1.09% | +5.68% |
| Real Estate | -0.67% | -2.29% | -1.42% | -0.16% | +3.65% | +8.78% | +7.57% |
| Communication Services | -2.06% | -4.53% | -2.84% | -7.53% | -1.25% | -1.15% | +12.44% |
TOP MEGA-CAP MOVERS:
GAINERS
| Company | Ticker | Close | Change | Why It Moved |
|---|---|---|---|---|
| KLA Corp | KLAC | $200.47 | +4.01% | Chip-equipment names rallied on AI capex optimism; Cantor Fitzgerald and Barclays raised price targets on a durable wafer-fab-equipment upcycle. |
| Arista Networks Inc | ANET | $197.85 | +3.31% | Extended its post-earnings AI-networking rally after Q2 revenue and Q3 guidance topped consensus. |
| GE Vernova | GEV | $1,011.88 | +2.12% | Advanced with the broader AI-driven power-equipment demand trade; no company-specific catalyst identified. |
| Lam Research Corp | LRCX | $311.41 | +1.64% | Rose alongside chip-equipment peers KLA and Applied Materials on the same AI capex-cycle optimism. |
| Home Depot Inc | HD | $354.38 | +1.05% | Moved against a declining Consumer Cyclical sector; likely early positioning ahead of Aug. 18 earnings. |
DECLINERS
| Company | Ticker | Close | Change | Why It Moved |
|---|---|---|---|---|
| Space Exploration Technologies Corp | SPCX | $133.29 | -3.93% | A fading Argus-upgrade-driven rally met concerns over an Aug. 20 share unlock equal to over three days’ trading volume. |
| Alphabet Inc | GOOGL | $343.80 | -3.84% | Declined with broad Big Tech weakness amid Iran-driven risk-off sentiment ahead of tomorrow’s CPI print. |
| Dell Technologies Inc | DELL | $440.97 | -3.69% | Declined with broad Big Tech weakness amid Iran-driven risk-off sentiment ahead of tomorrow’s CPI print. |
| Oracle Corp | ORCL | $145.48 | -3.69% | Declined with broad Big Tech weakness amid Iran-driven risk-off sentiment ahead of tomorrow’s CPI print. |
| Alphabet Inc | GOOG | $343.00 | -3.61% | Declined with broad Big Tech weakness amid Iran-driven risk-off sentiment ahead of tomorrow’s CPI print. |
— Institutional-grade intelligence for serious investors. Apply for membership at join.recessionalert.comC. HIGH-IMPACT STORIES -> TOP
BEARISH
1. Strait of Hormuz Traffic Collapses to Six Vessels — Crude Posts a Fifth Straight Gain and Equities Slip Into the CPI Print
The core facts:Kpler vessel-tracking data published at 04:20 GMT Tuesday recorded six transits through the Strait of Hormuz on Monday, against a ten-day average of roughly eleven — a decline of about 45% against the recent run rate. The composition is thinner than the headline count suggests: four commodity vessels entered the waterway, two of them empty product tankers, while two exited, one carrying liquefied petroleum gas and one residual fuels. Pre-war transit ran near 140 vessels a day. Traffic had recovered between mid-June and early July under the now-defunct US-Iran memorandum of understanding, fell to a two-month low by end-July, and has deteriorated further as Tehran asserted control over transits and Houthi forces extended threats to Saudi-linked shipping in the Red Sea and Bab el-Mandeb. Crude rose for a fifth consecutive session: WTI added $1.21, or 1.47%, to $83.34 a barrel and Brent $1.34, or 1.53%, to $89.06. The equity tape gave way modestly and narrowly — the S&P 500 fell 0.32% to 7,728.09, the Dow 0.34% and the Nasdaq 100 0.33%, while the Russell 2000 rose 0.36% and the NYSE Composite 0.07%. Energy gained 0.53% and now stands +33.94% year to date and +40.67% over twelve months. Natural gas moved the other way: Henry Hub fell 1.57% to $2.750 per MMBtu and Dutch TTF 1.30% to $20.31.
Why it matters:The measurement is what makes today different from the last several sessions of headline-driven crude strength. Since February the market has traded Hormuz on statements — Iranian conditions, US responses, reported talks — and those statements have produced round trips in both directions, including a 7% selloff last week on the prospect of a deal and a 5% recovery on Monday when Tehran hardened its terms. A vessel count is not a statement. Six transits against a pre-war 140 is a physical read on a waterway that has effectively stopped functioning, and the disclosure of that number rather than another round of rhetoric is what the market received today. The composition detail sharpens it further: two of the four vessels that entered were empty, which means inbound capacity is repositioning rather than lifting cargo, and the two that exited carried LPG and residual fuels rather than crude. That is the profile of a lane being wound down, not one operating at reduced volume. The transmission into US portfolios is narrower than the headline implies, and the market said so explicitly. Natural gas decoupled outright — both Henry Hub and Dutch TTF fell on a session when crude rose 1.5% — which rules out the broad energy-inflation read that would have made this a macro event rather than a crude event. The equity decline was similarly contained: large-cap benchmarks fell between 0.32% and 0.34% while small caps and the broad NYSE tape held green, and Energy’s 0.53% gain is a genuine offset inside an index where the sector has led all year. What argues against complacency is the timing. Crude has now risen five sessions running into a CPI print, and a market that absorbs each individual increment calmly can still find the cumulative move has repriced the inflation path underneath it.
What to watch:The daily Kpler transit count rather than the crude price — a further drop toward two or three vessels, or a recovery above the ten-day average of eleven, will lead the price. Watch Brent’s $89.06 close against $90, a level that would mark the market pricing no resolution at all.
BEARISH
2. The EIA Raises Its 2026 Diesel and Gasoline Forecasts and Sees Crude Inventories Below the Five-Year Low All Year — Published the Day Before CPI
The core facts:The Energy Information Administration published its monthly Short-Term Energy Outlook today, August 11. The agency now projects 2026 wholesale diesel at $3.37 a gallon, raised 8.5% from the prior edition, and 2027 diesel at $2.62, raised 6.3%. Gasoline was lifted to $2.91 a gallon for 2026, up 5.9%, and $2.32 for 2027, up 9.0%. On inventories, the EIA forecasts US commercial crude oil stocks to remain below the 2021-2025 five-year low through the end of 2026, with 2026 inventories projected at 396 million barrels — cut 8.6% from last month’s forecast. The crude price path is not a straight-line escalation: the agency carries Brent at $85 a barrel in the third quarter of 2026 before falling to $69 in 2027, implying it expects the current disruption to resolve rather than persist. Brent closed today at $89.06, above the agency’s own third-quarter forecast.
Why it matters:The refined-product forecasts are the market-relevant content, not the crude number, and they are where the Hormuz disruption stops being a commodity story and becomes a consumer-price story. Diesel is the input into freight, agriculture, construction and rail, and it propagates into goods prices with a lag measured in weeks rather than quarters; an 8.5% upward revision to the full-year forecast by the government’s own statistical agency is a direct statement that the pass-through has not yet occurred. Gasoline at $2.91 does the same work on the household side. Both revisions landing the day before a July CPI print is what converts a monthly energy publication into a market event — the forecast describes pressure the July data has not yet captured, which means a benign print tomorrow would be measuring a period that has already been overtaken. The inventory forecast is the more consequential half and cuts against a comfortable reading. Projecting commercial crude below the five-year low for the entire remainder of 2026, and cutting the 2026 stock estimate by 8.6% in a single month, removes the cushion that normally allows a supply disruption to be absorbed without price consequence. A market with buffer inventories treats a chokepoint closure as a timing problem; a market below its five-year floor treats it as a price problem. The restraint belongs on the crude path itself. The EIA’s own forecast has Brent at $85 in the current quarter falling to $69 next year, which is a resolution case, not an escalation case, and today’s $89.06 close already sits above the near-term figure. That gap means either the market is pricing more disruption than the agency assumes, or the agency’s forecast is stale relative to a situation that moved after its data cut. Neither reading is comfortable, but they point in opposite directions, and the fuel-price revisions are the part of this document that does not depend on which is right.
What to watch:Tomorrow’s July CPI energy components, and specifically the motor-fuel line — the EIA is forecasting pressure the July data will not yet show, so a soft print is not the reassurance it appears to be. Watch whether commercial crude inventories actually track toward the projected 396 million barrels in the weekly EIA reports, since the entire forecast rests on that path.
BEARISH
3. Private Payrolls Slow for a Sixth Consecutive Week — the Labour Side of the Pincer Closing on Tomorrow’s CPI
The core facts:ADP’s weekly employment tracker recorded private payrolls rising 8,300 in the week reported today, down from 15,000 the prior week and well below the four-week average of roughly 21,000 through late June — a sixth consecutive weekly deceleration. Section E carries the series and its construction in full. The market-impact layer is the subject here, and it was muted in a specific way. Front-end yields eased marginally rather than rallying: the 2-year Treasury yield fell 1.9 basis points to 4.220% and the 10-year 0.4 basis points to 4.694%, leaving the curve essentially unchanged. The dollar index was flat at 99.84, up 0.03%, and the VIX fell 1.16% to 15.28. The Federal funds target range stands at 3.50%-3.75% following the July 28-29 meeting, at which Cleveland Fed President Beth Hammack dissented in favour of a hike and subsequently argued that more than one increase would be required.
Why it matters:Six consecutive weeks of deceleration is a trend rather than a print, and it removes the interpretive escape route that any single weak labour reading offers. A payroll pace of 8,300 a week annualises to a level that does not absorb labour-force growth, and it follows Friday’s contraction of 23,000 in the monthly data — the weekly tracker is now corroborating the monthly series rather than contradicting it. In an ordinary cycle that combination would be unambiguous policy relief and the front end would rally hard. It did not. A 1.9 basis-point decline in the 2-year on a sixth straight labour deceleration is the market declining to trade it, and the reason is sitting in the two stories above this one: crude has risen five sessions running and the government’s own energy agency raised its 2026 diesel forecast 8.5% today. This is the specific configuration in which weak employment stops functioning as a dovish input. A committee facing a labour market that is shedding momentum and an energy shock propagating into refined products simultaneously is choosing between its two mandates rather than reading a single signal, and a district president with a live dissent on the record has already argued the current range is not meaningfully restrictive. Weak jobs data resolves nothing in that setting; it simply makes the choice harder and the outcome less predictable, which is why the front end sat still rather than moving. The counterweight is real and should not be dismissed. ADP’s weekly tracker is a high-frequency, heavily revised series with a well-documented tendency to overstate turning points, and six weekly observations cover a period short enough to be seasonal noise around the summer hiring trough. The monthly establishment survey remains the authority, and the next one is weeks away. The market’s non-reaction may be judgement rather than distraction.
What to watch:The 2-year yield’s reaction to tomorrow’s CPI rather than to the labour data — a print that lifts the 2-year while payroll momentum keeps deteriorating is the stagflationary signature, and it is the one configuration this market has not yet had to price. Watch whether the weekly ADP series breaks below zero, which would make a seventh-week deceleration impossible to dismiss as summer noise.
BEARISH
4. Alphabet Falls 3.84% as Roughly 300 French Publishers File an Antitrust Complaint Over AI Overviews — Communication Services Is the Day’s Worst Sector Again
The core facts:The Alliance de la Presse d’Information Générale, which represents roughly 300 French daily newspapers, filed a formal complaint with France’s Autorité de la concurrence today against Google’s AI Overviews, the AI-generated summaries that began appearing in French search results in late July. The publishers argue the feature is structurally harmful to the press sector, claiming referral traffic to their sites has already fallen between 33% and 38%, and that the practice contradicts commitments Google made in 2022 under France’s neighbouring-rights framework. Alphabet’s two share classes were among the day’s largest mega-cap decliners: GOOGL fell 3.84% to $343.80 and GOOG 3.61% to $343.00. Communication Services was the worst-performing S&P sector at -2.06%, and is also the worst over one week at -4.53% and three months at -7.53%. The standing backdrop includes 2026 capital-expenditure guidance of $195 billion to $205 billion, a $25 billion senior unsecured notes offering across ten tranches, and pending US appellate filings seeking to overturn elements of the search-monopoly remedies, including limits on default distribution payments to partners such as Apple.
Why it matters:A national competition filing by newspaper publishers would not ordinarily move a company of Alphabet’s size by nearly four percent, and treating this as a French regulatory story understates it. The claim being made is that AI Overviews cut publisher referral traffic by a third — and that figure, if it holds, describes the mechanism by which generative search destroys the economics of the open web that Google’s own index depends on. The complaint therefore lands on the strategic question the market has been asking about Alphabet all year: whether the company can transplant its search monetisation into an AI-answer format without dismantling the supply of content that makes search worth using. France is a small revenue market and the Autorité is one regulator, but the causal claim is jurisdiction-neutral. If a 33-38% traffic decline is established as fact in one proceeding, it becomes evidence in every other. The sector data says the market is treating this as structural rather than incidental. Communication Services being the worst sector today is unremarkable given Alphabet’s weight in it; being the worst over one week and three months as well is not. A sector that has lost 7.53% over three months while Technology gained 4.86% is not experiencing a rotation, it is being re-rated, and the AI-disruption thesis running through search, advertising and content distribution is the common factor. The heavy capital commitment compounds it: $195-205 billion of 2026 capex funded partly through a $25 billion debt issue is a very large bet placed into a business model whose monetisation is simultaneously under legal challenge. Restraint is warranted on process and timing. A complaint to a national competition authority initiates an investigation; it is not a finding, a remedy or a fine, and such proceedings routinely run for years. Google has settled French neighbouring-rights matters before and can plausibly do so again at a cost immaterial to a company of this scale. The publishers’ 33-38% figure is their own assertion, presented in support of their case and not yet independently established. And Alphabet retains the balance sheet, distribution and model capability that make it a credible AI winner regardless of how the traffic question resolves — the sell side remains broadly positive on precisely those grounds.
What to watch:Whether the Autorité formally opens an investigation and, more importantly, whether it accepts the 33-38% traffic-decline figure into the record — that number, not the French market, is the transferable asset in this complaint. Watch for parallel filings from publisher bodies in Germany, Italy or the United States, which would confirm this as a coordinated campaign rather than a national dispute.
UNCERTAIN
5. Intel Upsizes Its Share Sale to $20 Billion and Prices It at $95 on Roughly $100 Billion of Demand
The core facts:Intel priced an underwritten public offering of 210,526,315 common shares at $95, upsizing the deal to $20 billion from the $15 billion announced yesterday. The company reported institutional demand of approximately $100 billion, roughly five times the size of the offering. Net proceeds are put at approximately $19.7 billion before any exercise of the underwriters’ 30-day option to purchase a further 31,578,947 shares, which would add about $3 billion. The offering is expected to close tomorrow, August 12. The $95 price sits 2.6% below Monday’s $97.54 close. Proceeds are directed at the contract chip-manufacturing pivot; Intel has raised 2026 capital spending from $18 billion to roughly $20 billion, the majority of it factory tooling, and has guided to a meaningful increase again in 2027. JPMorgan, Goldman Sachs, Morgan Stanley and Citigroup are joint book-running managers.
Why it matters:Yesterday’s report treated the $15 billion announcement as a statement about the scale of Intel’s capital requirement and read the share reaction as the market pricing dilution. The execution changes half of that. A book of roughly $100 billion against a $20 billion deal — five times covered, with the company choosing to take an extra $5 billion rather than price tighter — is an emphatic institutional vote on a foundry strategy the market has spent two years doubting. Equity is the most expensive capital available and permanent dilution is a real cost, but a raise this size clearing at a 2.6% discount to the prior close is not a distressed outcome; it is a company discovering it had more access to capital than it assumed. The signal runs beyond Intel. The binding constraint on Western leading-edge capacity has been whether anyone would fund a second source at the scale required, and today the answer from institutional balance sheets was yes, in volume, at a modest concession. What keeps this uncertain is that demand for an equity offering measures appetite for the story, not the return on the tooling it buys. Intel is now committed to roughly $20 billion of 2026 capex and a meaningfully larger 2027 figure, funded by shares issued at $95 whose dilution is permanent and immediate while the capacity they finance produces nothing until 2028 at the earliest. Oversubscription tells you investors want exposure at this price; it tells you nothing about whether the foundry wins customers, hits yield targets, or earns its cost of capital. The pattern across the last two sessions is also worth holding steady: Nvidia arranging $500 billion of third-party financing for its customers on Monday, Intel raising $20 billion of equity today. The semiconductor complex is sourcing extraordinary quantities of external capital in a compressed window, and the market has begun pricing the cost of closing that funding gap alongside the revenue on the other side of it.
What to watch:Whether the underwriters exercise the 31,578,947-share option in full within the 30-day window — full exercise would take the raise past $23 billion and confirm demand exceeded even the upsized book. Watch how INTC trades against the $95 offer price over the coming sessions, since sustained trading below it would mean the book was priced to clear rather than genuinely oversubscribed.
— Quantifying recession risk so you don’t have to guess. Apply for membership at join.recessionalert.comD. MODERATE-IMPACT STORIES -> TOP
UNCERTAIN
6. The API Reports a 9.07 Million Barrel Crude Build Against Expectations for a Draw — the Inventory Data Contradicts the Supply-Shock Tape
The core facts:The American Petroleum Institute reported at 4:30 PM ET today that US crude inventories rose 9.072 million barrels in the week ended August 8, against a consensus expectation of a 0.50 million barrel draw. That is a miss of roughly 9.6 million barrels versus expectations, and it follows the prior week’s build of 2.69 million barrels — a second consecutive weekly accumulation. The release landed after the close, so it did not move today’s session. Crude had risen for five straight sessions into it, with WTI settling at $83.34 and Brent at $89.06. The EIA’s official Weekly Petroleum Status Report follows tomorrow, August 12, and is the first authoritative inventory read since Hormuz transit volumes collapsed.
Why it matters:A build of this size is the opposite of what a supply-shock tape prices, and it is the single cleanest fresh datapoint against the day’s dominant narrative. Two consecutive builds totalling nearly twelve million barrels, in a week when the world’s most important chokepoint handled six vessels, cannot be explained by supply availability — the barrels are arriving. That points the question toward demand, and a demand-side explanation would reframe the entire energy complex: a market bidding crude on supply fear while inventories accumulate is one where consumption is weakening underneath the price. Read alongside a sixth straight week of decelerating private payrolls, the two datapoints describe the same economy from different angles. The tension with the EIA’s Short-Term Energy Outlook, published the same day, is direct and unresolved. The agency forecasts commercial crude inventories below the five-year low through the end of 2026 and cut its 2026 stock estimate 8.6%; the API has just reported the second consecutive weekly build. Both cannot describe the same trajectory, and one of them will be revised. Two constraints matter before drawing conclusions. The API series is an industry survey based on voluntary reporting and it diverges from the official EIA figures with some regularity, occasionally by wide margins — it is a directional indicator, not an authority, and tomorrow’s official print is the one that counts. A single week’s build can also reflect timing artefacts in cargo arrivals, refinery maintenance schedules or SPR-related flows rather than any change in underlying balance. The market’s own verdict is not yet in, since the data arrived after the close.
What to watch:Tomorrow’s EIA Weekly Petroleum Status Report — confirmation of a build near 9 million barrels would break the five-session crude rally and shift the story from supply to demand. Watch the crude curve’s front spread rather than the flat price, since a build of this size should flatten or invert the prompt structure if it is real.
BULLISH
7. Chip Equipment and Power Names Rally While AI Platforms Sell Off — the Market Splits the AI Trade in Two
The core facts:Four of the five largest mega-cap gainers were AI-infrastructure names on a down day: KLA rose 4.01% to $200.47, Arista Networks 3.31% to $197.85, GE Vernova 2.12% to $1,011.88 and Lam Research 1.64% to $311.41. Cantor Fitzgerald raised its KLA price target to $325 from $250 with an Overweight rating, citing a durable AI-driven semiconductor-equipment upcycle, and Barclays flagged a hotter-than-expected wafer-fab-equipment capital-spending cycle running through 2027 and 2028. Arista extended a post-earnings rally after second-quarter revenue and third-quarter guidance topped consensus. The decliners were the other half of the AI complex: Alphabet fell 3.84%, Dell Technologies 3.69% and Oracle 3.69%. At sector level the split was equally clean — Technology closed up 0.13% while Communication Services fell 2.06%.
Why it matters:For most of this cycle the AI trade has moved as a single instrument — everything from foundries to hyperscalers to software rose and fell together on the same headlines. Today it did not, and the dividing line was clean enough to be informative. What rallied sells equipment, networking and power generation into the buildout and gets paid on capital expenditure regardless of what that capital eventually earns. What fell monetises AI at the far end, where the returns are contested, the regulatory exposure is accumulating and the capex is a cost rather than a revenue line. That the split held across two sectors, with Technology green and Communication Services down two percent on the same session, indicates positioning rather than noise. The mechanism connecting today’s winners to the rest of this report is direct: Intel raised $20 billion for tooling, Alphabet is committed to $195-205 billion of 2026 capex, and $15.6 billion of multi-decade data-centre leases were signed in this same session. Every one of those commitments is revenue for KLA, Lam and GE Vernova, and every one is a cost or a dilution for the platform that makes it. Buying the toll road rather than the destination is a coherent response to a market that has grown uncertain about terminal AI economics while remaining confident about near-term construction. The case against extrapolating is that this is precisely the trade that works until capital expenditure is cut, at which point the picks-and-shovels names carry more downside than the platforms because their revenue is the capex line itself. Cantor’s and Barclays’ upgrades rest on a wafer-fab-equipment cycle forecast to run through 2027-2028 — a two-to-three-year projection of spending by customers who are currently funding that spending through equity issues, debt offerings and third-party financing platforms. If the funding conditions tighten, equipment orders are the first line to move, and today’s leadership becomes tomorrow’s concentration risk.
What to watch:Applied Materials’ results on Thursday, August 13 — the sector’s cleanest read on whether the wafer-fab-equipment upcycle Cantor and Barclays are underwriting is showing up in bookings rather than forecasts. Watch whether the Technology-versus-Communication-Services divergence persists for a third session, which would confirm a positioning shift rather than a single day’s rotation.
UNCERTAIN
8. Norway’s $2.3 Trillion Wealth Fund Discloses a $1.22 Billion SpaceX Stake as the Stock Falls 3.93% Into an August 20 Unlock
The core facts:Norges Bank Investment Management, the $2.3 trillion Norwegian sovereign wealth fund and the world’s largest single equity investor, disclosed today that it held 0.05% of SpaceX worth $1.22 billion as of June 30. The scale is best read against the fund’s other technology positions: 1.28% of Nvidia worth $62 billion, 1.24% of Apple worth $52 billion and 1.17% of Alphabet worth $50 billion, against an average holding of roughly 1.5% of every listed company globally. SpaceX fell 3.93% today to $133.29, unwinding part of an Argus-upgrade-driven rally. Monday’s close of $138.74 had been the stock’s first finish above its $135 IPO price, following a drawdown of more than 50% from its post-listing high. A share unlock on August 20 will release 320 million shares, equivalent to more than three typical days’ trading volume.
Why it matters:The disclosure is the trigger even though the holding dates to June 30, and the two facts pull in opposite directions on the same day. Norges Bank’s participation confers a particular kind of legitimacy — it is an index-driven, mandate-constrained institution that does not take speculative positions, and its presence on the register signals that SpaceX has become a name large institutions hold as a matter of course rather than conviction. But the comparative arithmetic is the more honest reading and it is unflattering: 0.05% against a global average of 1.5% is a toe-hold roughly thirty times lighter than the fund’s typical weighting, and two orders of magnitude below its Nvidia and Apple positions. Framed as an endorsement this is thin; framed as a first step it is more interesting, because sovereign funds build positions gradually and a June 30 snapshot is already six weeks stale. The near-term price question is mechanical rather than fundamental. A stock that has spent its post-listing life more than 50% below its high, reclaimed its IPO price for exactly one session, and now faces 320 million shares becoming free to trade on August 20 has a supply problem that no institutional disclosure offsets. Today’s 3.93% decline on no company-specific news is the market beginning to position for that, and the fading of the Argus-upgrade rally shows how little conviction is holding the recent bid. What makes this genuinely uncertain rather than simply negative is that unlock overhangs are the most widely anticipated events in equity markets and are frequently discounted well before the date; a clean absorption on August 20 would remove the last structural argument against the stock and leave it trading on operations for the first time.
What to watch:Volume and price action on August 20 relative to the $135 IPO price — absorbing 320 million shares without breaking that level would be the clearest bullish signal the stock has produced since listing. Watch Norges Bank’s next quarterly disclosure for whether the 0.05% position was added to after June 30, which is what would convert a toe-hold into a signal.
BULLISH
9. Spotify Will Badge AI-Generated Artist Identities and Cut Them Out of Recommendations
The core facts:Spotify announced today that artists can begin self-disclosing an “AI Persona” through Spotify for Artists immediately, with the visible badges rolling out from mid-September on profile banners and About sections, in search results, and on track rows across playlists. Spotify will additionally review profiles itself and flag those presenting photorealistic AI-generated identities, with an appeals process for artists who believe they have been mislabelled. The decision that carries the commercial weight is separate from the labelling: Spotify will not recommend AI Persona tracks in personalised playlists unless a listener explicitly opts in. Two distinctions are load-bearing — the badge attaches to the artist’s identity rather than to the music, and a human artist using AI production tools requires no badge. Separately, Phillip Securities upgraded Spotify to Buy from Neutral with a $650 price target.
Why it matters:The recommendation exclusion is the story and the badging is the packaging. On a platform where personalised playlists drive the overwhelming majority of discovery, removing a category of content from algorithmic recommendation is a decision about who gets paid, not a decision about disclosure. Spotify has effectively created a two-tier royalty pool in which fully synthetic acts must be sought out deliberately while human artists retain access to the discovery engine — and it has done so unilaterally, without waiting for legislation or a licensing negotiation. That is the first substantive answer any major platform has given to the flood of AI-generated tracks that has been diluting per-stream payouts, and it protects the economics of the label relationships that Spotify’s content costs depend on. Positioning the rule around artist identity rather than production method is the choice that makes it workable: policing whether AI touched a recording is impossible at catalogue scale, while policing whether a fictitious persona is being presented as a real performer is tractable and defensible. Applying it to search and playlist track rows as well as profiles means the disclosure travels with the content rather than sitting on a page nobody visits. Two limits deserve weight. This is self-disclosure first and platform review second, and the enforcement burden of identifying photorealistic AI personas across tens of millions of uploads is substantial and unproven — the policy is only as good as the detection behind it, which has not been demonstrated. Nothing visible changes until mid-September, so the near-term revenue effect is nil. And a platform that decides which artists its algorithm will surface has taken on an editorial role that invites exactly the regulatory attention Alphabet is receiving elsewhere in this report; the appeals process exists because Spotify anticipates disputes about who gets classified into the lower tier.
What to watch:Whether the major labels publicly endorse the recommendation exclusion — their support would make it a de facto industry standard, and their silence would suggest they see it as insufficient. Watch the mid-September rollout for how many profiles Spotify flags on its own initiative versus how many self-disclose, which is the only real measure of whether the detection works.
BULLISH
10. $15.6 Billion of Multi-Decade AI Data-Centre Leases Signed in a Single Session
The core facts:Two long-dated AI data-centre leases were announced today. Fermi rose roughly 22% on a 15-year agreement with TensorWave worth $6.5 billion for a 222 megawatt facility, with expansion rights above 650 megawatts. Riot Platforms rose roughly 12% on a 20-year, 191 megawatt lease valued at $9.10 billion, disclosed alongside second-quarter revenue up 14% year on year to $174.2 million. Together the two contracts commit $15.6 billion of compute capacity on 15- and 20-year terms. In a related read on the same power-demand theme, Babcock & Wilcox rose roughly 20% on an agreement with Siemens Energy for 20 steam turbine generator sets totalling one gigawatt of capacity. Both lessors sit below the $25 billion market-capitalisation threshold; GE Vernova, the large-cap expression of the same trade, rose 2.12% to $1,011.88.
Why it matters:Contract duration is the variable that carries the information here, not the headline value. A 20-year lease is a counterparty’s statement that it expects to need this capacity two decades out, and it is a materially harder commitment than a purchase order, a memorandum of understanding or a capital-expenditure guide — all of which can be revised at the next quarterly call. Fifteen and twenty-year terms signed on the same day, totalling $15.6 billion, are the strongest available evidence that the demand side of the AI buildout believes its own forecasts. That matters specifically because the two most prominent AI headlines of the past two sessions were both about funding difficulty rather than demand: Nvidia organising $500 billion of third-party capital for its customers on Monday and Intel selling $20 billion of equity today. These leases address the question those events raised and answer it in the affirmative — the compute is being contracted for, at length. The megawatt figures also locate the real bottleneck. Combined, the two facilities represent 413 megawatts, and Babcock & Wilcox’s turbine order adds a gigawatt of generating capacity into the same theme. Power, not silicon, is what these contracts are actually securing, which is why the capital is flowing toward whoever controls interconnection and generation. Riot’s presence on the lessor side is its own signal: a bitcoin miner converting to AI landlord is arbitraging the fact that its most valuable asset was never the mining hardware but the grid connection underneath it. The restraint is that the counterparties are small. TensorWave is a private AI-cloud operator and neither lessor is an investment-grade credit, so a twenty-year contract is only as durable as the tenant’s ability to pay through a downturn — and the AI-cloud sector’s ability to fund itself is the exact thing under question. Twenty-year commitments from thinly capitalised counterparties have a long history of being renegotiated. The dollar figures are also contract values across the full term, not revenue in hand.
What to watch:Whether any of these leases carries a parent guarantee or prepayment structure when the filings appear — an unsecured 20-year obligation from a private AI cloud is worth a fraction of a guaranteed one. Watch credit spreads on AI-cloud and data-centre issuers, which price the tenant-credit question these headline values do not.
BEARISH
11. The Sell Side Reprices the Consumer — Barclays Cuts Three Names in One Session as a Guidance-Cut Cluster Lands the Same Day
The core facts:Consumer-facing names took a coordinated round of sell-side cuts today. Barclays downgraded Under Armour to Underweight with a $5 target and Gap to Equal Weight from Overweight, while moving Abercrombie & Fitch up only to Equal Weight from Underweight with a $114 target — three consumer decisions from one house in a single session. Phillip Securities cut Airbnb to Reduce from Neutral, and Citigroup cut Allstate to Sell from Neutral. The same day produced a cluster of full-year guidance reductions from smaller consumer names: On Holding fell roughly 18% after growing second-quarter revenue 21.6% against its own 23-24% projection and revising full-year guidance to low-20s growth; Purple Innovation fell roughly 23% after cutting 2026 guidance to $420-440 million from $465-485 million, explicitly citing industry softness; and OppFi fell roughly 18% on a revenue forecast cut to $600-625 million. None of these names clears $25 billion. At sector level Consumer Cyclical fell 0.59% and is the worst-performing S&P sector year to date at -1.09%; Consumer Defensive fell 0.32%.
Why it matters:No individual name here is large enough to matter to a US large-cap portfolio, which is exactly why the clustering is the signal. Analysts and managements do not coordinate, and when a single house cuts three consumer names on the same morning that three unrelated consumer companies independently reduce full-year outlooks, the common input is the underlying spending data rather than any company-specific development. Two of the three guidance cuts cited demand or industry softness rather than costs — a distinction that matters, because a margin problem is a company’s to solve while a demand problem belongs to the economy. The composition points at discretionary spending specifically: athletic footwear, apparel retail, home furnishings, travel platforms and subprime consumer credit. That is the part of the wallet that moves first when households tighten, and it is moving. The read-through connects to the macro stories above this one. Private payrolls have decelerated for six consecutive weeks, and the EIA today raised its 2026 gasoline forecast 5.9% and diesel 8.5% — softening income growth meeting rising energy costs is the standard mechanism by which discretionary categories get squeezed, and these companies are reporting the early evidence of it. Consumer Cyclical being the worst S&P sector year to date at -1.09% while the index sits near record highs says this is a persistent divergence rather than a fresh one. The counterweight is genuine. NFIB small-business optimism printed an eleven-month high today on improved hiring plans, which is not the reading of an economy losing consumer momentum, and small caps closed green while large caps fell. Sub-$25 billion companies also have idiosyncratic problems — On Holding still grew revenue 21.6%, a rate most retailers would take, and missing one’s own aggressive projection is not the same as demand collapsing. A single session’s downgrades can reflect one strategist’s revision cycle rather than an inflection.
What to watch:Home Depot’s results on August 18 — a genuine mega-cap read on discretionary and big-ticket household spending, and the test of whether this cluster generalises above $25 billion. Watch July retail sales for whether the control group corroborates what these guidance cuts are describing.
BULLISH
12. Small-Business Optimism Hits an Eleven-Month High as Small Caps Decouple From the Mega-Cap Tape for a Second Session
The core facts:The NFIB Small Business Optimism Index rose to 99.8 in July against expectations of 97.5, its highest reading since August 2025, driven by improved hiring plans; Section E carries the index and its components in full. The market response is the subject here. The Russell 2000 rose 0.36% to 3,028.38 and the NYSE Composite 0.07% to 24,685.57, while every large-cap benchmark fell — the S&P 500 down 0.32%, the Dow 0.34% and the Nasdaq 100 0.33%. That is the second consecutive session in which small caps have held green against a declining mega-cap tape. The Financial sector, the usual regional-bank transmission channel for small-business sentiment, was close to flat at -0.15%.
Why it matters:Small caps outperforming on a risk-off day is unusual enough to be worth isolating, because the Russell normally amplifies large-cap weakness rather than resisting it. Two consecutive sessions of it, on a day when the sentiment data underpinning domestic small business beat by more than two points, suggests a genuine rotation into domestically-oriented earnings rather than a statistical artefact. The logic is coherent: the specific pressures weighing on the mega-cap complex today — Alphabet’s regulatory exposure, the AI capital-intensity question, energy costs feeding through global supply chains — are disproportionately large-company problems. A domestically-focused small-cap with no AI capex programme, no European antitrust exposure and no dollar translation risk is genuinely insulated from most of what moved the index. Improved hiring plans in the NFIB survey matter more than the headline number in that context, because hiring intentions are the component that reflects what business owners expect rather than what they have already experienced. There is a real tension with the story two entries above. Six consecutive weeks of decelerating private payrolls and a cluster of consumer guidance cuts describe an economy losing momentum; small-business owners reporting their best sentiment in eleven months and planning to hire describe one gaining it. Both readings are current and both are from credible sources. The likeliest reconciliation is that they measure different things — the NFIB is a sentiment survey capturing expectations, while ADP counts actual hires — and sentiment has led hiring in both directions before without always being right about it. The Financial sector’s flat close is the detail that argues for caution: if small-business conditions were genuinely inflecting, regional-bank lending exposure would normally register it, and it did not.
What to watch:Whether the Russell 2000 holds green for a third consecutive session against a falling S&P — that would move this from divergence to rotation. Watch whether the NFIB hiring-plans component translates into the actual weekly ADP series over the next month, which is the test of whether small-business optimism is forecasting or merely feeling.
UNCERTAIN
13. Deutsche Bank Warns Markets Are Priced for a Near-Perfect Landing — on a Day Recession Odds Fell Almost Everywhere Else
The core facts:Deutsche Bank macro strategist Henry Allen warned today that equities are priced for a near-perfect economic landing with almost no room for error, citing a disconnect between buoyant valuations and the limited Fed easing currently priced into rates. The warning arrived on a day when forecaster recession probabilities moved the other way across the board: RSM US cut its twelve-month recession probability to 30% from 40%, against US Bank at 25%, the New York Fed’s yield-curve model at 15.2% and Polymarket at 8%, with Moody’s the outlier near 50%. Section E carries the forecaster models and their construction. The market-impact layer is the more revealing part. Despite equities falling across every large-cap benchmark, the VIX fell 1.16% to 15.28, the dollar index was flat at 99.84 and both the 10-year and 2-year Treasury yields eased marginally, by 0.4 and 1.9 basis points respectively.
Why it matters:The tape corroborated the warning on the same day it was issued, which is the reason this deserves attention beyond the usual weight given to a strategist note. Volatility declining while equities fall is the specific signature of a market that is not hedging its downside — it means the decline was absorbed as ordinary drift rather than treated as the beginning of something, and that no one paid up for protection into a CPI print with a live policy debate attached to it. A VIX of 15.28 on the eve of the highest-leverage scheduled event of the week, with crude up five sessions running and a district Fed president arguing publicly for multiple rate increases, is close to a literal illustration of what Allen described. The forecaster models compound rather than resolve it: a broad multi-model move toward lower recession probability, with the median sitting in the 15-30% range, is precisely the consensus comfort that leaves no room for error if the data disappoints. The competing readings inside this report are the substance of the disagreement. A sixth consecutive week of decelerating payrolls and a consumer guidance-cut cluster support the caution; an eleven-month high in small-business optimism, easing recession odds and $15.6 billion of twenty-year compute commitments support the complacency. The honest position is that the distribution of outcomes has widened at both ends while the market has priced the middle. What argues against acting on this is that near-perfect-landing warnings are among the most frequently issued and least well-timed calls in the strategist repertoire — they have been made repeatedly through this cycle, and the market has been right to ignore them so far. A low VIX is also a description of realised conditions, not a forecast; volatility has been structurally suppressed for months and reading each quiet session as accumulating fragility has been a losing position all year.
What to watch:The VIX reaction to tomorrow’s CPI rather than the equity reaction — a large volatility repricing off a 15.28 base would confirm the market was carrying no protection into the print. Watch whether other strategists follow Deutsche Bank within the week, since a cluster of caution notes is what typically precedes an actual positioning shift.
— Separating signal from noise since 2007. Apply for membership at join.recessionalert.comE. ECONOMY WATCH -> TOP
Tuesday’s data reinforced a resilient-but-narrowing picture: small-business optimism jumped to an 11-month high and household debt metrics improved, while ADP’s weekly tracker showed private hiring decelerating for a sixth straight week. Existing home sales confirmed housing’s holding pattern — volume down 1.7%, prices still climbing — as mortgage rates near 6.7% cap transactions. Recession odds continued easing across forecaster models (RSM to 30% from 40%, Polymarket at 8%), yet Deutsche Bank cautioned that equities are pricing a “near-perfect landing” with no room for error. Tomorrow’s CPI print is the next test of that thesis.
NFIB Small Business Optimism Index Surges to 99.8, Highest Since August 2025 (NFIB, August 11, 2026)
What they’re saying:The NFIB Small Business Optimism Index rose 2.4 points to 99.8 in July, topping its 52-year average of 98.0 and beating consensus estimates of 97.5. Eight of ten index components improved, with hiring plans the largest single driver; the Small Business Employment Index rose to 102.1, snapping four consecutive months of decline.
The context:The reading is the strongest since August 2025 and signals small-business owners are looking past tariff and rate uncertainty to plan for expansion. The Uncertainty Index still rose 2 points to 91 — well above its historical average of 68 — showing owners remain cautious even as near-term sentiment brightens.
What to watch:The August NFIB survey, due mid-September, for confirmation the hiring-plans rebound persists.
ADP Weekly Private Payrolls Slow for a Sixth Straight Week (ADP, August 11, 2026)
What they’re saying:ADP’s weekly employment tracker showed private payrolls rising by just 8,300 in the week reported August 11, down from an already-soft 15,000 the prior week and less than half the 21,000 four-week average recorded through late June.
The context:Six consecutive weeks of deceleration point to a genuine cooling in private hiring rather than noise in a single print, reinforcing the broader labor-market softening flagged by July’s nonfarm payrolls report. A prolonged slowdown in weekly hiring typically pressures consumer spending and strengthens the case for further Fed easing.
What to watch:The next ADP National Employment Report and weekly initial jobless claims for confirmation of the trend.
Existing Home Sales Slip 1.7% in July as High Rates, Record Prices Squeeze Buyers (NAR, August 11, 2026)
What they’re saying:Existing home sales fell 1.7% month-over-month in July to a seasonally adjusted annual rate of 4.05 million units, essentially in line with consensus near 4.06 million but down from June’s 4.13 million pace. The median sales price rose 2.0% year-over-year to $434,100 — the 37th straight month of annual price gains.
The context:NAR chief economist Lawrence Yun called sales “remarkably stable” given the elevated mortgage-rate backdrop, noting year-to-date sales are still up 2.4%. The combination of falling volume and persistently rising prices reflects tight inventory (4.6 months’ supply) rather than outright housing-market stress, but it keeps affordability a binding constraint on activity.
What to watch:August existing home sales (due mid-September) and the path of 30-year mortgage rates, currently near 6.7%-6.8%.
US Household Debt Edges Down in Q2 as Delinquencies Improve (NY Fed, August 11, 2026)
What they’re saying:Total US household debt fell $13 billion (-0.1%) to $18.8 trillion in Q2 2026, per the NY Fed’s Quarterly Report on Household Debt and Credit. Aggregate delinquency rates improved slightly to 4.7% of outstanding debt, with early-stage delinquencies for non-housing debt leveling out.
The context:The modest pullback in balances alongside improving delinquency trends suggests household balance sheets remain resilient even as mortgage balances ($13.1T) hold near record highs and HELOC balances rose to $459B. It is an incrementally reassuring data point for consumer-spending durability heading into the second half.
What to watch:The Q3 2026 Household Debt and Credit Report, due November 2026, plus monthly consumer-credit and delinquency data in the interim.
Recession Odds Continue to Ease Across Forecaster Models (RSM/Multiple, August 10-11, 2026)
What they’re saying:RSM US cut its 12-month recession probability to 30% from a prior 40%, joining a broader moderation across models: Polymarket’s implied odds sit at just 8%, US Bank’s stands at 25%, and the NY Fed’s yield-curve model shows 15.2% — down markedly from the elevated readings seen earlier this year.
The context:The convergence toward lower recession odds reflects steadier Q2 GDP growth (1.5% annualized), a still-solid 4.2%-4.3% unemployment rate, and moderating inflation, easing the stagflation narrative that dominated forecaster commentary earlier this year. Moody’s remains the outlier near 50%, underscoring genuine model disagreement rather than consensus.
What to watch:Whether Wednesday’s CPI (Aug 12) and Thursday’s PPI (Aug 13) prints validate the moderating narrative or reopen inflation-driven recession concerns.
Deutsche Bank Warns Markets Are Pricing a “Near-Perfect Landing” With No Room for Error (Deutsche Bank, August 11, 2026)
What they’re saying:Deutsche Bank macro strategist Henry Allen warned that equity markets are pricing in a near-perfect economic landing, leaving investors almost no margin for disappointment. He flagged a disconnect between buoyant equity valuations and the limited additional Fed easing currently priced into rates markets.
The context:The warning lands alongside today’s broadly resilient data (the NFIB beat, easing recession odds) — the tension is that constructive fundamentals are already fully priced, so any negative surprise, an inflation upside miss or a labor-market air pocket, could trigger an outsized market reaction.
What to watch:Wednesday’s CPI print (Aug 12) as the next test of how much “no room for error” markets actually have.
— Know the probability before the market prices in the risk. Apply for membership at join.recessionalert.comF. EARNINGS WATCH -> TOP
YESTERDAY AFTER THE BELL (Markets Reacted Today)
No major earnings yesterday after the bell from companies with >$100B market cap.
TODAY BEFORE THE BELL (Markets Already Reacted)
No major earnings before the bell from companies with >$100B market cap.
TODAY AFTER THE BELL (Markets React Tomorrow)
No major earnings after the bell from companies with >$100B market cap.
WEEK AHEAD PREVIEW:
Q2 2026 earnings season is 88% complete, and today’s calendar carried no reporter above $100 billion in market capitalisation — the largest name on the tape was $74.6 billion. The remaining mega-cap reporters are concentrated in the AI-infrastructure complex, which makes them a direct test of the wafer-fab-equipment and networking upcycle that led today’s gainers.
Cisco Systems (CSCO) — AMC, Wednesday, August 12 — Consensus $1.17 EPS on $16.84 billion of revenue. Key focus: AI-infrastructure order growth and the size of the backlog converting into revenue, webscale customer concentration, and whether networking demand is tracking the same trajectory that lifted Arista 3.31% today on its own beat and raise. Security-segment growth following the Splunk integration remains the second line to watch.
Applied Materials (AMAT) — AMC, Thursday, August 13 — Key focus: the cleanest read available on whether the AI-driven wafer-fab-equipment cycle that Cantor Fitzgerald and Barclays underwrote today with target increases through 2027-2028 is showing up in bookings rather than forecasts. Watch China revenue exposure and export-control commentary, plus advanced-packaging capacity, which is the binding constraint on hyperscaler custom-silicon programmes.
Deere & Co (DE) — BMO, Thursday, August 20 — Date corrected: the company has confirmed its fiscal third-quarter call for the morning of August 20, not August 13 or 14 as earlier calendar sources indicated. Key focus: large-agriculture equipment demand against soft farm incomes, the trajectory of order books into fiscal 2027, and dealer inventory levels. Rising diesel forecasts — the EIA lifted its 2026 projection 8.5% today — feed directly into farm operating costs and equipment replacement decisions.
Q3 2026 earnings season begins in mid-October.
— US market commentary trusted by family offices and institutions. Apply for membership at join.recessionalert.comG. WHAT’S NEXT -> TOP
UPCOMING RELEASES:
| Date | Event | Why It Matters |
|---|---|---|
| Wed, Aug 12 | CPI / Core CPI (Jul) — Core CPI MoM expected 0.2%, Core CPI YoY expected 2.5% vs 2.6% prior | The highest-leverage release of the week and the event the entire tape is positioned into. A cooler core print validates the easing recession odds and the market’s near-perfect-landing pricing; an upside miss lands on a market carrying almost no protection, with the VIX at 15.28. Note the timing trap — July data predates both the Hormuz transit collapse and the EIA’s raised fuel forecasts, so a soft print measures a period already overtaken. |
| Wed, Aug 12 | Monthly Budget Statement (Jul) — expected -$346bn vs -$120bn prior | A near-tripling of the monthly deficit feeds directly into Treasury issuance expectations at the long end. With the 10-year at 4.694% and the curve essentially unchanged on a sixth straight week of labour deceleration, supply is one of the few remaining variables that can steepen the curve independently of the Fed. |
| Thu, Aug 13 | PPI (Jul) — headline MoM expected 0.2% vs -0.3% prior; Core PPI expected 0.3%; PPI YoY expected 4.9% vs 5.5% prior | The producer-side confirmation of whether energy is propagating into the pipeline. A swing from -0.3% to +0.2% at the headline is the line to watch given diesel’s role as a freight, agriculture and construction input — PPI captures the pass-through before CPI does, making this the better early read on the EIA’s 8.5% forecast revision. |
| Thu, Aug 13 | Initial Jobless Claims (expected 202K vs 199K prior) and Continuing Claims (expected 1,800K vs 1,801K prior) | The weekly cross-check on ADP’s sixth consecutive payroll deceleration. Claims have stayed near 200K throughout, which is the strongest argument that the ADP weekly series is overstating a turning point; a break above 210K would remove that defence and make the hiring slowdown much harder to dismiss as summer noise. |
| Thu, Aug 13 | Fed speakers — Hammack and Barkin | Hammack dissented in favour of a hike at the July 28-29 meeting and has argued more than one increase is needed; her remarks land the day after CPI and are the clearest available read on whether the hawkish bloc grows or stays isolated. Barkin provides the contrast from the centre of the committee. |
KEY QUESTIONS:
1. If July CPI prints benign but the EIA has just raised its 2026 diesel forecast 8.5% and gasoline 5.9%, does the market treat the print as resolution or as a measurement of a period already overtaken by five sessions of crude gains?
2. What happens to the front end if CPI lifts the 2-year while private payrolls decelerate for a seventh week — the stagflationary configuration that leaves the Fed choosing between mandates rather than reading a single signal?
3. Does tomorrow’s official EIA inventory report confirm the API’s 9.07mn barrel build, and if it does, does the five-session crude rally break on a demand problem rather than resolving on a supply one?
— US market commentary trusted by family offices and institutions. Apply for membership at join.recessionalert.comH. CHART OF THE DAY -> TOP
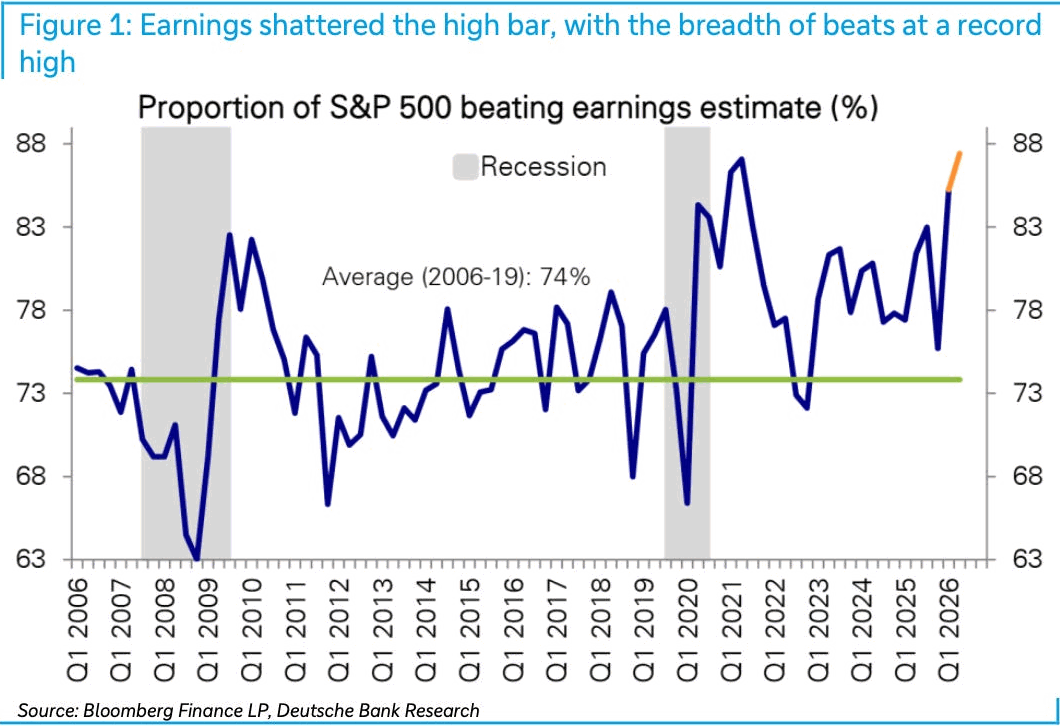
The bar went up, and they cleared it anyway. Every high beat rate you have ever been shown carries the same asterisk — analysts marked estimates down into the quarter, management stepped over a bar lowered on their behalf, and the beat was manufactured. That asterisk is unavailable here: the Q2 bottom-up estimate rose 3.4% during the quarter to $81.54 from $78.84, against a five-year norm of -2.0%, the largest in-quarter increase in five years and the second consecutive one. The raise was narrow — Energy +61.5%, Information Technology +8.7% — while the breadth came from nine other sectors facing a roughly unchanged hurdle. That breadth is also the only clean instrument left, because a beat counts once whether it clears by a penny or by six dollars: FactSet’s record +29.2% aggregate surprise collapses to +10.9% without Alphabet’s $98 billion of other income and Amazon’s $53.4 billion, mostly unrealized marks on private AI stakes booked as GAAP EPS. No pair of outliers moves a headcount. But at 86% against a ten-year average of 76%, beating is the base case, and the surprise premium is spent — the one company in eight that misses now carries the season’s entire information content. Saturation has a precedent: Q2 2021 printed 87%, five months before the top. Watch the revisions, not the beats: Q3 already asks 27.4%. The next disappointment arrives not because companies got worse, but because the bar finally outran them.
What it means: holding a single name through its Q3 print now pays nothing for the expected beat and everything for the miss. That skew argues for index-level earnings exposure until analysts resume cutting into the quarter.
Market Intelligence Brief (MIB) Ver. 18.59
For professional investors only. Not investment advice.
© 2026 RecessionALERT.com

Comments are closed.