
MIB WEEKLY DIGEST
Week of Aug 3–7, 2026
The S&P 500 closed at a record 7,757.46, up 3.57% on the week, after July payrolls contracted 23,000 against an +83,000 consensus and priced a September rate hike out of the front end — over the objections of five Fed officials who spent four sessions arguing for one. Crude round-tripped 8.8% lower as a Hormuz reopening was priced, unpriced on Iran’s restrictive transit draft, then repriced, leaving Energy down 3.66% with the strait still shut. Palantir surged 39.78% on 93% revenue growth; AMD beat on every line and fell 7% on its capex. Gold added 8.61% while copper managed 1.00%.
TABLE OF CONTENTS
A. WEEK AT A GLANCE
B. WEEK IN MARKETS
C. WEEK’S TOP STORIES (9)
D. WEEK IN THE ECONOMY (5)
E. WEEK IN EARNINGS (3)
F. NEXT WEEK SETUP
G. CHART OF THE WEEK
A. WEEK AT A GLANCE -> TOP
The S&P 500 gained 3.57% on the week to a record 7,757.46, with the Nasdaq 100 up 5.12% and every major average finishing green. The driver rotated daily but never left one axis: a Strait of Hormuz reopening was priced, unpriced and repriced across four sessions, and then a July payroll contraction of 23,000 removed a September rate hike from the front end on Friday and delivered the record. The defining feature of the week is that both of its dominant inputs — an unsigned Middle East arrangement and a labour market shedding jobs — were read by the market as relief rather than as risk.
• Every index finished green, led by growth — Nasdaq 100 +5.12% to 29,722.30, S&P 500 +3.57% to a record 7,757.46, Russell 2000 +3.46%, Dow +2.95%. The NYSE Composite’s +2.02% was half the S&P’s: the broad tape participated without ever leading.
• Payrolls contracted 23,000 against an +83,000 consensus — the first negative print in months, with participation falling to 61.4% and wage growth slowing to 3.2%, the weakest since May 2021. September hike odds fell from roughly 67% to 40%.
• Palantir was the week’s biggest mover at +39.78% on 93% revenue growth, 149% US commercial growth and a $500 million guidance raise. SpaceX added 22.83% while absorbing a $100 billion lock-up that more than doubled its float.
• Gold rose 8.61% to $4,398.87 and silver 9.63% while copper managed 1.00% — and copper actually fell 1.87% on Friday as the others surged. The monetary and industrial metals took opposite sides of the same payroll print.
• Crude round-tripped and still lost 8.8% — WTI to $77.15 on a Hormuz reopening trade that survived Iran’s restrictive transit draft and a Houthi tanker strike. Energy fell 3.66%, the only sector to lose more than 1% on Friday’s record day, while still leading the index at +28.61% YTD.
• Eli Lilly delivered the season’s largest guidance raise — revenue up 48% to $22.97 billion, EPS beating by 35.86%, and full-year revenue guidance lifted $3 billion to $85–$87 billion. At the other end, AppLovin missed EPS by roughly 11% and lost a fifth of its market value.
1. The market outvoted the Fed, in public, for four straight sessions — Williams, Paulson, Kashkari, Cook and Musalem each argued for tightening between Monday and Thursday, rising in seniority as the week went on, and the priced probability of a September hike fell every single day regardless; Polymarket’s 2026 hike contract dropped 12 points to 55% and recession odds five points to 8%. The market had decided the argument would be settled by data the committee had not yet seen, and Friday handed it exactly that.
2. Capital intensity replaced growth as the AI discriminator — the week separated companies that capture AI spending from those that must buy capacity to serve it, and priced them oppositely: Arista at a 49.9% operating margin, Cloudflare raising both guidance lines and Microsoft booking Azure consumption all held or gained, while AMD, SpaceX and the storage complex were marked down on the cash-flow statement despite beating on the income statement. Demand was never the variable; conversion is.
3. A beat stopped being information — with the season 88% reported at an 86% EPS beat rate and +50.4% blended growth, four companies in unrelated industries beat and raised this week and were sold or ignored for four different reasons: AMD on capex, Sandisk on positioning after a 500% run, Western Digital for guiding continuation rather than acceleration, and Howmet Aerospace — 24% revenue growth, 250 bp of margin expansion, guidance above consensus — closing down 0.58%. When almost everyone beats, the bar is set by the multiple rather than by consensus.
 — Leading economic indicators. Accurate market forecasts. Apply for membership at join.recessionalert.com
B. WEEK IN MARKETS -> TOP
Two catalysts pulled the tape in opposite directions all week and a third settled it. Monday through Wednesday the market traded a Strait of Hormuz reopening — Trump standing down from strikes, Bessent putting a deal at “today or tomorrow” — draining the war premium out of crude, until Iran published a restrictive transit draft on Thursday and put it straight back. Friday’s 23,000-job payroll contraction resolved the argument by removing the September hike from the front end, and the S&P 500 closed at a record. Participation was wide but the leadership rotated almost daily: semiconductors Tuesday, healthcare Wednesday, banks lower Thursday, everything rate-sensitive Friday. The sharpest divergence is the simplest one — Energy fell 3.66% on the week while the index rose 3.57%. The sector that has carried the market all year is the one the reopening trade billed.
FRIDAY CLOSE & WEEK-ON-WEEK CHANGE — Friday, August 7, 2026:
MAJOR INDICES
Every major average finished green, but leadership changed hands three times before Friday consolidated it. Growth carried the arc — the Nasdaq 100 advanced roughly two and a half times the NYSE Composite, a gap saying the broad tape participated without ever leading. The Dow Theory read never settled: transports outran industrials Tuesday (+2.58% against +1.71%), broke beneath them Wednesday (−0.94% against +0.49%), and confirmed again by Friday. Four sessions, three reversals — oscillation, not signal.
| Index | Fri Close | WoW Change | WoW % | Why It Moved (Week) |
|---|---|---|---|---|
| S&P 500 | 7,757.46 | +267.66 | +3.57% | Built in two legs — Monday and Tuesday on the Hormuz de-escalation and the semiconductor reversal, then Friday’s record close as the payroll contraction priced the September hike out of the front end. The Nasdaq Composite’s 5.2% gain was its best week since April. |
| Dow Jones | 54,036.52 | +1,550.78 | +2.95% | Set records on three consecutive sessions on rotating earnings leadership — Caterpillar Tuesday, Lilly and Amgen Wednesday — then surrendered 464 points Thursday as Goldman Sachs and Citigroup led a bank selloff on the crude-driven yield backup. |
| DJ Transportation | 21,506.00 | +466.70 | +2.22% | Trailed the industrials despite crude falling nearly 9% on the week. Cheaper fuel moved the shares on Tuesday but never held them — the Dow Theory confirmation opened, closed and reopened inside four sessions. |
| Nasdaq 100 | 29,722.30 | +1,448.10 | +5.12% | Led every average on a semiconductor round trip: Intel and SanDisk each +10.84% Tuesday, an AI-capex de-rating Wednesday on AMD’s tripled capital-expenditure line, then a Friday recovery as rate-cut odds repriced. |
| Russell 2000 | 3,033.18 | +101.51 | +3.46% | Tracked the large-cap tape for four sessions, then took the lead Friday at +1.05% against the Dow’s +0.28% — the payroll miss priced out the hike the most rate-sensitive index had spent the week discounting. |
| NYSE Composite | 24,595.24 | +487.70 | +2.02% | Lagged every cap-weighted average. The week’s gains concentrated in large technology and materials weights, leaving the broad tape advancing at roughly half the S&P’s rate. |
VOLATILITY & TREASURIES
Both yields fell exactly 6.9 basis points, leaving 2s10s at 45.0 basis points — precisely where it began. That is the week’s quietest and most surprising fact: a stretch containing Kashkari’s September hike call, an ISM print at multi-year highs, a 4.72% oil spike and a negative payroll number produced a perfect parallel shift. The curve repriced the level of rates without altering its view of the path. The VIX made the same round trip, rising to 16.50 Tuesday on Middle East hedging before ending 6.88% lower.
| Instrument | Fri Level | WoW Change | Why It Moved (Week) |
|---|---|---|---|
| VIX | 14.89 | −1.10 (−6.88%) | Rose to 16.50 Tuesday on Middle East tail hedging even as the S&P set a record, then fell in every remaining session as the Hormuz risk premium and the heavy earnings calendar both cleared. |
| 10-Year Treasury Yield | 4.647% | −6.9 bps | Fell on Monday’s oil collapse and Wednesday’s soft ADP print, gave all of it back Thursday on Iran’s transit draft (+5.8 bps), then eased again Friday on the payroll contraction. |
| 2-Year Treasury Yield | 4.197% | −6.9 bps | Matched the 10-year basis point for basis point. Kashkari’s September hike argument lifted it 6.4 bps Thursday; Friday’s negative payroll print took 4.8 bps back out and the hike with it. |
| US Dollar Index (DXY) | 99.61 | −0.22 (−0.22%) | Barely moved across a week in which September hike odds fell from roughly 67% to 40%. The dollar declined to take a side between the energy-inflation read and the labour-softening one. |
COMMODITIES
The monetary metals ran away from the industrial one across all five sessions: gold and silver each added more than eight percent while copper managed one, and copper actually fell 1.87% on Friday as the others surged. That is the same dollar-sensitive complex splitting into two verdicts on the same labour data — precious metals pricing policy relief, copper pricing demand. The bid built on Wednesday’s ADP miss and extended through Friday’s payroll contraction, with equities setting records alongside it. A rate trade, not a fear trade.
| Asset | Fri Price | WoW Change | WoW % | Why It Moved (Week) |
|---|---|---|---|---|
| Gold | $4,398.87/oz | +$348.62 | +8.61% | Two decisive legs on dovish repricing — +3.71% Wednesday on the ADP miss and a softer dollar, +2.31% Friday on the payroll contraction. Equities set records in the same week, which rules out a fear bid. |
| Silver | $63.66/oz | +$5.590 | +9.63% | Outran gold on the identical catalysts, adding 3.24% Wednesday and 3.33% Friday. The precious complex moved as one unit all week; the industrial metals did not join it. |
| Copper | $6.58/lb | +$0.0652 | +1.00% | Effectively flat on the week and down 1.87% Friday, breaking from precious metals entirely on the session they rose hardest — the industrial read on the same labour print equities treated as policy relief. |
| Platinum | $1,754.10/oz | +$93.85 | +5.65% | Gained with gold and silver but lagged both. No platinum-specific catalyst surfaced in the week’s tape — the move reads as the precious complex carrying it rather than an independent bid. |
| Bitcoin | $64,974.00 | +$1,975.00 | +3.13% | Rose on four of five sessions inside a narrow 0.5–1.0% band with no crypto-specific catalyst in any of them. Tracked equity risk sentiment as a proxy rather than trading its own narrative. |
ENERGY
Crude round-tripped and still lost the week: a 5% Monday collapse when Trump stood down, a further break through $80 Tuesday, a 4.72% Thursday spike on Iran’s transit draft, and a Friday that handed the spike straight back. WTI fell harder than Brent — the wrong way round when the disruption is a global chokepoint, and the fingerprint of two consecutive US inventory builds rather than of the diplomacy. The strait never opened. Only the market’s estimate of when it will did.
| Asset | Fri Price | WoW Change | WoW % | Why It Moved (Week) |
|---|---|---|---|---|
| Crude Oil (WTI) | $77.15/bbl | −$7.44 | −8.80% | Fell 5.52% Monday on Trump standing down from Iran strikes, held the lower range through API and EIA inventory builds, spiked 3.60% Thursday on the transit draft, then gave it back Friday. The builds are why WTI fell harder than Brent. |
| Crude Oil (Brent) | $82.27/bbl | −$5.68 | −6.46% | Broke $80 Tuesday at −6.08% as the reopening trade peaked, then rallied 4.72% Thursday when Iran published transit terms tougher than the market had priced. Closed the week with the strait still blocked, as it has been since February 28. |
| Natural Gas (Henry Hub) | $2.670/MMBtu | −$0.100 | −3.61% | Decoupled from crude in every session, trading its own storage picture — a 33 Bcf injection above consensus left working gas 6.7% over the five-year average. |
| Natural Gas (Dutch TTF) | $18.80/MMBtu | −$1.15 | −5.76% | Fell with Brent early (−3.96% Tuesday, −4.27% Wednesday) then surged 5.87% Thursday on the transit draft while Henry Hub fell 1.93% — the sharpest US-versus-Europe gas split of the week. |
S&P 500 SECTORS — WEEKLY ROTATION
Basic Materials topped the week at +8.87% off a three-month base of just +0.16% — the entire move is recent, and it is gold’s: not one of the week’s ten largest movers sits in the sector. Technology’s +6.92% is the opposite case: five of the seven names on the weekly gainers screen — Oracle, Intel, CrowdStrike, Dell and Nvidia, each up 11–13% — are Technology, so the sector move is the leaderboard rather than a broad re-rate. Energy’s −3.66% is genuinely broad-based: Chevron and Exxon both rank among the week’s five worst movers, and the sector simply fell with them.
| Sector | 1-Week | 1-Month | 3-Month | 6-Month | YTD | 12-Month |
|---|---|---|---|---|---|---|
| Basic Materials | +8.87% | +9.00% | +0.16% | +4.19% | +16.58% | +39.21% |
| Technology | +6.92% | +2.48% | +8.89% | +32.13% | +24.59% | +34.10% |
| Industrials | +5.40% | +0.00% | +1.62% | +6.67% | +16.33% | +20.67% |
| Consumer Cyclical | +2.71% | +3.00% | −0.82% | +1.37% | −0.75% | +6.39% |
| Healthcare | +2.24% | +0.87% | +12.65% | +7.42% | +7.37% | +28.17% |
| Communication Services | +1.18% | −1.73% | −8.17% | +0.24% | +0.32% | +15.36% |
| Financial | +1.17% | +3.52% | +11.69% | +9.24% | +8.44% | +17.35% |
| Consumer Defensive | +0.02% | +2.13% | −0.90% | −3.31% | +8.34% | +5.35% |
| Real Estate | −0.26% | +1.28% | +2.10% | +7.83% | +10.98% | +9.23% |
| Utilities | −1.23% | −3.19% | −4.84% | −0.30% | +2.40% | +4.97% |
| Energy | −3.66% | +4.99% | +1.12% | +13.14% | +28.61% | +34.16% |
TOP WEEKLY MOVERS:
The gainers table is one trade wearing five names — Palantir, SpaceX, Oracle, Intel and CrowdStrike are all Technology or AI-adjacent, matching Technology’s second place in the rotation table above. The horizon columns split them cleanly, though. Intel is a momentum continuation, up 175% year to date and 414% on the year; Oracle (−24.6% YTD, −41.1% on the year) and Palantir (−3.2% YTD) are counter-trend bounces inside broken twelve-month trends. Identical weekly gains, opposite trades underneath. The decliners carry no such ambiguity: Chevron and Exxon are the crude unwind, Mastercard the interchange de-rating, and only AbbVie and UnitedHealth reflect anything company-specific.
TOP 5 WEEKLY GAINERS
| Ticker | Week | YTD | Year | Why It Moved |
|---|---|---|---|---|
| PLTR | +39.78% | −3.23% | −5.59% | Monday’s Q2 print was the week’s single largest catalyst: revenue of $1.935 billion up 93% year over year, US commercial revenue up 149%, and full-year guidance raised roughly $500 million to $8.15–$8.16 billion. Shares gained 29.45% Tuesday, drew same-session upgrades from Citi and Deutsche Bank, and added a further 10.32% Friday on a positive Bank of America view. |
| SPCX | +22.83% | – | – | A supply event that did not behave like one. Tuesday’s first public earnings beat on every line — revenue $7.81 billion up 92%, Starlink subscribers doubling to 12 million — but $18.4 billion of quarterly capital expenditure sent the stock down 13.60% Wednesday to an all-time low. Thursday’s lock-up released 911.5 million shares, more than doubling the float, and the stock closed up 6.14%; Friday added 15.83%. |
| ORCL | +13.21% | −24.57% | −41.05% | Rose 9.26% Monday on a cluster of commercial announcements — a Google Cloud partnership embedding Gemini into Oracle Fusion and NetSuite, a $400 million HR modernisation contract with CACI, and an Oracle Health expansion into Ontario hospitals — against a reported $638 billion remaining performance obligation backlog. A counter-trend bounce: the stock remains down more than 40% over twelve months on capital-expenditure and free-cash-flow concerns. |
| INTC | +12.69% | +175.47% | +414.16% | Gained 10.84% in Tuesday’s semiconductor reversal, closing above $100 for the first time in the move, on sector-wide AI-capex optimism rather than a company-specific disclosure. The clearest momentum continuation on the board — Intel is up 175% year to date and 414% over twelve months, so the week extended an existing trend rather than starting one. |
| CRWD | +12.34% | +82.97% | +101.81% | Climbed 6.12% Monday in the software-led leg of the tech rally and extended it into a three-day advance, with the company announcing its Fal.Con 2026 conference had sold out. Added 3.39% Friday. No earnings catalyst in the week — the fiscal Q2 report is not due until August 26, and the stock closed near its 52-week high going in. |
TOP 5 WEEKLY DECLINERS
| Ticker | Week | YTD | Year | Why It Moved |
|---|---|---|---|---|
| CVX | −5.22% | +22.41% | +21.81% | The purest expression of the crude unwind. Fell 1.85% Monday as Brent dropped 5% on the Hormuz de-escalation, and again 1.41% Friday as the reopening trade reasserted. Political pressure compounded it: Trump said this week that Exxon and Chevron are “making too much money” and should lower pump prices, and a senior Democrat proposed ending tax breaks for overseas oil production on Friday. |
| ABBV | −1.95% | +7.68% | +23.73% | Continued digestion of a Q2 report delivered just before the week began: revenue of $16.99 billion and adjusted EPS of $3.65, with full-year revenue guidance raised $300 million to $67.6 billion but adjusted EPS guidance trimmed to $13.87–$14.07 to absorb the pending Apogee Therapeutics acquisition. The stock also fell 2.33% Monday in the sector-wide pharma pullback on Medicare drug-pricing concerns. |
| MA | −1.77% | −1.39% | +0.31% | Fell 2.26% Friday alongside Visa — the only two mega-caps to drop more than 2% on a record-close session, on no dated catalyst. The standing overhang is the DOJ network-monopoly suit, the contested interchange settlement before Judge Cogan, the Credit Card Competition Act and stablecoin displacement. Company news ran the other way: the BVNK acquisition closed Monday, a Fiserv Commerce Hub partnership was announced, and Cantor Fitzgerald raised its target to $695. |
| UNH | −1.77% | +23.32% | +66.38% | No single catalyst — continued managed-care and reimbursement pressure. Fell 1.88% Tuesday and 2.13% Thursday, the second of those with no company-specific news identified in the tape. The week was quiet for company disclosures; the decline reads as sector-level positioning against a name still up 66% over twelve months. |
| XOM | −1.54% | +27.17% | +44.45% | Tracked the barrel rather than any disclosure, and held up materially better than Chevron across the same crude round trip — adding 2.12% Thursday on the transit-draft spike before giving it back Friday. TD Cowen raised its price target to $168 from $155 on Thursday, and the company declared a $1.03 quarterly dividend with an August 17 ex-date. |
— Institutional-grade intelligence for serious investors. Apply for membership at join.recessionalert.comC. WEEK’S TOP STORIES -> TOP
Four threads run through the week. The largest is negotiation the market cannot observe: stories #1 and #2 both turn on parties talking past each other — Tehran and Washington over transit terms, the FOMC and its own data over the rate path — while #9 opens a third front over who sits there. Stories #3, #4 and #5 are one cluster re-sorting itself, separating what AI earns from what it costs. Stories #6 and #7 show trade policy acting where courts are not in the way and stalling where they are. Story #8 is the week’s only admission of defeat.
UNCERTAIN
1. The Hormuz Round Trip: Strikes Called Off → a Deal “Today or Tomorrow” → Iran’s Restrictive Draft — Crude Ends the Week Down 8.8% With the Strait Still Shut
The core facts:Monday, President Trump held off on threatened strikes against Iran and said talks to revive cargo traffic through the Strait of Hormuz would begin; WTI fell 5.52% and Brent 5.00%. Tehran immediately said no negotiations with Washington were under way, only Oman-mediated discussions on managing the strait. Tuesday, Treasury Secretary Bessent told CNBC a deal could land “today or tomorrow” with “freedom of movement” and no Iranian toll; Brent broke $80, falling a further 6.08% to $78.68. Wednesday the EIA confirmed a roughly 2.5 million-barrel crude build against an expected draw — a second consecutive build breaking a seven-week drawdown streak — and a Houthi missile strike that set the Saudi tanker Encelia alight off Yanbu lifted Brent above $80 intraday before it closed lower anyway. Thursday, Iranian state agency Fars published a draft transit plan materially more restrictive than the market had priced; Brent rallied 4.72% to $83.20 and WTI 3.60%. Friday gave the entire spike back, WTI closing at $77.15 and Brent at $82.27, on reports the draft has still not cleared Iran’s parliament. The strait has been largely blocked since February 28, 2026. No agreement has been signed.
Why it matters:Five sessions of violent repricing occurred without a single barrel moving through the strait. What traded was not supply but the market’s estimate of when supply returns, and by Friday that estimate had hardened into an assumption: crude fell on a day whose only fresh news — a parliamentary hurdle — pointed toward delay. A market that sells the commodity on a bearish headline for the event it is pricing has stopped treating that event as conditional. The week also quietly supplied the one leg that owes nothing to diplomacy. Two consecutive inventory builds are a physical fact, and they are why WTI fell 8.80% against Brent’s 6.46% — the US-specific benchmark underperformed the global one during a global chokepoint disruption, which is the wrong way round unless domestic fundamentals are doing independent work. That gives the disinflationary impulse an anchor that survives a diplomatic failure. What it does not do is compensate the risk. Energy fell 3.66% on the week against the S&P’s 3.57% gain — a seven-point gap, and the sector that has led the index all year (+28.61% YTD) was the only one to lose more than 1% on Friday’s record day (see the sector rotation table and the Energy table in Section B; Chevron and Exxon both sit in the weekly decliners). The asymmetry from here is unattractive: a reopening on restrictive terms is worth far less than the clean reopening now embedded in the price, and a collapse in the talks reprices violently from a level carrying no cushion.
What to watch:The Iranian parliament’s vote on the transit draft — now the specific gate between a framework and an actual reopening. The clause that matters is whether transit conditions apply to all flags or only to designated corridors, since that is precisely the routing question that collapsed the signed June 17 memorandum after traffic had already resumed. Tanker transit counts, not statements, are the only confirmation worth acting on.
BULLISH
2. Five Fed Officials Spend Four Days Arguing for a Hike — and One Payroll Print Ends the Debate on Friday
The core facts:Monday, New York Fed President Williams said the Fed will raise rates if inflation does not ease, citing June PCE at 3.7% and putting a 2028 date on the return to target. Tuesday, Philadelphia’s Paulson kept a hike explicitly on the table, called the 9–3 July hold “not a close call,” and estimated underlying inflation at 2.4%–2.8%. Wednesday, Minneapolis’s Kashkari said “now is the time” to begin raising and named September 15–16 as a possible start, while Governor Lisa Cook — a permanent voter — said the committee may not have “the luxury of waiting.” Thursday, St. Louis’s Musalem argued for tighter policy on a labour market he described as “stabilized.” Friday, July nonfarm payrolls contracted 23,000 against a consensus near +83,000. September hike odds fell across the week from roughly 67% to 40%. Both the 2-year and 10-year yields ended the week down exactly 6.9 basis points, and the S&P 500 closed at a record 7,757.46.
Why it matters:Four consecutive sessions of escalating hawkish rhetoric — rising in seniority from a regional president to a sitting Board governor — moved the priced probability of a hike in the opposite direction every single day. That is the week’s most useful institutional fact, and it is not a story about the Fed being wrong. It is a story about the market having decided the argument will be settled by data the committee has not yet seen, and then being handed exactly that data on Friday. Musalem’s description of a “stabilized” labour market was contradicted by the BLS inside twenty-four hours. The market’s reading is legible in the composition rather than the direction. The Russell 2000 outpaced the Dow by nearly four to one, the 2-year fell twice as far as the 10-year, the dollar softened and volatility declined — four signatures of policy relief, and none of the four that a genuine growth scare produces. Utilities and Real Estate, the two weakest sectors on Thursday, both turned green on Friday. This is a rate trade, cleanly expressed. The discomfort is that the same print is also the strongest argument against the rally, and the market declined to price it. Payrolls have gone negative, average hourly earnings growth has slowed to its weakest since May 2021, and none of that supports the +50.4% blended earnings growth the index is capitalising. Reading a job loss purely as a policy input works only while the weakness stays inside hiring and out of demand — and copper, down 1.87% on the same session gold rose 2.31%, is already taking the other side (see the Commodities table in Section B).
What to watch:Wednesday’s July CPI and Thursday’s PPI are the two prints between here and the September meeting that can restore the hawkish case; a hot core reading would reopen the argument the payroll number appeared to close. Watch whether Kashkari, Cook or Musalem revise the “stabilized labour market” framing, and whether the Russell 2000 holds its leadership over the Dow — the cleanest single test of whether the rate-relief trade has legs.
UNCERTAIN
3. The AI Trade Stops Paying for Revenue and Starts Pricing What It Costs — Four Beat-and-Raise Prints Sell Off in One Week
The core facts:Tuesday the semiconductor complex reversed violently, Intel and SanDisk each adding 10.84% and Technology leading all sectors at +4.25%. That evening AMD beat on revenue, earnings and margin, guided Q3 roughly $480 million above consensus, and fell 8% after hours on capital expenditure of $808 million against a $299 million model — a roughly 40% sequential cut to free cash flow. Wednesday the selling reached names with no earnings event: Lam Research −3.25%, Palantir −2.61%, Applied Materials and Texas Instruments down 2–3%. NVIDIA diverged, rising 3.43%. Wednesday evening SanDisk reported revenue up 372% at an 84.6% gross margin with a $14 billion buyback and fell; Western Digital beat, raised and fell; both closed down roughly 10% and 11% respectively on Thursday. AppLovin missed revenue by 1% and lost a fifth of its value. Thursday, Dell gave back 5.41% and Arista 2.53% while Microsoft added 2.54%. Disclosed 2026 capex targets stand near $220 billion for Amazon, $200 billion for Alphabet, $175 billion for Microsoft and $130 billion-plus for Meta. Arista, Shopify and Cloudflare all beat, raised and rallied. Technology finished the week +6.92%.
Why it matters:Four companies beat and raised inside four sessions and were sold anyway. That is not a demand verdict — AMD’s data-centre revenue more than doubled, SanDisk expanded gross margin by 5,800 basis points, Cloudflare’s AI-agent traffic crossed half its network — and it is not a sector-wide exit either, since Technology finished the week as the second-strongest sector. What the week did was install a new sorting rule, and by Friday it had been applied consistently enough to read. Capital intensity is now the discriminator. Companies that capture AI spend without buying capacity to serve it — Arista at a 49.9% operating margin, Cloudflare raising both revenue and earnings guidance, Microsoft booking Azure consumption — held or gained. Companies that must fund growth from the cash-flow statement were marked down regardless of the income statement. The useful test is that this reached names with no disclosure of their own: Lam Research and Palantir fell on Wednesday having reported nothing, which is what distinguishes a theme re-rating from a run of bad prints. Two things argue against reading it as the start of an unwind, and they matter. NVIDIA rose against the complex on its worst day, which is rotation toward unquestioned margin rather than exit. And New York Fed President Williams explicitly declined to call AI a bubble on Thursday, grounding it specifically on the observation that the borrowing funding the buildout sits on balance sheets generating the earnings to carry it — a financial-stability judgement, not a valuation one. That is the difference between a repricing that costs investors money and one that reaches credit and costs the economy growth.
What to watch:Applied Materials on Thursday, August 13 is the cleanest available test — wafer-fabrication equipment orders either corroborate the capex the hyperscalers have guided to or they do not, and it is the one print that speaks for the whole chain rather than a single link. Cisco on Wednesday, August 12 carries the networking read. Watch investment-grade spreads for the technology and utility issuers financing data-centre construction, which is the channel Williams is implicitly saying remains healthy.
BULLISH
4. SpaceX Posts a Record Loss of Confidence and Then Absorbs $100 Billion of Unlocked Stock — the Shares End the Week Up 22.8%
The core facts:Tuesday after the close, SpaceX delivered its first earnings report as a listed company: revenue of $7.81 billion against $6.83 billion consensus, up 92% year over year; GAAP EPS of −$0.09 against −$0.23 expected; Starlink subscribers doubling to 12 million; the AI segment turning EBITDA-positive on $14.1 billion of new contracts. Capital expenditure was $18.4 billion against roughly $13 billion modelled, of which $15.83 billion was AI-related, and average revenue per Starlink subscriber fell 22% year over year. The stock fell 13.60% Wednesday to an all-time low of $108.29. Also Wednesday, COO Gwynne Shotwell outlined a full Starlink Mobile network built on roughly 65 MHz of spectrum acquired from EchoStar, with next-generation satellites in 2027; American Tower, Crown Castle and SBA Communications each fell about 6%. Thursday the first post-IPO lock-up released up to 911.5 million shares — roughly $100 billion — lifting the free float from 4.9% to 11.8% of shares outstanding; the stock traded to a new low of $105.11 and closed up 6.14%. Friday it added 15.83% to $133.11. A further 319 million shares unlock August 12.
Why it matters:Lock-up expiries resolve downward with enough regularity that the exceptions are worth studying. This one more than doubled the tradable float in a single session, into a stock that had made an all-time low the day before, on a week when the broad market was distracted — and the buyer base took all of it and bid the shares 22.8% higher across five days. Until Thursday the float was too small for price to say anything reliable about depth of demand. It now has said something, and it is the first genuine information the market has had about this constituent since the June listing. The company is also the cleanest single illustration of story #3’s sorting rule, which is why it belongs beside it rather than inside it. Every operating metric beat, and the stock still lost 13.6% on the capital-expenditure line alone — $18.4 billion of quarterly spend against $7.81 billion of quarterly revenue means the equity is the funding instrument and dilution is structural rather than calendar-driven. The Starlink Mobile disclosure adds a second-order consequence the tower REITs priced immediately: spectrum acquisition is the input a satellite operator does not need to fill coverage gaps and does need to compete for primary connectivity. Two constraints belong on the constructive read. Thursday released the first tranche, not the last — more than 4 billion shares are expected tradable by year-end, several times what cleared this week. And the close still sits roughly 15% below the $135 IPO price and about 41% below the June 16 peak.
What to watch:The August 12 unlock of 319 million shares — a second absorption without a new low would establish Thursday as depth rather than a squeeze. Watch whether the stock reclaims $135, the level at which remaining locked holders move from underwater to profitable and the supply calculus changes, and whether management supplies a capital-expenditure ceiling, the one disclosure that would let the market underwrite the spending.
BEARISH
5. Alphabet Loses Its DeepMind CEO, Its Chief Scientist and Several Gemini Leaders on One Day — With $200 Billion of Capex Guided and the Flagship Model Still Unshipped
The core facts:Wednesday, Alphabet announced an overhaul of its artificial-intelligence organisation. Demis Hassabis gave up the DeepMind chief executive role to become DeepMind chair and chief scientist across Alphabet, retaining Isomorphic Labs. Google chief scientist Jeff Dean, a 27-year veteran, is leaving alongside senior fellow Sanjay Ghemawat to found Discovery Loop, an independent public benefit corporation in which Google will invest. Several Gemini model leaders are also departing. Koray Kavukcuoglu, DeepMind CTO and Google’s chief AI architect, becomes senior vice president of DeepMind reporting directly to Sundar Pichai. Alphabet Class A fell 4.03% to $362.43, the session’s third-largest mega-cap decline and the principal driver of Communication Services’ 2.36% drop — the worst of the eleven S&P sectors that day. The reshuffle lands with the flagship version of the latest Gemini model still unreleased against a planned June launch, and with 2026 capital expenditure guided near $200 billion.
Why it matters:Executive reshuffles at large technology companies are ordinarily noise and the market ordinarily ignores them. It did not ignore this one, and the reason is the conjunction rather than any single departure. A company committing roughly $200 billion of capital in 2026 simultaneously lost the executive running its research organisation, the technical centre of gravity of the last 27 years, and several leaders of the specific model franchise that spending is meant to produce — while that model runs roughly two months past its planned launch. Any one of those is survivable. Together they pose a question the market cannot answer from outside: did the delay cause the reorganisation, or will the reorganisation extend the delay? The 4% decline is the price of that ambiguity rather than a verdict on the people involved. The timing against story #3 is what elevates this above a governance footnote. On the same session the market began separating AI revenue from the capital required to produce it, the complex’s second-largest spender disclosed that the organisation converting that capital into product is being rebuilt. Investors are being asked to underwrite $200 billion against a research leadership reconstituted that morning and a flagship model they have not seen. Sector arithmetic confirms it stuck: Communication Services is now the worst three-month sector in the index at −8.17% (see the sector rotation table in Section B), and its +1.18% week was the fourth weakest despite a broadly rising tape. The genuine counterweight is that Hassabis is not leaving, has moved to a wider remit, and Dean’s exit is amicable enough that Google is investing in his new vehicle.
What to watch:The release date of the flagship Gemini model — shipping it retires the delay question and reframes the reshuffle as a reorganisation around a finished product rather than a stalled one. Watch for further Gemini team departures, which would shift this from planned succession to exodus, and watch Communication Services against the index, since the sector has now been the quarter’s laggard through two separate causes.
BULLISH
6. Trump Signs a Section 232 Polysilicon Proclamation Pairing a 15% Tariff With Minimum Import Prices — the Price Floor, Not the Tariff, Is the Instrument
The core facts:Flagged Wednesday as imminent, the proclamation “Adjusting Imports of Polysilicon and its Derivatives into the United States” was published dated August 6 after Thursday’s close, with the equity reaction running through Friday. It pairs a 15% ad valorem tariff with minimum import price floors across the chain — reported at $21 per kilogram for polysilicon and $0.38 per watt for modules, with separate minimums for wafers and cells — framed under Section 232 as protection for US polysilicon production against Chinese dominance of both the solar and semiconductor feedstock chains. Importers investing in US wafer and cell production can offset the cost. Estimated impact on imported solar cells is roughly $0.10 per watt, or $600–$800 per installation. Measures take effect at 12:01 a.m. Eastern on December 4, 2026. First Solar rose 7.73% in Thursday’s after-hours session and traded up 8.95% at $266 pre-market Friday, with SolarEdge, Sunrun and Enphase also higher; CEO Mark Widmar called it “one of the most strategically significant trade measures in decades.”
Why it matters:The headline 15% is the least consequential number in the action. A minimum import price is a categorically different instrument from a duty: an ad valorem tariff can be absorbed through margin, currency, transshipment or under-invoicing, and Chinese solar supply chains have spent a decade demonstrating exactly that against successive US measures. A floor cannot be absorbed, because it does not tax the price — it sets it. At $0.38 per watt for modules, competing below a defined level becomes impossible regardless of cost structure, which is why the domestic producer with the most integrated US manufacturing base reacted as it did. This is also a semiconductor action that has been reported as a solar one. Polysilicon is the feedstock for wafers, and invoking Section 232 places it alongside steel, aluminium and copper — the buildout of domestic chip capacity is now being treated as a supply-chain security problem rather than a subsidy problem, a framing that tends to survive changes of administration in a way tax credits do not. It also carries materially less litigation risk than the Section 301 programme in story #7, which rests on a contested forced-labor rationale rather than national security. The cost side is real and lands on the other big theme of the week: every imported module gets more expensive from December 4, and the largest incremental buyer of US utility-scale solar is the data-centre complex, whose capital intensity the market spent this week scrutinising. Raising the input cost of power generation for that buildout is a genuine offset to the domestic-manufacturer gain, and the four-month lead time invites an import pull-forward that flatters Q4 volumes and depresses 2027.
What to watch:Whether the minimum prices extend to finished wafers used in semiconductors or stop at solar-grade material — that single scope question decides whether this is a solar story or a chip-supply-chain story. Watch module import volumes into the fourth quarter for a pull-forward, and whether utility-scale developers begin flagging higher project costs in guidance, which is where the cost side first becomes visible.
UNCERTAIN
7. Three Multi-State Suits Hit the Section 301 Tariffs in Forty-Eight Hours While Canada’s 50% Section 338 Deadline Closes to Eleven Days
The core facts:Monday, twenty-five Democratic-led states sued in the US Court of International Trade — the venue with exclusive first-instance jurisdiction — challenging 10% and 12.5% tariffs imposed July 24 on 60 trading partners under Section 301 over forced-labor allegations, arguing the rationale is a pretext to revive duties the Supreme Court already struck down. Tuesday a third multi-state action was filed against the USTR, using USTR officials’ own public statements as evidence the programme’s purpose was revenue rather than remediation; the underlying investigation was a single blanket three-month review covering more than 99% of US imports, with Section 232 goods carved out. Private actions from Burlap and Barrel and Collective Horology seek removal and refunds. On the Canadian track, an additional 50% duty on roughly $20 billion of goods across 554 tariff lines takes effect August 19 under three Section 338 proclamations signed July 20 — the statute’s first invocation since the 1940s, with no exemption for USMCA-originating goods. Trade Minister LeBlanc and chief negotiator Charette made a second Washington trip in two weeks; Thursday, Prime Minister Carney called Canada’s posture already “quite firm.” USTR Greer told a Senate committee he hopes to present interim USMCA options before year-end.
Why it matters:The market has largely stopped pricing tariff headlines, and this is the week that habit became expensive to keep. Three multi-state actions inside forty-eight hours in the one court with exclusive jurisdiction is a different proposition from a trade-association complaint: the plaintiffs have standing difficult to contest, and the third filing attacks the statutory authority itself rather than the rate. A claim built on the agency’s own statements that the forced-labor rationale was pretextual either survives a motion to dismiss or ends the programme — there is very little middle ground, and a blanket three-month investigation spanning 99% of imports is an unusual administrative record to defend. The exposure runs both directions, which is why this is uncertain rather than negative: firms that absorbed the duties face refund upside and continued margin drag on the two outcomes, firms that passed them through face the mirror image, and neither sits in consensus estimates because the timeline is unknown. The Canadian track is the half with a hard date and it is now inside two weeks. The structural feature that matters more than the headline rate is the absence of a USMCA carve-out: a 50% duty applying without regard to origin rules removes the mechanism by which North American manufacturers have organised cross-border supply chains for three decades, and firms cannot re-source around a rule that ignores sourcing. That is why the $20 billion trade-flow figure understates the disruption — the affected volume is modest, the invalidated planning assumption is not. Carney describing his position as already firm eleven days out signals the required concessions have been identified and declined. Greer’s interim-USMCA track is genuinely two-sided but the timelines do not meet: relief before year-end arrives months after August 19 has already changed behaviour.
What to watch:August 19 is the hard date. Any announcement before it that Canada has withdrawn the provincial alcohol bans, the dairy quota rule or the auto surtax is the only fast path to suspension, since those three actions are the stated trigger. Watch for a preliminary injunction in any of the three Court of International Trade actions, which would suspend collection and force immediate re-estimation across import-heavy sectors, and watch North American auto and rail names for whether the market believes the deadline holds.
UNCERTAIN
8. Big Pharma Concedes It Cannot Grow Organically — a Reported $400 Billion Merger, a $5.7 Billion Pipeline Charge and a Cluster of Deals in Four Sessions
The core facts:Monday the Financial Times reported AstraZeneca and Bristol Myers Squibb have held months of talks on a merger valuing the combined company near $400 billion, which would create the world’s fourth-largest drugmaker. The reaction was starkly asymmetric: AstraZeneca fell as much as 7% and closed down close to 9% in London while Bristol Myers gained roughly 6% in US premarket; analysts were described as “perplexed” by the logic, and the combined oncology overlap would attract significant antitrust scrutiny. Both companies declined to comment. The same session, Lilly fell 2.39%, AbbVie 2.33% and Merck 1.87%, and Healthcare closed red as one of only three negative sectors on a day the S&P rose 1.48%. Three of five definitive deals announced Monday were healthcare — KKR/Integer at a $5.7 billion enterprise value, Curium/Lantheus at up to $114.50 a share, and Indivior/Supernus. Tuesday, Merck raised full-year revenue guidance to $66.3–$67.3 billion while cutting adjusted EPS guidance to absorb a one-time $5.7 billion charge, equal to $2.31 per share, on the Terns Pharmaceuticals acquisition. Argus upgraded Bristol Myers Squibb twice in three sessions.
Why it matters:The market’s verdict on the reported merger was delivered immediately and unambiguously: the buyer was punished considerably harder than the target was rewarded. That asymmetry is the signature of shareholders concluding an acquirer is paying up to solve a problem rather than to capture an opportunity — here, the patent-cliff arithmetic facing large-cap pharma through the second half of the decade. Buying scale in oncology does not manufacture new molecules; it consolidates two pipelines under one cost base and buys time. What makes this a week-level story rather than a Monday headline is that Merck then did the same thing in miniature and disclosed the price. A $5.7 billion charge converting a revenue beat into a profit-guidance cut is the identical admission with an invoice attached, and it arrived within twenty-four hours of the first. Two incumbents, two sessions, one conclusion: organic growth will not close the gap. The read-through runs wider than the four names. When a sector’s largest constituents signal that scale must be bought rather than built, every standalone pipeline in the cohort is repriced against that admission — which depresses multiples across the group while simultaneously embedding a takeover option in the mid-caps, and explains why three of Monday’s five definitive deals were healthcare assets. The counterweight is genuine and keeps this uncertain rather than bearish. This is a report of talks, not an announcement: no terms exist, no board has approved anything, and the sources themselves flagged that no agreement may result. Healthcare also finished the week up 2.24% and remains the strongest three-month sector at +12.65%, so the consolidation signal is a re-rating of how growth is financed rather than evidence the sector is deteriorating.
What to watch:Whether either board confirms or denies the talks — continued silence after a move of this magnitude is itself informative — and whether AstraZeneca recovers the 9%, the cleanest measure of whether shareholders will tolerate the deal being pursued at all. Watch business-development commentary from remaining large-cap pharma for whether Terns was the last acquisition of its size or the first of several.
BEARISH
9. The White House Restarts the Clock on Removing Fed Governor Lisa Cook — and the 21 Days Run Straight Into the September FOMC
The core facts:Deputy White House Chief of Staff Daniel Scavino sent Federal Reserve Governor Lisa Cook a letter dated August 5, disclosed publicly Friday, demanding she answer allegations that she made false statements on mortgage applications and giving her 21 days to submit evidence or argument to the White House. The allegations originated with William Pulte, who oversees Fannie Mae and Freddie Mac. The procedural posture traces to June, when the Supreme Court ruled 5–4 that the Federal Reserve occupies a special place in government and that a president may remove a governor only for cause — expressly leaving it to the lower courts to determine whether these particular allegations meet that standard. The ruling was widely reported at the time as blocking the removal; it did not, it constrained the method. Coverage was confirmed by the Washington Post and NPR affiliates. Cook is a permanent voter and had, two days earlier, said the committee may not have the luxury of waiting to raise rates. Markets showed no visible reaction: the 2-year yield fell 4.8 basis points, the dollar index declined 0.32% and gold rose 2.31%.
Why it matters:The market treated the June ruling as the end of this matter, and that is the misreading the letter corrects. What the Court held was not that Cook is unremovable but that she is entitled to process, and that whether mortgage allegations constitute cause belongs to the lower courts. The administration has now started exactly that process, and the arithmetic of the timetable is the whole story: 21 days from August 5 places a White House determination inside the window running up to the September 15–16 FOMC — the meeting the market spent this entire week repricing from a possible hike to a hold, per story #2. A contested removal proceeding against a sitting governor overlapping with that decision is a materially different institutional backdrop than the one now priced. The mechanism that matters for portfolios is not who occupies the seat. Federal Reserve independence is priced into the long end of the Treasury curve and into the dollar as a standing assumption rather than as a variable, and assumptions of that kind reprice discontinuously rather than gradually. There is a second irony worth holding: Cook is one of the officials who spent this week arguing for tighter policy, so the removal effort is not obviously an attempt to install a more dovish committee than the one already there. The market’s non-reaction is genuine evidence and deserves weight — participants have seen versions of this and concluded, so far correctly, that it resolves without changing the committee. But the standing basis for that view was the June ruling, and the June ruling has just turned out to permit precisely the outcome its interpreters said it foreclosed.
What to watch:The 21-day response deadline in late August, immediately preceding the September FOMC — a White House determination inside that window is the escalation that forces a market reaction. Watch the 30-year yield and the dollar rather than the front end, since institutional-credibility risk prices in term premium and the currency, not in the near-term policy path.
— Separating signal from noise since 2007. Apply for membership at join.recessionalert.comD. WEEK IN THE ECONOMY -> TOP
The week’s tension was cooling labour against sticky services, and it broke in labour’s favour only on Friday. Hiring softened on four independent instruments — ADP at 44,000, JOLTS at 7.359 million, the ISM services employment index reversing to 47.4, and payrolls contracting 23,000 — while services activity accelerated (Business Activity 59.1, New Orders 57.2) and services prices paid firmed to 70.3%. Firms are serving more demand without adding headcount. Layered over it was a policy-vs-data divergence: five Fed officials argued for tightening across four sessions while priced September hike odds fell from roughly 67% to 40%, recession odds dropped five points to 8%, and both the 2-year and 10-year yields ended down exactly 6.9 basis points. The market settled the argument before the committee did. Wednesday’s July CPI decides whether services stickiness was a one-month artefact or the reason the hawks were right.
POLYMARKET ODDS — WEEK-ON-WEEK SHIFT:
| Market | Last Friday | This Friday | Δ |
|---|---|---|---|
| US Recession by end-2026 | 13.0% | 8.0% | −5.0 pp |
| Fed rate hike in 2026 | 67.0% | 55.0% | −12.0 pp |
| Fed rate cuts ≥1 in 2026 | 10.7% | 13.5% | +2.8 pp |
UNCERTAIN
1. July Payrolls Contract 23,000 Against a +83,000 Consensus — the First Negative Print in Months (BLS, Friday Aug 7)
What they’re saying:Nonfarm payrolls fell 23,000 in July against a Dow Jones consensus of +83,000, a 106,000 swing. Government payrolls dropped 53,000, with additional softness in retail, leisure and hospitality and slower healthcare hiring. The unemployment rate ticked down to 4.1% from 4.2% — but for the wrong reason, as the participation rate slipped to 61.4% and fewer people were working or looking for work. Average hourly earnings growth slowed to 3.2% year over year, the weakest pace since May 2021.
The context:The market read this as a policy input rather than a growth input, and the composition of the reaction shows the reading was deliberate rather than reflexive. The 2-year fell 8 basis points intraday to 4.16% against the 10-year’s 6, the Russell 2000 outpaced the Dow nearly four to one, the dollar softened and the VIX declined — four signatures of rate relief, none of which a genuine growth scare produces. September hike odds fell from above 50% to roughly 40%, and the S&P closed at a record. But the print landed one day after St. Louis Fed President Musalem argued for tighter policy on a labour market he called “stabilized,” and Richmond’s Barkin, speaking hours after the release, called 4.1% unemployment “neither loose nor tight” while flagging “cause for caution” if deterioration continues. Copper fell 1.87% the same session gold rose 2.31% (see the Commodities table in Section B) — the industrial complex pricing the same number as demand rather than as policy.
What to watch:The August employment report on September 4, which lands after the September 15–16 FOMC rather than before it — meaning this print, not a revision to it, is the labour data the committee takes into the meeting.
UNCERTAIN
2. The Growth-Versus-Hiring Gap Opens to the Widest of the Cycle — ISM Manufacturing at a Four-Year High and GDPNow Near 6% While Every Labour Instrument Softens (ISM / Atlanta Fed / Census, Mon–Fri)
What they’re saying:Monday’s ISM Manufacturing PMI printed 55.6 against a 54.0 consensus and 53.3 prior — the strongest since May 2022 and a seventh straight expansionary month — with the employment index jumping to 52.8 from 49.7 and Chicago PMI corroborating at 57.6. The Atlanta Fed’s GDPNow nowcast for Q3 leapt to 6.2% from 5.0%, lifting personal-consumption nowcasts to 4.6% and private investment to 17.9%, before easing to 5.8% by Thursday. Against that: ADP private payrolls added just 44,000 in July against consensus near 68,000–70,000; JOLTS openings fell to 7.359 million from a revised 7.537 million; the ISM services employment index reversed 3.8 points to 47.4; June factory orders fell 0.3% with core orders down 0.4% against a +0.4% expectation; and the trade deficit narrowed to $73.3 billion on falling exports and imports alike.
The context:GDPNow tracks hard spending and investment data; payrolls track hiring. The two have never been this far apart in this cycle, and the week is what opened the gap — a nowcast near 6% and a negative payroll print inside five sessions. The reconciliation that fits all of it is that firms are converting demand into output rather than into headcount, which is a productivity story for margins and a confidence story for employment, and the data cannot yet distinguish which. Note the internal contradiction on the goods side too: a manufacturing survey at a four-year high in the same week factory orders missed badly and the trade deficit improved on shrinking volumes on both sides. Surveys measure sentiment about direction; orders measure dollars. The market resolved the ambiguity by ignoring the growth leg entirely — yields fell on the labour data and never responded to the nowcast.
What to watch:The next GDPNow update and whether it is revised down to absorb the weaker labour backdrop — a nowcast that holds near 6% through a negative payroll month would make the divergence structural rather than a timing artefact.
BULLISH
3. Low-Fire, Low-Hire Hardens: Claims Below 200K for a Third Week, Layoffs at a Two-Year Low, Unit Labour Costs Undershoot by Nearly a Point (BLS / Labor Dept / Challenger, Thursday Aug 6)
What they’re saying:Initial claims for the week ended August 1 came in at 199,000 against a 202,000 consensus, a third straight week below 200,000 — the longest such streak since 1969 — with the four-week average falling to 198,750, its lowest since September 2022. Challenger reported 33,429 announced job cuts in July, down 27% from June and the lowest monthly total in two years, with year-to-date cuts of 477,033 running 41% below the same period in 2025; AI was the leading cited cause for a fifth consecutive month at 10,970 cuts. Q2 nonfarm productivity rose 1.4% while unit labour costs rose just 1.3% against a 2.1% consensus, with year-over-year productivity up 2.2%.
The context:Taken together these three releases describe the specific labour market the Fed has spent two years asking for: nobody is being fired, labour costs are not financing inflation, and output per hour is rising. It is also the exact configuration that makes the softness elsewhere in the week readable as a hiring freeze rather than a downturn — a labour market shedding 23,000 payrolls while claims sit at a 57-year low is not one where separations are driving the decline. The market gave the disinflationary content almost nothing on the day: yields rose 5.8 and 6.4 basis points because Brent added 4.72% the same morning. Two inflation channels moved in opposite directions and the one with the larger daily variance won the tape. The caveat that keeps this from being unambiguous is the Challenger composition — AI leading the cited causes for a fifth straight month says the displacement running underneath the falling headline is structural and concentrated in white-collar and technology roles.
What to watch:Thursday’s initial claims for the week of August 8 — a fourth consecutive sub-200,000 print alongside a negative payroll month would confirm that hiring, not firing, is the entire story. Q3 preliminary productivity in early November tests whether the cost restraint is durable.
BEARISH
4. Treasury Lifts Q3 Borrowing by $68 Billion to $739 Billion and Sets a $125 Billion Refunding for Next Week (US Treasury, Wednesday Aug 5)
What they’re saying:The quarterly refunding statement raised the July–September net privately-held marketable borrowing estimate to $739 billion, $68 billion above the May forecast, citing lower projected net cash flows. Treasury separately detailed a $125 billion August refunding covering $96.3 billion of maturing notes and bonds plus roughly $28.7 billion of new financing, with 3-year, 10-year and 30-year auctions scheduled for August 11–13. The revision sits against a roughly $1.9 trillion FY2026 deficit projected by the CBO.
The context:A $68 billion upward revision inside a single quarter produced no visible concession in yields on the day — the 10-year actually fell 1.3 basis points, and the tape attributed that to the ADP miss. That is the normal pattern and the reason to carry this forward rather than dismiss it: supply is the slowest-acting of the major yield inputs, and it moves the curve at auction rather than at announcement. The August 11–13 sequence is therefore the event. Three auctions across the curve inside three days arrive into a front end that spent this week repricing the September meeting by nearly thirty percentage points, and the 30-year leg on August 13 is where any indigestion appears first. The offsetting bid is real: if the labour softening in stories 1 and 3 persists, duration demand rises for growth reasons and comfortably absorbs the incremental supply. The risk case is the opposite pairing — a hot CPI on Wednesday that revives the hike trade, immediately followed by the quarter’s largest supply event.
What to watch:The August 13 30-year auction tail and bid-to-cover, the cleanest single read on whether $739 billion of quarterly supply is being absorbed comfortably. A 10-year back-up above 4.70% before the August 11 auction would signal the market is demanding concession.
UNCERTAIN
5. Consumer Credit Beats by a Third as Revolving Balances Accelerate — in the Same Week Wage Growth Hit a Five-Year Low (Federal Reserve G.19 / NY Fed, Friday Aug 7)
What they’re saying:Total consumer credit rose $14.17 billion in June against a $10.5 billion consensus, reversing May’s $1.08 billion decline. The Fed’s G.19 showed overall credit expanding at a 3.3% annual rate, with revolving credit-card balances growing at a 6.0% annual pace against 2.3% for nonrevolving. Separately, the New York Fed’s Survey of Consumer Expectations showed one-year-ahead inflation expectations easing to 3.6% in July from June’s 3.7%, which had been the highest reading since September 2023.
The context:Revolving credit growing at nearly three times the nonrevolving rate reads either as confident households or as households substituting credit for income, and the same week supplied the reason to worry about the second: average hourly earnings growth slowed to 3.2%, its weakest since May 2021. Credit accelerating while wage growth decelerates is the combination that precedes delinquency cycles, and it is worth flagging precisely because the headline print looks like strength. The easing in inflation expectations cuts the other way and matters for the Fed — it interrupts two straight months of rising short-term expectations and removes an anchoring complication from the labour-market debate. But the survey was fielded before Friday’s payroll print, so it carries no information about how households read a contracting labour market.
What to watch:Tuesday’s Q2 Total Household Debt release from the New York Fed, which carries the delinquency detail this credit build makes material. Watch whether revolving growth persists alongside slowing wage gains in the July G.19.
— Know the probability before the market prices in the risk. Apply for membership at join.recessionalert.comE. WEEK IN EARNINGS -> TOP
TOP EARNINGS OF THE WEEK
BULLISH
1. Eli Lilly (LLY): +4.86% on the day, close $1,191.94 by Friday | The Season’s Largest Guidance Raise, Funded Entirely by Volume
The Numbers:Released BMO Wednesday, August 5. Revenue $22.97 billion, up 48% year over year and 11.07% above the $20.69 billion consensus. Non-GAAP EPS $8.38 against $6.17 expected, a 35.86% beat and up 33%; GAAP EPS $7.94 against $7.33, up 26%. Mounjaro and Zepbound delivered a combined $14.9 billion — worldwide Mounjaro revenue up 91% to $9.9 billion with US revenue up 45% to $4.8 billion, and US Zepbound revenue up 44% to $4.9 billion. Full-year 2026 revenue guidance was raised to $85–$87 billion from $82–$85 billion; adjusted EPS guidance was narrowed to $35.50–$36.50 from $35.50–$37.00. Market capitalisation roughly $1.10 trillion.
The Problem/Win:A $2.28 billion revenue beat and a $3 billion lift to the bottom of the full-year range is the largest single upward revision of the reporting season, and the composition is what makes it credible rather than the size. Management explicitly flagged that Zepbound’s 44% US gain came despite lower realised prices, which means the franchise is absorbing price erosion and compounding anyway — a market-share result, not a pricing one. The qualification sits in the same release and is easy to miss: the EPS range was narrowed by trimming the top end from $37.00 to $36.50 even as revenue guidance rose $3 billion. That gap quantifies the margin cost of the volume, and it is the number to track rather than the headline.
The Ripple:As a trillion-dollar company trading above $1,100 a share, Lilly supplied the single largest contribution to Wednesday’s Dow record of 54,349.00 on a session when the S&P, Nasdaq 100 and Russell all fell — a price-weighted index effect worth understanding before reading that record as breadth. Healthcare gained 1.19% against a falling index. The competitive read-through arrived the day before from two directions at once: Pfizer’s berobenatide Phase 2b data suggesting weight loss comparable to tirzepatide, and Amgen’s MariTide progressing through Phase 3 — two credible monthly-dosing challengers to Lilly’s weekly incumbency surfacing within hours of each other. Lilly’s strength also came as Novo Nordisk fell on its own obesity-franchise concerns.
What It Means:The incretin franchise is still accelerating three years into launch while conceding price, which is the profile of a business taking share rather than harvesting it. Lilly is now large enough that its surprises move the index, and the narrowed EPS range is the market’s reminder that this growth is not free.
What to watch:Realised price per Zepbound prescription in Q3 — continued erosion at 44% volume growth is tolerable, but the trade-off breaks if volume decelerates first. Watch the widening gap between the raised revenue range and the narrowed EPS range, and the timing of the MariTide Phase 3 readout against Pfizer’s berobenatide programme.
UNCERTAIN
2. Advanced Micro Devices (AMD): −7.04% on the day | Every Line Beat Except the Two That Set the Multiple
The Numbers:Released AMC Tuesday, August 4. Record revenue $11.5 billion, up 50% year over year and 13% sequentially, against $11.28–$11.31 billion consensus. Non-GAAP diluted EPS $1.66 against $1.62 expected, up 246% year over year. Data Center revenue $6.7 billion, up 107% and now 58% of the company, on fifth-generation EPYC processors and Instinct MI350 GPUs. Client and Gaming $3.8 billion, with Client up 23% and Gaming down 31%; Embedded $977 million, up 19%. Q3 guided to approximately $13.0 billion ±$300 million against $12.5 billion consensus, with non-GAAP gross margin guided near 56%. Capital expenditure was $808 million against roughly $298 million modelled, and free cash flow fell to $1.56–$1.6 billion from $2.57 billion in Q1. CEO Lisa Su said Data Center revenue should more than double again in 2027.
The Problem/Win:Two lines did all the damage and neither is on the income statement. Capital expenditure at $808 million against a $298 million model is not a modelling variance — it is a 171% overshoot that cut free cash flow roughly 40% sequentially. The second is subtler and arguably worse: Q3 gross margin guided to approximately 56% is effectively flat against Q2, which tells investors that a 107% increase in data-centre revenue is arriving with no margin expansion at all. Growth that requires proportionally more capital and delivers no incremental margin is worth a lower multiple than growth that does not, regardless of its rate. The Gaming segment’s 31% decline is the other detail the headline obscures — the 50% consolidated growth rests entirely on one segment now representing 58% of revenue.
The Ripple:The print reached companies with no reporting event of their own, which is what separates a re-rating from a bad quarter: Lam Research fell 3.25%, Palantir 2.61%, and Applied Materials and Texas Instruments 2–3%, all on Wednesday, none on a company-specific disclosure. NVIDIA diverged upward at +3.43%. Arista — reporting within the same hour with 37.7% revenue growth and operating margin expanding to 49.9% — rose, and the pairing supplied the week’s cleanest natural experiment on where in the AI stack margin can be defended. Sandisk and Western Digital then delivered the same lesson from storage two days later, both beating and both falling double digits.
What It Means:Demand is settled and no longer the variable. What this print repriced is the conversion rate — what share of AI revenue a merchant supplier keeps after paying for the capacity to deliver it. On this quarter’s evidence the answer is less than the market had assumed, and the 2027 doubling Su guided to implies the capex line does not normalise soon.
What to watch:Whether Q3 gross margin prints above the 56% guide — expansion would retire the thesis that AMD is buying its growth, and is the single number that resolves this. Watch second-half capital-expenditure guidance for whether the $808 million run rate repeats, which would make the free-cash-flow compression structural, and Applied Materials on August 13 for whether the equipment orders corroborate the spending.
BULLISH
3. Palantir Technologies (PLTR): +29.45% on the day, +39.78% on the week | The Commercial Book Is Now Within $45 Million of the Government Book
The Numbers:Released AMC Monday, August 3. Revenue $1.935 billion against roughly $1.81 billion consensus, up 93% year over year and 19% sequentially. Adjusted EPS $0.41 against $0.34 expected; GAAP net income $1.062 billion, or $0.41 per share, against roughly $329 million and $0.13 a year earlier. Segment detail: US commercial $764 million, up 149% year over year and 28% sequentially; US government $809 million, up 90%; international government $181 million, up 42%; international commercial $182 million, up 26%. Adjusted gross margin 86%; adjusted operating income $1.194 billion for a 62% adjusted operating margin; GAAP net margin 55%. FY26 revenue guidance raised to $8.15–$8.158 billion from $7.65–$7.66 billion, US commercial guidance to above $3.424 billion implying at least 134% growth, adjusted operating income to $4.889–$4.897 billion and adjusted free cash flow to $4.5–$4.7 billion.
The Problem/Win:The segment arithmetic is the disclosure that matters and it is easy to lose behind the headline growth rate. Total commercial revenue of $945 million now sits within $45 million of total government revenue of $990 million — roughly one quarter from a balanced mix, and Palantir got there by growing the commercial side rather than shrinking the government side, which itself grew 90%. That retires the single most persistent structural objection to the name. The margin profile is the second half of it: a 62% adjusted operating margin on 93% revenue growth inverts the usual trade, since most software businesses buy that growth rate with margin rather than expanding it. Raising full-year revenue guidance by roughly $500 million at the half-year implies the second half is tracking materially above the April plan.
The Ripple:Palantir was the largest single contributor to the Nasdaq 100’s 3.32% Tuesday advance and the week’s biggest weekly mover at +39.78%. It drew same-session upgrades to Buy from Citi, which raised its target to $235 from $210, and from Deutsche Bank, then added 10.32% on Friday on a positive Bank of America view. It also supplied the fundamental justification for the enterprise-software leg of the week — the applied-AI layer monetising what the infrastructure layer is funding — alongside Shopify at +17.02% and Cloudflare at +13%. Notably it did not escape Wednesday’s capex re-rating, falling 2.61% on no company-specific news.
What It Means:This is the clearest audited evidence yet that AI spending is converting into application-layer revenue at scale, and management guided as though the curve steepens rather than flattens. The unresolved question is entirely valuation and comparison base: 149% commercial growth cannot be annualised indefinitely, and a 39.78% week prices a great deal of the next several quarters.
What to watch:Whether US commercial revenue holds above 100% year-over-year growth next quarter as the comparison base steepens — that single number is what the raised $3.424 billion full-year guidance depends on. Watch US commercial customer count and net dollar retention in the filing for evidence the 149% is broadening rather than concentrating in a handful of large accounts.
WEEK AHEAD PREVIEW:
Q2 2026 earnings season is 88% complete, and Friday’s calendar was empty of mega-caps — the largest reporter was Vistra Corp at $47.4 billion. Next week reopens with the index’s single largest company and then turns to the AI infrastructure chain.
Berkshire Hathaway (BRK.B) — BMO, Monday, August 10 — the week’s only mega-cap on Monday’s calendar at a $1.01 trillion market capitalisation, with consensus of $5.04 per share on $96.52 billion of revenue; broader estimates look for a roughly 12.9% year-over-year earnings decline on 4.3% revenue growth. Key focus: what Greg Abel does with a record $397.4 billion cash and short-term investment position in his second full quarter as chief executive — buybacks versus acquisitions is the question the market is actually asking — plus insurance underwriting income and float in a softening market. Results are filed over the weekend, so Monday’s session is the first opportunity to price them.
Cisco Systems (CSCO) — AMC, Wednesday, August 12 — expectations are for mid-teens revenue growth on AI networking orders, with gross margin guided to contract roughly two percentage points year over year. Key focus: whether AI order growth is large enough to offset the margin compression it costs, and the read-through to Cloudflare’s agent-traffic thesis.
Applied Materials (AMAT) — AMC, Thursday, August 13 — consensus of $3.39 per share, up 36.7% year over year, on revenue of $9.01 billion, up 23.4%. Key focus: the cleanest available read on whether semiconductor capital-equipment orders match the spending the hyperscalers have guided to, which is the central unresolved question in the AI capital-intensity debate.
Deere & Co (DE) — BMO, later in the week — calendar sources conflict between Thursday, August 13 and Friday, August 14, so the day should be confirmed before positioning. Key focus: agricultural capital-goods demand and dealer inventory, the cleanest read available on farm-sector credit conditions.
With 88% of the index reported and blended growth running at +50.4%, next week is the season’s last cluster of consequence; the remaining calendar thins materially thereafter.
— US market commentary trusted by family offices and institutions. Apply for membership at join.recessionalert.comF. NEXT WEEK SETUP -> TOP
UPCOMING RELEASES:
| Date | Event | Why It Matters |
|---|---|---|
| Tue, Aug 11 | Existing Home Sales (Jul, prior 4.09M) — High | The most rate-sensitive consumer transaction in the economy, reporting into a week that just repriced the front end. If policy relief is real, housing is where it shows up first. |
| Tue, Aug 11 | Existing Home Sales MoM (Jul) — Medium | The momentum read on the same series; direction matters more than level given how long the market has been range-bound. |
| Tue, Aug 11 | Total Household Debt (Q2, prior $18.8T) — Medium | Carries the delinquency detail that makes Friday’s consumer-credit build readable — revolving balances grew at 6.0% annualised while wage growth hit a five-year low. |
| Wed, Aug 12 | Core Inflation Rate YoY (Jul, prior 2.6%) — High | The week’s decisive print. Paulson put underlying inflation at 2.4%–2.8%; a core reading inside that band supports the hold, above it reopens the September hike the payroll number appeared to close. |
| Wed, Aug 12 | Core Inflation Rate MoM (Jul, prior 0%) — High | The monthly core is where services stickiness surfaces — ISM services prices paid firmed to 70.3% in July even as hiring contracted. |
| Wed, Aug 12 | Inflation Rate YoY (Jul, prior 3.5%) — High | Headline still sits well above target. Williams cited June PCE at 3.7% as his condition for a hike; the headline path is what makes his language operative rather than hypothetical. |
| Wed, Aug 12 | Inflation Rate MoM (Jul, prior −0.4%) — High | July captures the first full month of the crude round trip. A soft monthly print would confirm the energy channel is doing the disinflationary work the labour channel cannot. |
| Wed, Aug 12 | CPI (Jul) — Medium | The index level itself, and the input to real-wage arithmetic now that average hourly earnings growth has slowed to 3.2%. |
| Wed, Aug 12 | Monthly Budget Statement (Jul, prior −$120B) — Medium | Lands two days into the $125 billion refunding. Treasury raised its Q3 borrowing estimate $68 billion citing lower net cash flows — this is the receipts side of that revision. |
| Thu, Aug 13 | PPI MoM (Jul, prior −0.3%) — High | The pipeline read on the cost-push question. ISM manufacturing prices paid ran 71.1 with raw materials up 22 consecutive months. |
| Thu, Aug 13 | PPI YoY (Jul, prior 5.5%) — Medium | At 5.5% the producer channel is running well above the consumer channel — the gap is either margin compression ahead or passthrough to come. |
| Thu, Aug 13 | Core PPI MoM (Jul, prior 0.2%) — Medium | Strips the energy round trip out, isolating whether the underlying producer trend is genuinely contained. |
| Thu, Aug 13 | Core PPI YoY (Jul, prior 4.7%) — Medium | The most persistent inflation series in the set. It has not been close to target and is the hawks’ strongest single number. |
| Thu, Aug 13 | Initial Jobless Claims (week of Aug 8, prior 199K) — Medium | A fourth consecutive sub-200,000 print alongside a negative payroll month would confirm the labour softness is a hiring freeze rather than a separations cycle. |
| Thu, Aug 13 | Continuing Jobless Claims (week of Aug 1, prior 1,801K) — Medium | The better read on whether the unemployed are finding work — the participation rate fell to 61.4% in July, which flattered the headline unemployment rate. |
| Thu, Aug 13 | Fed Hammack Speech — Medium | The first scheduled Fed voice after CPI and PPI, and the first opportunity for the hawkish bloc to respond to a labour market their “stabilized” framing did not anticipate. |
| Thu, Aug 13 | Fed Barkin Speech — Medium | Barkin called 4.1% unemployment “neither loose nor tight” hours after Friday’s release while flagging “cause for caution” — watch whether a week of data moves that language. |
WHAT TO WATCH NEXT WEEK:
1. Does Wednesday’s CPI restore the hawkish case a single payroll print appeared to bury? Five Fed officials spent four sessions arguing for a September hike and the market cut the odds every day anyway. Core at or below Paulson’s 2.4%–2.8% estimate vindicates the market; a hot services core hands the argument back to a committee that never conceded it.
2. Can a Hormuz reopening survive the Iranian parliament — and what is Energy worth if it cannot? Crude fell 8.8% on the week without a single barrel moving through the strait, and Friday it fell again on news pointing to delay. The sector is down 3.66% on the week while still leading the index at +28.61% year to date. The parliamentary vote is now the gate, and the June memorandum that already collapsed did so on precisely this routing question.
3. Does the AI capital-intensity verdict survive Applied Materials on Thursday? Four companies beat and raised this week and were sold on the cash-flow statement. Wafer-fabrication equipment orders either corroborate the roughly $725 billion of guided 2026 hyperscaler capex or they do not — and unlike any single vendor’s print, this one speaks for the whole chain. Cisco on Wednesday carries the networking read.
4. Does $125 billion of supply find buyers if CPI runs hot first? The 3-, 10- and 30-year auctions on August 11–13 straddle Wednesday’s inflation print. A benign CPI leaves duration well bid on the growth read; a hot one puts the largest supply event of the quarter into a front end trying to reprice a hike. The August 13 30-year tail is the number that matters.
5. Do two Fed governance stories converge? Chair Warsh has floated cutting FOMC meetings from eight to six as part of a broader retreat from forward guidance, while the White House has started a 21-day clock on removing Governor Lisa Cook that expires just before the September meeting. Fewer scheduled decisions concentrate volatility into each remaining one; a contested seat concentrates it further. Watch the 30-year and the dollar, not the front end.
— US market commentary trusted by family offices and institutions. Apply for membership at join.recessionalert.comG. CHART OF THE WEEK -> TOP
WHY THIS CHARTFour of the week’s five charts examined one market each — US versus world valuations, manufacturing’s hiring turn, AI export concentration, the collapse in frontier token pricing. Friday’s examines the assumption underneath the week itself: the index closed at a record because a negative payroll print priced a September hike out of the front end, and this chart is the argument that the front end is the only place that relief ever lands.
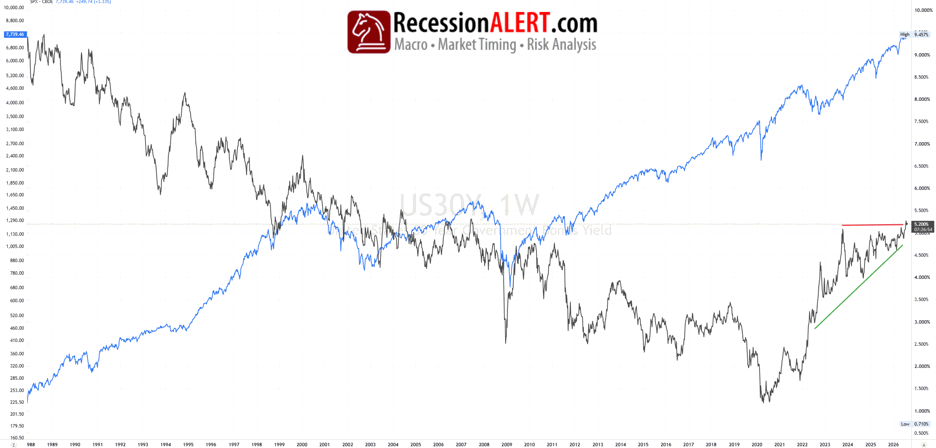
ORIGINAL CHART ANALYSIS — FROM FRIDAY’S MIBThe Chair said the right words, and the long bond sold off. On 29 July, Kevin Warsh told markets there is no soft inflation target, only 2%. The 30-year yield rose 12bp during those remarks. The 2-year fell 4bp. The front end took him at his word. The back end did not. The disbelief has a price. The 30-year TIPS yield now pays 2.96% real, the highest real return the long bond has offered since the crisis. That is compensation for doubt rather than for policy. Investors want three points above inflation for thirty years. The deficit runs at 5.8% of GDP, and the supply itself rebuilds the premium. That real yield is also the rate every distant equity cash flow is discounted at. For three decades that yield fell, 875 basis points in all, and a falling discount rate did much of the work. The engine now runs in reverse and the index is at a record anyway. Earnings growth is outrunning the hurdle, not escaping it. A policy rate mean-reverts. A term premium need not. Easing would leave the back end untouched, or lift it — so the 30-year mortgage stops waiting on the funds rate. Watch the dissenters: if the Fed actually hikes, the long bond should rally. A weekly close back under 5.2% would make four years of failure the story again. The front end still answers to the Fed. The back end has stopped asking. What it means: a Fed cut will not rescue housing or rate-sensitive equities, because their discount rate is set at the back end. Take policy relief in short duration, and reprice long-dated assets at 3% real.
MIB Weekly Digest Ver. 1.79
For professional investors only. Not investment advice.
© 2026 RecessionALERT.com

Comments are closed.