
MIB WEEKLY DIGEST
Week of Jul 27–31, 2026
Wednesday’s 9-3 FOMC hold — three members dissenting for a hike, the first such split since 2016 — knocked 2.18% off the Dow in its worst session since April 2025. Then Microsoft (+21.75% on the week) and Amazon (+17.00%) answered July’s AI-capex scare with $720-745 billion of committed 2026 spending, and the S&P closed up 1.05%. It was not a broad rally: the Russell 2000 finished flat and eight of eleven sectors fell Friday. Underneath, the Dow Transports fell all five sessions, Q2 growth undershot at 1.5% and Apple lost 7.35% on memory costs.
TABLE OF CONTENTS
A. WEEK AT A GLANCE
B. WEEK IN MARKETS
C. WEEK’S TOP STORIES (8)
D. WEEK IN THE ECONOMY (5)
E. WEEK IN EARNINGS (3)
F. NEXT WEEK SETUP
G. CHART OF THE WEEK
A. WEEK AT A GLANCE -> TOP
The S&P 500 gained 1.05% on the week to 7,489.80, but every point of it was earned in the final two sessions — through Wednesday’s close the index was down 1.29%. The dominant driver was a collision: a 9-3 FOMC hold with three members dissenting for a hike took 1.51% out of the market on Wednesday, and Microsoft and Amazon put it back on Thursday and Friday by answering July’s AI-capex scare with $720-745 billion of committed 2026 spending. What the week left behind is harder than what it resolved — growth undershot at 1.5% while the GDP price index spiked to 6.3%, and the 10-year closed at its highest level since January 2025.
• Wednesday was the week’s only real shock — the Dow fell 1,152 points, or 2.18%, its worst session since April 2025, after the FOMC held 9-3 with Hammack, Kashkari and Logan dissenting for a hike; the VIX jumped 13.29% to 20.63.
• Mega-cap dispersion was extreme and almost entirely inside one sector — Microsoft +21.75% and Amazon +17.00% on the week against KLA −13.16% and Micron −10.63%, while Technology itself finished flat at −0.05%.
• The Dow Transports fell in all five sessions to −6.39%, opening a 7.43-point Dow Theory non-confirmation against the Industrials — and they did it while WTI fell 6.46%, removing the cost explanation.
• The dollar broke 100, sliding 1.64% on the week to 99.83 into rising long-end yields — the 30-year touched 5.21%, a 19-year high, and no safe-haven bid appeared on Wednesday’s rout.
• Q2 GDP undershot at 1.5% against 2.1% expected while the GDP price index spiked to 6.3% from 3.6% — the stagflationary pairing — even as core PCE cooled to 3.3% the same morning.
• Hormuz reversed five times in five sessions — strike pause, Omani transit plan, Iranian ballistic missiles on a US base in Jordan, a US “heavy wave” of retaliation, then a proposed Saudi naval coalition — leaving Brent down 10.41% on the week but up roughly 23% for July.
1. Capex is now priced by what sits beside it — Microsoft rose 15.51% and Meta fell 7.95% on the same evening guiding capital spending in the same direction, the entire difference being that one had an accelerating cloud revenue line attached and the other did not.
2. The memory shortage became a two-sided trade — the same scarcity that locked SK Hynix limit-up on a record Kospi session showed up as a four-point margin contraction at Qualcomm, a gross-margin warning at Apple, and roughly $20 billion of extra Amazon capex that buys no additional capacity.
3. Markets priced out the hike and the cut at once — Polymarket’s 2026 hike odds fell 5 points while ≥1-cut odds fell 4.4, and the 2-year dropped 7.1 bps as the 10-year rose 3.5; this was a duration repricing, not a directional one.
4. The real economy dissented from the index — transports fell in all five sessions into a 6.5% drop in crude, Q2 growth undershot at 1.5% and real private-sector wages fell 0.4% year-on-year, while four companies carried the S&P to a weekly gain.
 — Leading economic indicators. Accurate market forecasts. Apply for membership at join.recessionalert.com
B. WEEK IN MARKETS -> TOP
The week was decided by two events three days apart. Wednesday’s 9-3 FOMC hold — the first three-way same-direction dissent since 2016, all three for a hike — took 1.51% out of the S&P 500 and pushed the 30-year to a 19-year high; Thursday and Friday gave it all back and more as Microsoft’s Azure accelerated to 43% and Amazon’s AWS to 37%, and the four largest hyperscalers guided 2026 capital spending to $720-745 billion. July’s semiconductor scare was answered with a number. But the index gains were manufactured by four companies: eight of eleven sectors fell on Friday, the Russell 2000 finished the week flat and the NYSE Composite trailed the S&P. The week’s least comfortable fact sits underneath all of it — the Dow Transports fell in all five sessions, into a 6.5% decline in crude and a 1.5% Q2 GDP print.
FRIDAY CLOSE & WEEK-ON-WEEK CHANGE — Friday, July 31, 2026:
MAJOR INDICES
The week’s defining number is not the S&P’s +1.05% but the 7.43-point gap between the Dow and its own Transportation Average, which fell in all five sessions while industrials rose in four — the widest Dow Theory non-confirmation of the year, and it widened rather than closed as crude fell 6.5%. Large-cap versus small-cap and growth versus broad both stayed inside threshold, so breadth was not the story; direction of freight was. Every index gain was manufactured Thursday and Friday: through Wednesday’s close the S&P was down 1.29% on the week.
| Index | Fri Close | WoW Change | WoW % | Why It Moved (Week) |
|---|---|---|---|---|
| S&P 500 | 7,489.80 | +77.84 | +1.05% | Net gain built entirely on Thursday and Friday, after Wednesday’s FOMC hold with three hike dissents cost 1.51% in one session. Microsoft’s Azure acceleration and Amazon’s AWS beat supplied the whole recovery. |
| Dow Jones | 52,485.74 | +539.23 | +1.04% | Round-trip week: Coca-Cola’s beat drove Tuesday to a 10-session high, Wednesday’s Fed dissents erased it with the worst session since April 2025, and Thursday-Friday earnings rebuilt the gain. |
| DJ Transportation | 21,039.3 | −1,436.90 | −6.39% | Fell in all five sessions. Monday’s 2.34-point split from the Dow widened to 7.43 points on the week. With fuel costs falling and Q2 GDP at 1.5%, freight demand is the residual explanation. |
| Nasdaq 100 | 28,274.20 | +145.86 | +0.52% | Confirmed a technical correction Wednesday, more than 11% below its June peak, then recovered all of it in 48 hours on hyperscaler capex guidance. The small net gain conceals a violent round trip. |
| Russell 2000 | 2,931.67 | −0.36 | −0.01% | Dead flat. Small caps led Monday while the chip selloff stayed contained, then sat out both mega-cap earnings sessions entirely and closed red on Friday as the S&P gained 0.70%. |
| NYSE Composite | 24,107.54 | +116.66 | +0.49% | Outpaced the S&P through Monday and Tuesday’s broadening, then trailed it by more than half a point on the week as leadership narrowed back into four mega-caps. |
VOLATILITY & TREASURIES
The curve did something the headline levels hide: the 2-year fell 7.1 bps while the 10-year rose 3.5, steepening 2s10s from 34 to 45 bps in five sessions. That is the front end pricing the hold and the long end pricing the dissenters — a credibility steepener, not a growth one. The dollar confirms it, sliding 1.64% and breaking 100 into rising yields, with Wednesday’s 2.18% Dow rout producing no haven bid at all. VIX ended 13.9% lower only because Thursday and Friday unwound a 13.3% Wednesday spike.
| Instrument | Fri Level | WoW Change | Why It Moved (Week) |
|---|---|---|---|
| VIX | 15.99 | −2.58 (−13.89%) | Spiked 13.3% to 20.63 on Wednesday’s dissent shock, then collapsed 17.3% Thursday and a further 6.4% Friday. The net decline is a fear unwind, not a fear that never arrived. |
| 10-Year Treasury Yield | 4.716% | +3.5 bps | Fell 8 bps into the Fed on the Iran de-escalation, then rose 19 bps across the three sessions after it. Friday’s Chicago PMI beat and Barkin’s call to reverse 2025’s cuts took it to its highest close since January 2025. |
| 2-Year Treasury Yield | 4.266% | −7.1 bps | Fell through the front half of the week and barely moved on Fed day itself — the hold was already priced. Its decline against a rising 10-year is the whole of the week’s curve story. |
| US Dollar Index (DXY) | 99.83 | −1.66 (−1.64%) | Declined on three consecutive sessions into rising long-end yields and broke the 100 handle on Thursday. No safe-haven bid emerged on Wednesday’s 2.18% Dow rout. |
COMMODITIES
Gold finished the week fractionally lower and copper 2.80% higher — the cleanest possible separation of the monetary hedge from the physical one, and the physical leg won. That gold could not hold a bid across a hawkish three-way FOMC dissent, a US strike on Iran and a dollar that broke 100 is the more telling half: the haven trade was rented for a day on Thursday and returned on Friday. Platinum’s 3.84% points the same way. Bitcoin tracked equities for four sessions, then fell 2.78% into Friday’s rally.
| Asset | Fri Price | WoW Change | WoW % | Why It Moved (Week) |
|---|---|---|---|---|
| Gold | $4,050.25/oz | $−5.87 | −0.14% | Round-tripped: sold into the FOMC, bid on the dissents and the dollar break, then handed it back Friday. Net-unchanged across a week containing a Fed shock and a US strike on Iran. |
| Silver | $58.070/oz | $−0.423 | −0.72% | Tracked gold’s round trip with more amplitude — down 2.30% Tuesday, up 2.02% Thursday — and finished slightly worse, with no independent industrial bid emerging. |
| Copper | $6.5148/lb | $+0.1773 | +2.80% | Thursday’s 2.99% jump on AI data-centre and grid-transmission demand did the week’s work, and the gain held Friday while precious metals sold. No supply disruption was involved. |
| Platinum | $1,660.25/oz | $+61.40 | +3.84% | The week’s best metal, on Thursday’s 4.19% surge alone. Outran both gold and silver, putting it with copper on the industrial side of the split rather than the haven side. |
| Bitcoin | $62,999.00 | $−1,259.00 | −1.96% | Followed the equity tape for four sessions without adding anything, then decoupled on Friday — falling 2.78% into a 0.70% S&P gain, its only idiosyncratic session of the week. |
ENERGY
The transatlantic spread is the week’s story: Brent’s premium over WTI collapsed from $7.74 to $3.36 as the seaborne barrel gave back a Hormuz premium the landlocked one never carried. Both round-tripped — down 12% by Tuesday on the US-Iran strike pause, then reversed Wednesday when Iran fired on a US base. Natural gas split by geography rather than by crude: Henry Hub hit a three-month low on record US production while Dutch TTF traded every Hormuz headline. Crude fell on the week while equities rose — supply relief, not demand destruction.
| Asset | Fri Price | WoW Change | WoW % | Why It Moved (Week) |
|---|---|---|---|---|
| Crude Oil (WTI) | $84.59/bbl | $−5.84 | −6.46% | Collapsed 12% across Monday and Tuesday to $79.14 on the US-Iran strike pause and Oman’s Hormuz transit plan, then reversed 6.74% Wednesday when Iran struck a US base in Jordan and rejected the plan. |
| Crude Oil (Brent) | $87.95/bbl | $−10.22 | −10.41% | Fell substantially further than WTI, compressing the transatlantic spread from $7.74 to $3.36 as the seaborne risk premium unwound first. Still closed a July that gained roughly 23%. |
| Natural Gas (Henry Hub) | $2.770/MMBtu | $−0.114 | −3.95% | Hit a three-month low on Tuesday on record domestic production and weak LNG feedgas demand, then stabilised — a US oversupply story that ran independently of the Hormuz tape all week. |
| Natural Gas (Dutch TTF) | $19.95/MMBtu | $−1.18 | −5.58% | Traded the geopolitics rather than the US supply story — down 7.67% on Monday’s pause, up 5.24% Wednesday on the escalation. Europe still pays the Hormuz premium; Henry Hub does not. |
S&P 500 SECTORS — WEEKLY ROTATION
Both leading sectors were one stock each. Consumer Cyclical’s +6.92% and Communication Services’ +4.82% are Amazon (+17.00% on the week) and Alphabet (+11.38%) — strip them and the top of this table is unrecognisable, and both sectors remain negative year-to-date (−3.33% and −0.91%). That is mean reversion off a single print, not leadership. The inverse holds at the bottom: none of the week’s five largest decliners sit in Utilities, the worst sector at −3.69%, so that decline is rate-driven and broad — the 10-year’s rise to a January-2025 high, not any name in particular.
| Sector | 1-Week | 1-Month | 3-Month | 6-Month | YTD | 12-Month |
|---|---|---|---|---|---|---|
| Consumer Cyclical | +6.92% | +0.19% | −1.75% | −4.82% | −3.33% | +3.08% |
| Communication Services | +4.82% | −2.56% | −7.52% | −5.14% | −0.91% | +17.15% |
| Consumer Defensive | +1.69% | +2.44% | −1.16% | +2.12% | +8.33% | +7.26% |
| Financial | +1.16% | +3.65% | +9.77% | +6.69% | +7.23% | +15.17% |
| Energy | +0.39% | +13.46% | −1.50% | +17.71% | +33.10% | +36.55% |
| Technology | −0.05% | −3.41% | +7.29% | +15.68% | +16.59% | +25.16% |
| Healthcare | −0.21% | +0.47% | +9.64% | +4.41% | +4.93% | +21.90% |
| Basic Materials | −0.59% | −1.11% | −6.85% | −9.67% | +7.09% | +31.13% |
| Real Estate | −1.91% | +1.73% | +2.56% | +8.03% | +11.25% | +8.34% |
| Industrials | −2.23% | −7.03% | −3.82% | +1.98% | +10.54% | +13.66% |
| Utilities | −3.69% | −1.19% | −6.95% | +0.18% | +3.61% | +7.02% |
TOP WEEKLY MOVERS:
Technology finished the week at −0.05% — and that number is worthless. It contains the largest gainer on the board (Microsoft, +21.75%) and four of the five largest decliners, a dispersion of roughly 35 points inside a single sector. The deeper tell is direction of travel: every one of the five decliners is up sharply year-to-date, Micron by 188% and Dell by 222%, so this was profit-taking in winners rather than a de-rating. The gainers split cleanly the other way — Amazon and Alphabet extended existing trends, while Microsoft (−3.91% YTD, −12.89% over twelve months) and Oracle (−33.37% YTD) ran the week’s two largest counter-trend rebounds.
TOP 5 WEEKLY GAINERS
| Ticker | Week | YTD | Year | Why It Moved |
|---|---|---|---|---|
| MSFT | +21.75% | −3.91% | −12.89% | Fiscal Q4 delivered Azure growth accelerating to 43% in constant currency, past $100B in annual revenue, with FY2027 capital expenditure guided to $255-260B against roughly $220B modelled. Thursday’s session was the largest single-day market-value gain in the company’s history. Still the week’s biggest counter-trend move — the stock remains down over twelve months. |
| AMZN | +17.00% | +17.66% | +16.01% | Q2 net sales cleared $200 billion for the first time and AWS grew 37% — its fastest in 18 quarters — on segment operating income of $16.6B. 2026 cash capex was raised to roughly $220B, which CEO Andy Jassy attributed specifically to higher memory costs rather than to additional capacity. |
| ORCL | +12.94% | −33.37% | −48.82% | Two catalysts bracketed the week: a ten-year Department of War enterprise software agreement worth up to roughly $7B plus a $3.31B Navy IDIQ on Monday, then an expanded Google Cloud partnership on Thursday bringing Gemini models into Fusion Applications and NetSuite. Working against it, Wisconsin regulators upheld credit rules that could require over $7B of collateral for its planned AI data centre. |
| GOOGL | +11.38% | +13.78% | +85.58% | Q2 revenue grew 23% to $119.8B and the shares added 6.73% on Friday alongside the other hyperscalers, with 2026 capex guided to roughly $205B. The qualification is cash: spending at that level produced the first negative free cash flow since the 2004 listing. Class A and Class C are consolidated in this row. |
TOP 5 WEEKLY DECLINERS
| Ticker | Week | YTD | Year | Why It Moved |
|---|---|---|---|---|
| KLAC | −13.16% | +50.46% | +107.98% | Reported record fiscal Q4 revenue of $3.66B, beat on EPS and guided the September quarter above consensus — then fell 10.80% the next session anyway, the largest mega-cap decline of Wednesday. Several houses cut targets (Deutsche Bank to $195, UBS to $215) as the market repriced wafer-fab-equipment spending rather than the print itself. |
| MU | −10.63% | +188.37% | +654.10% | Round-tripped violently: down on Chinese memory and lithography competition fears through Tuesday, up 18.36% Thursday on Microsoft’s capex guide, then down 5.90% Friday as Apple and Amazon both named memory cost as a margin and capex problem. The scarcity that lifts Micron’s pricing is now visibly a tax on its customers. |
| AMD | −8.77% | +122.33% | +170.06% | No company-specific catalyst — AMD fell with the semiconductor complex through Wednesday on AI-capex financing and China-competition fears, then recovered 13.00% Thursday without reporting. Mizuho and Wedbush both raised price targets during the week. The net decline is profit-taking against a 122% year-to-date gain. |
| CAT | −8.32% | +42.23% | +86.02% | Baird cut Caterpillar to Neutral and its target to $900 from $1,200 on Wednesday, arguing that state and local regulatory pushback against data-centre development undermines the power-generation demand narrative that re-rated the stock. Shares fell 6.91% that session. Q2 results are due August 4. |
| DELL | −7.34% | +222.03% | +205.50% | Fell sharply on Tuesday after an Evercore ISI note flagged that Dell’s AI-server revenue is concentrated among its three largest customers, reopening the customer-concentration and server-margin question. No company news followed, and the stock is still up more than 200% year-to-date. |
— Institutional-grade intelligence for serious investors. Apply for membership at join.recessionalert.comC. WEEK’S TOP STORIES -> TOP
Four threads, not eight stories. The AI capital cycle runs through #1, #4 and #5 — a financing scare answered by a spending number, then immediately complicated by the cost of the memory that number buys. Fed policy runs through #2 and #6, where the disagreement inside the committee and the shrinking of what it will tell you are separate problems arriving together. Supply-side cost shocks link #3 and #8: one waterway, one statute, both raising input prices no central bank can address. #7 stands alone, and dissents from all of them.
BULLISH
1. AI Capex: A $250 Billion Vendor Backstop Opened the Week and a $720–745 Billion Hyperscaler Commitment Closed It
The core facts:Monday: Nvidia was reported in early talks to guarantee up to $250 billion of lease and construction financing so OpenAI could take capacity at a SoftBank-led, $500 billion, 10-gigawatt Ohio campus — chips excluded, with a parallel chip-financing negotiation of up to $350 billion. Nvidia fell 4.99%, AMD 5.17%. Tuesday: a Shanghai state-backed firm was reported to have begun mass production of domestic immersion DUV lithography tools; the Kospi fell 10.8% and tripped a circuit breaker, Samsung lost 13.4% and SK Hynix 14.7%, and the PHLX Semiconductor Index booked a fourth straight loss, more than 20% below its June 22 record. Wednesday: the Nasdaq 100 confirmed a technical correction more than 11% below its June peak; KLA fell 10.80% on a record quarter; more than $1 trillion of global chip value was erased across the selloff. Thursday: Microsoft’s Azure accelerated to 43% in constant currency past $100 billion of annual revenue with FY2027 capex guided to $255–260 billion against roughly $220 billion modelled — Micron rose 18.36%, Lam Research 17.98% (its best session since 1999), Applied Materials 14.97% and AMD 13.00%, and Technology gained 5.55%. Friday: Amazon’s AWS grew 37% on revenue clearing $200 billion, and Amazon, Microsoft, Alphabet and Meta together guided to roughly $720–745 billion of 2026 capital projects against about $410 billion spent in 2025. Eaton reported Electrical Americas twelve-month rolling orders up 41% with backlog growth up to 103%, and rose 7.32%. Baird cut Caterpillar to Neutral with a $900 target from $1,200 on state and local pushback against data-centre siting; Caterpillar closed the week down 8.32%.
Why it matters:The week converted the AI trade’s central question from who funds the buildout to how much it costs and whether it earns — and both answers arrived inside five sessions. A 77% year-on-year increase in aggregate hyperscaler capital spending would be a financing problem on its own; what makes it a bullish resolution rather than a bearish one is that Amazon and Microsoft attached accelerating cloud revenue to it, AWS at its fastest in eighteen quarters and Azure accelerating at $100 billion scale. The market spent July pricing a financing constraint and was handed a demand constraint instead. Eaton’s order book is the third-party receipt that the money is landing as signed contracts rather than slides, and copper’s 2.80% weekly gain on grid and data-centre demand is the same trade expressed in a commodity (see the Commodities table in Section B). Two caveats belong on the same page. Amazon explicitly attributed part of its capex raise to memory prices, meaning a share of the increase buys the same capacity dearer — the subject of #4. And the Caterpillar downgrade names the constraint nobody has priced: if municipalities can slow data-centre siting, the power-generation backlog is a political variable, not an engineering one. Meta’s free cash flow collapsing to $784 million on the same capex direction shows the market will pay for this spending only where a revenue line is attached to it.
What to watch:Whether any hyperscaler trims the guided figure at the Q3 reporting round in late October — the first genuine test of whether $720–745 billion is a commitment or an aspiration. Caterpillar’s Q2 results on August 4, for whether management addresses permitting risk directly in its power-generation backlog commentary.
BEARISH
2. Three FOMC Members Dissent for a Hike — the First Unified Three-Way Split Since 2016 — and the Long End Reprices Credibility, Not Policy
The core facts:The FOMC held the target range at 3.50%–3.75% for a fifth consecutive meeting on a 9-3 vote, with Cleveland’s Beth Hammack, Minneapolis’s Neel Kashkari and Dallas’s Lorie Logan all dissenting in favour of a 25 basis point increase — the first same-direction three-way dissent since September 2016. Chair Kevin Warsh: “I asked for a good family fight, and I got one.” The Dow fell 1,152.46 points, or 2.18%, its worst session since April 2025; the S&P 500 lost 1.51% and the VIX rose 13.29% to 20.63. The 30-year Treasury yield surged 12 basis points to 5.21%, a 19-year high, while the 2-year fell 0.6 basis points. Polymarket’s implied probability of a 2026 hike dropped 14 points to 63% on the hold itself. By Friday, Richmond’s Tom Barkin had said there is a “strong case for adding restraint in current policy, taking back some of 2025’s rate cuts”; the 10-year closed at 4.716%, its highest since January 2025, and futures priced the policy rate near 3.8% by October and close to 4% at year-end. The dollar fell 0.47% Wednesday and 0.94% Thursday, breaking below 100, while gold rose on both sessions.
Why it matters:A hold is not a hold when three voters want the opposite direction, and the week’s real information is in the shape of the bond move rather than its size. With the 2-year falling while the 30-year printed a 19-year high, the market is not demanding more compensation for the next twelve months of Fed policy — it is demanding more compensation for holding duration through a decade in which the Fed may tolerate above-target inflation. The dollar’s refusal to bid on the worst equity session since April 2025 corroborates it: rising yields attract capital when they reflect real return and repel it when they reflect inflation compensation, and gold rallying simultaneously points the same way. Across the full week the 2s10s spread steepened from 34 to 45 basis points on a 7.1 basis point decline in the 2-year (see the Volatility & Treasuries table in Section B). The practical consequence for positioning is that the market must now price the committee’s distribution rather than its median — and Barkin, who is not a dissenter, moved the hawkish position from the minority of the vote to the centre of the public argument within three days of it.
What to watch:Whether the dissent bloc holds together at the September 15–16 meeting — three becoming four would make a hike the base case rather than a tail. Whether the 10-year sustains a close above 4.75%, which would take it beyond the entire post-2024 range and force a genuine equity repricing.
UNCERTAIN
3. Hormuz Round Trip: Strike Pause to Omani Transit Plan to Ballistic Missiles to a Saudi Naval Coalition — Five Reversals in Five Sessions
The core facts:Monday: the US and Iran refrained from strikes for a second straight day after thirteen consecutive nights of attacks; WTI fell 8.25% to $81.94 and Brent 6.90%, the steepest one-day drop in months, and Energy was the worst S&P sector at −2.41%. Tuesday: Gulf states backed an Omani proposal under which Iran would collect voluntary transit fees and jointly manage the strait with Oman, modelled on the Strait of Malacca arrangement; WTI settled below $80 at $79.14. Wednesday: the IRGC fired ballistic missiles at the Muwaffaq Salti Air Base and CENTCOM headquarters in Jordan — all intercepted, no casualties — Tehran rejected the Omani proposal, and President Trump said Iran “is going to get a beating.” WTI rose 6.74% and Brent 7.36%; Energy was the only S&P sector to gain. EIA data the same day showed a 7.167 million-barrel commercial crude draw against 1.3 million expected, with the Strategic Petroleum Reserve at 307.7 million barrels, a 43-year low. Thursday: CENTCOM began a “heavy wave” of strikes on dozens of IRGC sites; crude traded above $92 overnight and closed lower after Saudi Arabia proposed a naval coalition to protect shipping lanes. Friday: Iran said it had stopped two vessels exiting Hormuz and turned back four more — unverified — and Brent closed at $87.95, capping a July that gained roughly 23%.
Why it matters:Net of five reversals WTI finished the week down 6.46% and Brent down 10.41%, with the transatlantic spread compressing from $7.74 to $3.36 — which tells you where the risk premium actually sat (see the Energy table in Section B). But the durable finding is the mechanism the week exposed. Iran no longer needs to close the strait to move the price: twice in five sessions an unverified announcement that vessels had been turned back was sufficient. That is a very low-cost lever, and it can sustain a premium indefinitely without inviting the retaliation an actual closure would provoke. Against that, Washington has spent its shock absorbers — commercial crude stocks at 2018 lows and an SPR at a 43-year low remove the non-military lever available in 2022, which means the US can no longer cap the price without escalating. The Saudi naval coalition is the week’s one genuinely new idea, and its significance is that it is a supply-protection mechanism requiring no Iranian consent, which is precisely why the market took it seriously 48 hours after Tehran rejected Oman’s framework. A 23% monthly move in the global benchmark is an inflation event in the same week three FOMC members voted to hike, and it is the variety of price increase monetary policy cannot address.
What to watch:The OPEC+ ministerial on August 2, where roughly a 188 kbpd September increase is expected and a three-month freeze from October has been reported — a larger unwinding of voluntary cuts would be the first genuine bearish supply catalyst in months. Whether the Saudi coalition attracts formal US and Gulf commitments, and whether weekly Hormuz transit counts recover from their depressed levels.
UNCERTAIN
4. The Memory Shortage Stops Being a Windfall and Starts Being a Tax — Apple, Qualcomm and Amazon All Name It as a Cost
The core facts:Wednesday: Qualcomm’s current-quarter guidance was explicitly attributed to memory supply constraints affecting handset OEMs, with QCT pre-tax margin contracting four percentage points to 26% and across-the-board price increases announced for September 1; the shares fell roughly 7% the following session. Thursday: SanDisk gained roughly 26% after Samsung warned the shortage could persist into 2028. Friday: Apple reported record fiscal Q3 revenue of $109.4 billion with iPhone revenue up 22% and gross margin at 50.1%, but Services missed at $30.74 billion against $31.22 billion consensus, and CEO Tim Cook flagged an increasing financial impact from severe global memory-component shortages with September-quarter guidance of 9–11% revenue growth against roughly 12% modelled. Apple fell 7.35%, the largest mega-cap decline of the day. Amazon’s capex raise to roughly $220 billion was attributed by CEO Andy Jassy specifically to the higher cost of memory. On the same session South Korea’s Kospi posted its largest single-day gain in history at +17.9% with SK Hynix locking limit-up — while Micron fell 5.90% in New York.
Why it matters:The same commodity was priced as an asset in Seoul and as a cost in New York on the same day, and that is the cleanest available illustration of a distinction the market spent the whole of July failing to make. Memory scarcity is unambiguously good for whoever makes it and unambiguously bad for whoever buys it — and this week the buyers began quantifying it: a four-point margin contraction at Qualcomm, a September price increase across smartphone silicon, an explicit gross-margin warning from the largest handset OEM in the world, and roughly $20 billion of additional Amazon capital expenditure that buys no additional capacity. That last item is the one with macro consequences, because capex rising on scarce inputs compresses the return on invested capital of the spender even while it flatters the revenue of the supplier. It also puts upward pressure on consumer-electronics prices at a moment when three FOMC members are already voting to hike (see #2). Apple’s arc across the week is the whole story in one name: it reclaimed the most-valuable-company title on Monday and touched $5.036 trillion intraday on Tuesday precisely because it had not committed capital to AI infrastructure, then fell 7.35% on Friday on the price of a component it does not make.
What to watch:Whether other handset, PC and device makers cite memory in guidance over the next fortnight — a pattern would confirm an industry-wide cost shock rather than company-specific execution. Whether Qualcomm’s September 1 price increases hold without volume loss, and whether DRAM and NAND contract pricing confirms the shortage is tightening rather than peaking.
BEARISH
5. The Index Rose and the Market Fell: Four Companies Carried the Week While Eight of Eleven Sectors Closed Friday Red
The core facts:The S&P 500 gained 1.05% on the week to 7,489.80, while the Russell 2000 finished flat at −0.01% and the NYSE Composite added only 0.49%. On Friday alone the S&P rose 0.70% while eight of eleven sectors fell, the Russell dropped 0.49% and the NYSE Composite 0.13%; Amazon at +15.32% and Alphabet at roughly +6.8% did the overwhelming majority of the index work. Thursday’s 1.67% index gain was similarly concentrated — the Nasdaq 100 outpaced the NYSE Composite by more than four to one, and Communication Services (−2.26%), Consumer Defensive (−1.89%), Real Estate (−1.16%) and Healthcare (−1.15%) all closed red, with Eli Lilly −4.55%, Johnson & Johnson −3.66%, Philip Morris −3.25% and Walmart −2.73% sold without company-specific news. The counterpoint came on Tuesday, when the equal-weighted S&P 500 closed at a record high while the Nasdaq 100 fell 0.99% and seven of eleven sectors advanced. July closed with the Dow’s fourth consecutive winning month.
Why it matters:The week contained both configurations forty-eight hours apart, and the sequence is what matters: genuinely broad participation on Tuesday, then concentrated participation from Thursday onward. An investor who owns the index believes they own diversification; from Thursday they owned a leveraged position in hyperscaler capital spending with a thin ballast of everything else. The defensive complement made it worse rather than better, because Thursday’s selling in staples and healthcare was a funding trade — capital raised where it had recently worked in order to be deployed where the momentum now is — which means the hedge is being liquidated by the same flows inflating the position it is meant to hedge. Nothing in the week’s data said anything negative about the 493 names not doing the work, so this describes leadership rather than deterioration. But it is a month-end print, and “the Dow’s fourth consecutive winning month” will be used through August to characterise the condition of a market that is really the condition of four companies inside it.
What to watch:Whether the Russell 2000 and NYSE Composite participate in the next up session — two consecutive index gains without them would mark the narrowness as structural rather than earnings-specific. The equal-weighted S&P against the cap-weighted index remains the cleanest single measure of how much of the advance is real.
UNCERTAIN
6. Warsh Removes Forward Guidance, Then Floats Halving the Meeting Calendar — Three Communication Changes in Two Meetings
The core facts:Wednesday’s post-meeting statement was materially shorter than recent practice and contained no forward guidance at all. At the press conference Warsh defended the leaner format, arguing that pulling back from intensive forward guidance gives markets room to react directly to incoming data rather than to anticipate specific Fed moves, and reiterated that there is “no soft implicit inflation target — only a target of 2 percent.” This was a non-SEP meeting, so no updated dot plot accompanied it. On Friday the New York Times reported, citing people familiar with the matter, that Warsh is considering reducing regularly scheduled FOMC policy meetings from eight a year to four, that he raised the idea at this week’s meeting, and that a decision could land before the September 15–16 meeting. The Fed has held eight scheduled meetings a year since 1981. Separately, on Monday — two days before the decision — President Trump publicly called for lower rates and described the Federal Reserve Board as “very political” while praising Warsh personally.
Why it matters:Removing forward guidance does not make policy hawkish or dovish; it makes policy less predictable, which is a distinct and separately priceable change. Halving the meeting calendar compounds it mechanically: four meetings concentrate the same annual probability of a move into four much larger event windows and lengthen the interval during which the committee cannot respond to data without convening an unscheduled session. That raises implied volatility attached to each remaining date and lowers it in between — a repricing of the entire event-risk calendar, and of the cost of hedging it, long before any rate actually changes. What makes this a week-level story rather than a procedural footnote is the direction of travel: no guidance, no projections, and now fewer decision points, all within two meetings of taking the chair, and arriving precisely when three regional presidents are dissenting for a hike and the long bond sits at levels last seen in 2007. Less transparency during a period of genuine internal disagreement raises the term premium investors demand, which is exactly what the long end did this week (see #2). The presidential pressure two days before the vote adds a second reading to any hold that the Fed has no mechanism to control.
What to watch:Any formal Fed announcement on the 2027 meeting calendar before September 15–16 — that is the stated decision window. Whether the September statement retains the abbreviated format, which would establish it as regime rather than experiment, and whether Fed-date option pricing widens on the remaining dates.
BEARISH
7. The Dow Transports Fell in All Five Sessions Into a 6.5% Drop in Crude — a 7.43-Point Non-Confirmation That Widened Every Day
The core facts:The Dow Jones Transportation Average closed lower in every session of the week — Monday −1.83%, Tuesday −0.80%, Wednesday −1.94%, Thursday −1.74%, Friday −0.24% — finishing at 21,039.3, down 6.39% on the week, while the Dow Jones Industrial Average rose 1.04%. The resulting 7.43-point gap is the widest Dow Theory non-confirmation of the year. It occurred as WTI fell 6.46%, a direct reduction in the sector’s single largest variable cost, and Monday’s 1.83% decline came on a session when crude dropped 8.25%. By Friday the DJIA sat within 2% of its ten-session high while the DJTA remained more than 7% below its own. Searches across the week surfaced no transport-specific catalyst — no sector downgrade, guidance cut, labour action or regulatory event. Thursday’s advance estimate of Q2 GDP printed at 1.5% annualised against a 2.1% consensus.
Why it matters:Transports selling into an eight-percent fuel-cost decline eliminates the cost explanation, and the absence of any company-specific catalyst across five consecutive sessions eliminates the idiosyncratic one. What remains is demand for physical throughput — which is exactly what a Dow Theory non-confirmation is understood to measure: goods are being produced, but the market doubts they are being moved. A single session proves nothing. Five consecutive sessions, widening rather than narrowing, into falling input costs and a GDP print that undershot by 0.6 percentage points, is a different object entirely. The forward implication of 1.5% growth is not recession; it is the removal of the cushion that has allowed this market to tolerate a Fed with three voting members pushing for a hike. At 2%-plus growth, sticky inflation is an inconvenience; at 1.5% it is the first half of a stagflationary configuration, and it raises the cost of a policy error in either direction. The freight tape is the part of this market pricing the real economy rather than the capital-expenditure cycle, and it spent the week disagreeing with the index above it.
What to watch:Whether the DJTA can close back within 5% of its ten-session high in the next fortnight — failure to do so entrenches the non-confirmation. The second estimate of Q2 GDP on August 28 for revisions to the consumer-spending contribution, the component doing all the work in the advance print.
BEARISH
8. Trade Policy Migrates to Instruments the Courts Have Not Struck Down — and a 50% Canada Tariff Lands August 19
The core facts:On Tuesday the FCC released measures barring Chinese imports of new humanoid and quadruped robots along with connected power inverters — the devices linking renewable generation, battery storage and data-centre equipment to the grid — citing supply-chain and cybersecurity risk to critical infrastructure, alongside the GUARD Act framework that would place such systems on the Covered List and strip their wireless licences. The same day, asked whether he would update the USMCA, President Trump replied “I don’t care” and “I’d rather be independent,” adding that “Mexico and Canada need us. We don’t need them.” The US declined at the mandated July 1 joint review to renew the agreement for a further sixteen years, triggering annual reviews until its built-in July 1, 2036 expiry. Three proclamations signed July 20 under Section 338 of the Tariff Act of 1930 — the first-ever use of that authority — impose an additional 50% tariff on lists of Canadian imports spanning motor vehicles, alcohol, dairy and cement, effective August 19 and applying regardless of USMCA origin. On Thursday the presidents of the United Steelworkers and the International Association of Machinists wrote jointly to USTR Jamieson Greer urging reconsideration, stating that “Canada has never been the problem.” Two lawsuits filed July 24 at the Court of International Trade contest the Section 301 forced-labor duties that replaced the struck-down IEEPA regime.
Why it matters:The instrument matters more than the target. A tariff taxes a good and can be absorbed, re-routed or litigated away; a Covered List designation revokes the authorisation to operate a device on US networks, a binary exclusion no price adjustment engineers around — and it rests on communications-security authority rather than the trade authority the courts have twice struck down. Read against a tariff regime now on its third legal iteration in six months, this is the deliberate substitution of a durable instrument for a contested one. Extending it to power inverters is the consequential half, because the binding constraint on the US AI buildout is increasingly electrical rather than computational: removing the cheapest supplier of grid-interconnection hardware raises the delivered cost of every gigawatt of data-centre capacity at exactly the moment the market is asking whether that capacity earns its return (see #1). The August 19 Canada date is the near-term, hard-dated exposure — a 50% duty with no USMCA exemption cuts across integrated North American assembly footprints that cannot be re-sourced in three weeks — and the public opposition of the steelworkers and machinists removes the domestic-labour rationale from it, which materially raises the odds of carve-outs or delay. None of this is currently priced.
What to watch:Any USTR response or Federal Register amendment before August 19 — exemption language for USMCA-originating vehicles is the specific item to look for. Whether the FCC’s final rule reaches inverters already installed rather than only new imports, which would force replacement capital expenditure across existing solar and storage fleets.
— Separating signal from noise since 2007. Apply for membership at join.recessionalert.comD. WEEK IN THE ECONOMY -> TOP
A stagflation pulse: Q2 growth undershot at 1.5% against 2.1% expected while the GDP price index spiked to 6.3% from 3.6%, and Friday’s Employment Cost Index beat at 0.9% with real private-sector wages down 0.4% year-on-year. The disinflation leg is real but narrow — core PCE cooled to 3.3% and headline to 3.7% from 4.1% — and it arrived one day after three FOMC members voted to hike. What the market did with it is the tell: across the week Polymarket’s 2026 hike odds fell 5 points to 67% while cut odds fell 4.4 points to 10.7% and recession odds rose to 13%. The 2-year fell 7.1 bps and the 10-year rose 3.5. Markets removed both the hike and the cut and priced duration instead. Wednesday’s ISM Services PMI, prior 54.0, is the print that resolves whether the activity or the price side is winning.
POLYMARKET ODDS — WEEK-ON-WEEK SHIFT:
| Market | Last Friday | This Friday | Δ |
|---|---|---|---|
| US Recession by end-2026 | 11% | 13% | +2.0 pp |
| Fed rate hike in 2026 | 72% | 67% | −5.0 pp |
| Fed rate cuts ≥1 in 2026 | 15.1% | 10.7% | −4.4 pp |
BEARISH
1. Q2 GDP Slows to 1.5% Against 2.1% Expected While the GDP Price Index Spikes to 6.3% (BEA, Thursday July 30)
What they’re saying:The advance estimate put second-quarter growth at 1.5% annualised against a 2.1% consensus. The shortfall came from a 0.7 percentage point inventory drag and a 0.3% decline in federal spending. The GDP price index — a broader inflation gauge than PCE — surged to 6.3% against 3.6% expected and 3.6% prior. Underlying demand held up far better than the headline: real final sales to private domestic purchasers rose 3.9%. The Atlanta Fed’s first Q3 GDPNow estimate, published the same morning, came in at 5.0%.
The context:Decelerating growth alongside an accelerating price index is the textbook stagflationary print, and it landed one day after the FOMC held with three members dissenting for a hike — which is the least convenient possible sequence for a committee already split. The composition argues against reading it as a demand break: 3.9% growth in private domestic final sales is a solid number, and the drag came from inventories and federal outlays. But the market did not treat it as a growth scare. The Dow Transports fell 1.74% on the print while the Dow rose 1.19%, the 10-year added 5.1 basis points, and Polymarket’s recession odds finished the week only 2 points higher at 13%. The initial Q3 GDPNow reading of 5.0% carries minimal data and should not be read as a forecast.
What to watch:The second estimate on August 28 for whether the 6.3% price index holds — a revision there would materially change the stagflation read. Monday’s ISM Manufacturing PMI (prior 53.3) is the first national activity print of the new quarter.
UNCERTAIN
2. Core PCE Cools to 3.3% and Headline to 3.7% From 4.1%, But Personal Income Growth Slows to 0.2% (BEA, Thursday July 30)
What they’re saying:Core PCE — the Fed’s preferred inflation gauge — rose just 0.1% in June, pulling the annual rate to 3.3% from 3.4% and matching consensus. Headline PCE cooled to 3.7% year-on-year from 4.1%. Personal income rose only 0.2% against a 0.3% forecast and a sharp deceleration from May’s 0.7%, while spending grew 0.3% — the second consecutive month in which outlays outran income. Initial jobless claims for the week ended July 25 rose 9,000 to 197,000, below the 200,000 consensus and only partially unwinding the prior week’s plunge to the lowest level since late 1969.
The context:The timing is what gives this print its weight. Three FOMC members voted on Wednesday for a hike on the argument that inflation is not converging; the following morning the Fed’s own preferred gauge printed four-tenths lower on the headline rate. That does not settle the argument — 3.3% core remains well above a 2% target Warsh has explicitly refused to soften — but it removes the cleanest version of the hawkish case. The bond market’s response is the tell: across the week the 2-year fell 7.1 basis points while the 10-year rose 3.5, meaning investors took the inflation news as marginally reassuring for the next two meetings and irrelevant to the decade. Claims at 197,000 confirm a labour market in “slow hire, slow fire” mode, which removes the other argument for urgency in either direction.
What to watch:Whether core PCE breaks below 3.2% at the next release — that would be the first sustained move toward target since the Middle East conflict began. The personal savings rate, with spending having outrun income for two straight months.
BEARISH
3. Employment Cost Index Beats at 0.9% While Real Private-Sector Wages Fall 0.4% Year-on-Year (BLS, Friday July 31)
What they’re saying:The Q2 Employment Cost Index for all civilian workers rose 0.9% quarter-on-quarter against a 0.8% consensus, with benefit costs up 1.0% and wages and salaries up 0.9%. Total compensation rose 3.4% year-on-year. Inflation-adjusted wages and salaries for private-sector workers fell 0.4% year-on-year over the same period.
The context:ECI is one of the Fed’s preferred gauges of underlying labour-cost inflation, and a beat that arrives with real wages falling is the worst available combination for the two constituencies an equity portfolio depends on. Corporates are paying more per unit of labour, compressing margins in every service and healthcare business where headcount is the dominant cost line and pricing is capped by contract or regulation. Households are simultaneously losing purchasing power, capping the volume growth that would offset it. Compensation running at 3.4% is not consistent with 2% inflation on any standard productivity assumption, which is why the front end moved on the print: the 2-year added 3.7 basis points on Friday, its largest single-session rise of the week, and the 10-year closed at its highest since January 2025. Neither effect is visible in an index driven by four companies whose cost structures are capital rather than labour — which is why this will not show up in the tape until it shows up in guidance.
What to watch:Q3 ECI in late October, and whether real wage growth returns to positive territory in the next monthly earnings data — a second consecutive negative print would materially weaken the consumption outlook into the holiday quarter.
UNCERTAIN
4. The Consumer Signal Reverses Mid-Week: Confidence Hits an Eight-Month Low Tuesday, Michigan Sentiment Beats Friday (Conference Board / ADP / University of Michigan, July 28 and 31)
What they’re saying:Tuesday: Conference Board Consumer Confidence fell to 90.8 in July from 92.2, missing the 92.3 consensus and marking a third consecutive monthly decline, with the Present Situation Index down 3.6 points to 114.9. ADP’s weekly tracker showed private employers adding an average 15,000 jobs a week over the four weeks to July 11, down from 16,500 — a fifth straight deceleration. Friday: final July University of Michigan sentiment rose to 55.2 against a 54.0 consensus and 49.5 prior, a second consecutive monthly gain, with one-year inflation expectations easing to 4.2% from 4.6% and the five-year gauge holding at 3.3%. Michigan nonetheless remains well below last July’s 61.7.
The context:Two survey families pointed in opposite directions inside four sessions, and the resolution favours neither. What settles it is observed spending, which ran against the pessimism all week: Coca-Cola reported 5% global unit case volume growth, Starbucks delivered 8.1% North America comparable sales led by transactions rather than price, and Mastercard posted 12% cross-border volume growth with card-not-present transactions excluding travel running 16–23% into July. Against that, Procter & Gamble reported flat organic sales with volume contributing nothing, and Altria’s Marlboro shipments fell 7.4%. The reconcilable version is a mix shift rather than a downturn — weak on staples volume, resilient on convenience, experience and cross-border transaction — which is consistent with real wages falling 0.4% while nominal spending holds. The easing in one-year inflation expectations is the part the Fed will notice, because expectations anchoring is the argument the hawkish minority has been making against patience.
What to watch:Tuesday’s JOLTS job openings (prior 7.594M) and Wednesday’s ADP Employment Change (prior 98K) as the hard tests of the five-week hiring deceleration. The August preliminary Michigan survey for whether one-year expectations hold below 4.2%.
BEARISH
5. A Non-Dissenting Fed President Makes the Public Case for Reversing 2025’s Cuts (Richmond Fed, Friday July 31)
What they’re saying:Richmond Fed President Tom Barkin said there is a “strong case for adding restraint in current policy, taking back some of 2025’s rate cuts.” The remarks came 48 hours after the FOMC held 9-3 with Hammack, Kashkari and Logan dissenting for a hike, and on the same session as a Chicago PMI beat at 57.6 against roughly 55 expected and the ECI upside surprise. Earlier in the week, former Fed governor Stephen Miran had argued the opposite case on CNBC, calling the current inflation bout “much more likely to be transitory” and attributing recent price pressure to the Iran conflict.
The context:Barkin is the reason this is a week-level story rather than a restatement of Wednesday’s vote. Three dissents tell you the tail of the committee distribution; a fourth voice — one that did not dissent — publicly arguing to unwind last year’s insurance cuts tells you the centre is moving toward the tail. That is a different object, and the curve treated it as one: the 10-year rose more than 6 basis points on Friday to 4.738% intraday, its highest since January 2025, and futures moved to price the policy rate near 3.8% by October and close to 4% at year-end — a path that embeds a hike rather than a cut. Polymarket registered the same conclusion from the opposite side, marking ≥1-cut odds down 4.4 points to 10.7% on the week even as headline hike odds fell 5 points. The market is not pricing tightening; it is pricing the removal of relief.
What to watch:The September 15–16 FOMC meeting and whether the dissent bloc grows to four. Futures-implied probability of a 2026 hike, and whether any additional non-dissenting president adopts Barkin’s framing in the intervening weeks.
— Know the probability before the market prices in the risk. Apply for membership at join.recessionalert.comE. WEEK IN EARNINGS -> TOP
TOP EARNINGS OF THE WEEK
BULLISH
1. Microsoft (MSFT): +21.75% on the week | Azure Accelerates to 43% at $100 Billion Scale — the Rarest Number in Enterprise Software
The Numbers:Fiscal Q4 released AMC July 29. Revenue $90.0B against $87.7B consensus; EPS $4.74 against $4.24 — a 12% earnings beat. Intelligent Cloud revenue $39.31B, up 31.6% year-on-year, against $38.16B expected. Azure grew 43% in constant currency, accelerating from 40% the prior quarter, and passed $100B in annual revenue for the first time. Microsoft 365 Copilot exceeded 30 million paid seats. FY2027 capital expenditure guided to $255–260B against roughly $190B in FY2026 and analyst expectations near $220B. The stock closed Thursday at $451.10, up 15.51%, its best session since 2008 and a record single-day market-value gain of roughly $490B.
The Problem/Win:Acceleration at scale is the win, and it is worth separating from the headline beat. Deceleration is the default expectation for any business at $100B of annual revenue; Azure went from 40% to 43% instead. The 30 million paid Copilot seats matter for a different reason — they convert AI from consumption experiments into recurring per-seat revenue with a renewal cycle attached. The offsetting item is the capex line: $255–260B is roughly 35% above FY2026 and materially above what the sell side had modelled, which compresses free cash flow and lengthens the payback horizon on the build.
The Ripple:The read-through inside the reporting universe was immediate and mechanical. Lam Research had guided its 2026 wafer-fab-equipment industry outlook to “$140 billion with a bias to the upside” hours later and rose 17.98% on Thursday, its best session since 1999; Applied Materials gained 14.97% without reporting at all, and Micron 18.36%. The contrast within the same evening is the sharper signal: Meta guided capex in the same direction and fell 7.95% on a 13% EPS miss with free cash flow of $784 million. Identical spending direction, opposite treatment — separated entirely by whether a cloud revenue line sits alongside it.
What It Means:The valuation question has moved from whether AI revenue is real to whether $255–260B of annual capital expenditure earns an acceptable return on it. Azure at 43% is the strongest available argument that it does; one quarter is not a trend.
What to watch:Azure constant-currency growth next quarter — whether 43% is a trend or a comparison effect. Whether the FY2027 capex figure is reaffirmed at the October report.
BULLISH
2. Amazon (AMZN): +17.00% on the week | AWS Grows 37% at a 39.4% Segment Margin and Quarterly Revenue Clears $200 Billion
The Numbers:Q2 released AMC July 30. Net sales $200.6B, up 20% from $167.7B and beating the $196.5–197.0B consensus — the first quarter above $200B. AWS revenue $42.2B, up 37% against roughly 31% expected and the fastest growth in 18 quarters, on segment operating income of $16.6B against $10.2B a year earlier — a 39.4% margin — and an annualised run rate near $169B. Total operating income rose 43% to $27.5B; operating margin 13.7% against 11.4%. The AI and custom-silicon businesses each cleared run rates above $25B. Q3 operating income guidance of $22.5–26.5B brackets the $24.92B consensus. 2026 cash capex was raised to approximately $220B from about $200B. The stock closed Friday at $271.58, up 15.32%.
The Problem/Win:The margin line is what distinguishes this from a straightforward growth beat. AWS grew 37% and expanded operating margin to 39.4% from roughly 30% a year earlier, which is not the profile of a business buying share with price. CEO Andy Jassy went further, indicating even higher capital expenditure will not be enough to meet demand. The qualification sits in the composition of the capex raise: Jassy attributed the increase from about $200B to roughly $220B specifically to the higher cost of memory, meaning a meaningful share of the extra $20B buys no additional capacity. Capex that rises on input scarcity dilutes return on invested capital even as it flatters supplier revenue.
The Ripple:Consumer Cyclical closed Friday up 4.42%, the best sector of the day, essentially on this one name; Arista Networks gained 5.46% as a direct capex beneficiary. Within the reporting universe the more useful cross-check is Eaton, which reported the same morning with Electrical Americas twelve-month rolling orders up 41% and backlog growth up to 103% — the physical order book underneath the spending commitment, delivered as signed contracts rather than guidance.
What It Means:Two hyperscalers reporting cloud acceleration inside 24 hours converts a single-company narrative into an industry datapoint, and the $25B AI and custom-silicon run rates give it a measurable revenue base rather than an inferred one.
What to watch:Whether AWS holds above 35% growth in Q3 — the level distinguishing acceleration from a single favourable comparison. AWS backlog and remaining performance obligations against the $496B figure disclosed with this print.
BEARISH
3. Apple (AAPL): −7.24% on the week | A Record Quarter Where Every Component of the Beat Is Non-Repeatable
The Numbers:Fiscal Q3 released AMC July 30. Revenue $109.4B, up 16% and edging the $109.04B estimate; diluted EPS $2.02, up 29% against a $1.89 estimate; net profit $29.8B. iPhone revenue rose approximately 22%. Gross margin reached 50.1% against 46.5% a year earlier — roughly two of those 3.6 points came from tariff refunds, which also contributed about $0.11 to EPS. Services revenue of $30.74B grew 12.1% but missed the $31.22B consensus by roughly $480 million. September-quarter guidance calls for 9–11% revenue growth against roughly 12% modelled, with CEO Tim Cook flagging an increasing financial impact from severe global memory-component shortages. The stock closed Friday at $308.91, down 7.35% on the session.
The Problem/Win:Decompose the beat and very little of it survives to next quarter. Two of the 3.6 points of gross-margin expansion and $0.11 of the EPS came from tariff refunds — genuinely favourable, entirely non-recurring. Strip them and a 22% iPhone quarter is still a strong hardware result, but it is a hardware result. The line that carries the multiple went the other way: Services missing at 12.1% growth breaks a streak the market had come to treat as automatic, and Services is the high-margin annuity that justifies valuing Apple as something other than a device manufacturer. Guidance then compounded it — below consensus, with an explicit statement that the supply constraint worsens from here rather than easing.
The Ripple:Within the reporting universe the memory-cost thread connects three prints in three days. Qualcomm named memory supply constraints in guidance on Wednesday and took a four-point QCT margin contraction to 26%, announcing price increases from September 1. Amazon named memory as the reason its capex rose roughly $20B. Apple made it a gross-margin warning. Micron fell 5.90% on Friday in sympathy with the buyer side of that trade rather than the seller side — and Technology was the only major sector to close lower on a day the S&P rose 0.70%, almost entirely on Apple’s decline.
What It Means:The market repriced the quality of the earnings rather than the earnings themselves. Consensus already expects growth to decelerate toward 12% next quarter and into single digits through most of next year, and the memory guidance gives that path a named cause.
What to watch:Whether Services growth reaccelerates above 13% in the September quarter — the line that determines whether this was a timing miss or a trend. DRAM contract pricing, which now flows directly into reported gross margin.
WEEK AHEAD PREVIEW:
Q2 2026 earnings season has passed the halfway mark, with 61% of the S&P 500 reported and blended earnings growth running at +47.4% year-over-year — the highest since Q2 2021.
Palantir Technologies (PLTR) — AMC, Monday August 3 — Consensus is $0.35 adjusted EPS on $1.81 billion of revenue, with Oppenheimer looking for year-over-year revenue acceleration near 85% against the company’s own roughly 79% projection and expecting the annual forecast to be raised above the existing 71% growth benchmark. Key focus: US commercial growth, free cash flow, and whether a government-weighted client base continues to insulate the name from AI-sector volatility — at roughly 71x sales and 113x forward earnings, the valuation leaves no room for a merely adequate print.
Vertex Pharmaceuticals (VRTX) — AMC, Monday August 3 — Consensus is $4.74 adjusted EPS on $3.23 billion of revenue, with the call at 4:30 p.m. ET. Key focus: Trikafta/Kaftrio, where consensus sits near $2.45 billion for the quarter and which still carries the great majority of group revenue, plus any read on the diversification pipeline. Healthcare’s reaction function this season has punished in-line results from premium-multiple names — Stryker fell 5.83% and AbbVie 2.51% on beats this week — which sets a demanding bar.
Marriott International (MAR) also reports Monday before the bell but falls below the $100B market-cap threshold for individual coverage. The balance of the week’s mega-cap calendar is set as Q2 2026 reporting moves into its second half.
— US market commentary trusted by family offices and institutions. Apply for membership at join.recessionalert.comF. NEXT WEEK SETUP -> TOP
UPCOMING RELEASES:
| Date | Event | Why It Matters |
|---|---|---|
| Mon, Aug 3 | ISM Manufacturing PMI (HIGH) — prior 53.3 | The first national activity print of the new quarter, and the arbiter of a divergence that ran all July: Dallas Fed hit a five-month high while national durable goods orders rose just 0.3% against a 2.5% consensus. |
| Mon, Aug 3 | ISM Manufacturing Employment (MEDIUM) — prior 49.7 | Sub-50 means factory payrolls are still contracting. A second month below the line would put a goods-sector jobs signal underneath the five-week hiring deceleration ADP has been tracking. |
| Tue, Aug 4 | Balance of Trade (MEDIUM) — prior −$77.6B | Trade subtracted from Q2 growth and the June goods gap narrowed on falling imports rather than export strength. This is also the first full month under the Section 301 duties that took effect July 24. |
| Tue, Aug 4 | Exports (MEDIUM) — prior $317.7B | The retaliation read. Watch for early evidence of EU or Chinese responses to the forced-labor tariff regime showing up in shipped volumes. |
| Tue, Aug 4 | Imports (MEDIUM) — prior $395.3B | A rise would suggest pull-forward ahead of the August 19 Section 338 Canada duties; a fall confirms the demand-side read that narrowed June’s deficit. |
| Tue, Aug 4 | Factory Orders MoM (MEDIUM) — prior −1.3% | Core capital-goods orders rose 11.0% year-on-year in June, the fastest since March 2022, entirely on computers and electronics. This shows whether AI-linked capex is still masking softer traditional manufacturing. |
| Tue, Aug 4 | JOLTs Job Openings (HIGH) — prior 7.594M | The cleanest hard test of the labour-cooling thread. Openings falling with claims still near five-decade lows would confirm the “slow hire, slow fire” characterisation rather than an actual downturn. |
| Wed, Aug 5 | MBA 30-Year Mortgage Rate (MEDIUM) — prior 6.76% | The transmission channel from Friday’s 10-year close at a January-2025 high into household financial conditions. Rates here follow the long end, not the funds rate. |
| Wed, Aug 5 | ADP Employment Change (MEDIUM) — prior 98K | The monthly print against which ADP’s own weekly tracker — five consecutive weeks of decelerating hiring — is either confirmed or written off as noise. |
| Wed, Aug 5 | ISM Services PMI (HIGH) — prior 54.0 | The week’s decisive print. Services is where the activity read and the prices-paid read arrive together, which makes it the release that resolves whether Q2’s 1.5% growth or its 6.3% price index is the better guide to the second half. |
WHAT TO WATCH NEXT WEEK:
1. Does Wednesday’s ISM Services PMI break the stagflation tie? Q2 growth undershot at 1.5% while the GDP price index spiked to 6.3%. Services PMI carries both the activity and the prices-paid read in a single release, which makes it the one print capable of telling you which half of that pair the second half belongs to.
2. Do the transports confirm, or recant? The Dow Transportation Average fell in all five sessions into a 6.5% decline in crude and no identifiable sector catalyst. Tuesday’s JOLTS and Wednesday’s ADP are the first labour reads that could corroborate a genuine freight-demand slowdown rather than a positioning quirk.
3. Does the memory shortage escape the guidance section and reach prices? Qualcomm’s across-the-board increases take effect September 1 and Apple has said the constraint worsens into the September quarter. Whether other device makers name it over the next fortnight determines if this is an industry cost shock or three companies with the same excuse.
4. Does anyone join Barkin? Three dissents mark the tail of the committee; a non-dissenting president arguing publicly to unwind 2025’s cuts marks the centre moving toward it. A fourth such voice before September 15–16 would take a hike from tail risk to base case, with futures already near 4% at year-end.
5. Can the index rally without the four? Amazon, Alphabet, Microsoft and Apple set the tape all week while the Russell 2000 finished flat and the NYSE Composite trailed. Two more up sessions without small caps and the broad composite participating would make the narrowness structural rather than an artefact of earnings week.
— US market commentary trusted by family offices and institutions. Apply for membership at join.recessionalert.comG. CHART OF THE WEEK -> TOP
WHY THIS CHARTMonday’s chart won over Tuesday’s 60/40 study and Thursday’s GDP decomposition because it posed, on day one, the precise question the following four sessions went on to answer — and it named the very companies that would answer it. It measures how much of the index’s 2026 return the AI complex has actually delivered, which is the same arithmetic that let the S&P finish the week up 1.05% while the Russell 2000 finished flat and eight of eleven sectors closed Friday red.
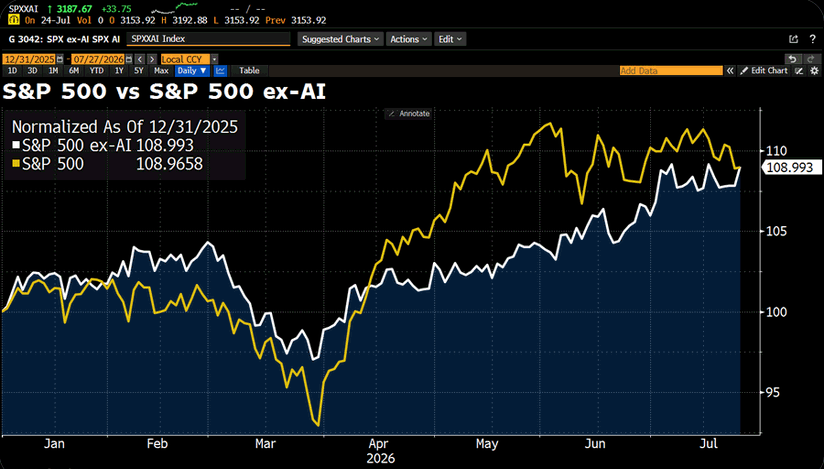
ORIGINAL CHART ANALYSIS — FROM MONDAY’S MIBAI’s contribution to the S&P 500’s 2026 return has gone to zero and just crossed into negative — a regime marker, not a rounding error. Seven months, roughly nine percent, and every basis point of it belongs to the other ~490 names. The mechanism is a sign flip on capex. Guidance that in 2024 read as a demand signal now reads as a claim on free cash flow — every incremental dollar of guided spend compresses the multiple instead of extending it, which is why 23 July erased near $780bn from the Magnificent 7 in a single session. Microsoft at roughly -20% and Meta at -12% are multiple stories, not demand stories. Owning that risk paid nothing. Roughly three points worse at the March trough, five better at the May peak, level today — all of the variance, none of the premium. The unwind arrived as a handoff, not a crash. Equal weight runs more than two percentage points ahead of cap weight and closed the first half up 12.1%, with financials, healthcare, industrials and the small-cap tail absorbing the flow the megacaps gave up. The concentration risk everyone underwrote resolved without the accident. Microsoft, Meta, Amazon and Apple report within days. Three years of index performance were an AI story; the next quarter decides whether that sentence needs a past tense — or an obituary.
MIB Weekly Digest Ver. 1.78
For professional investors only. Not investment advice.
© 2026 RecessionALERT.com

Comments are closed.