
MARKET INTELLIGENCE BRIEF (MIB)
Tuesday, May 19, 2026
30-year Treasury yield hit 5.198% — a 19-year high — sending equities to a third straight loss as markets reprice US fiscal credibility. Trump confirmed one hour from Iran strike; Gulf allies intervened as IEA warns emergency reserves nearly exhausted. Fed Governor Waller flagged rate-hike risk; April FOMC minutes (4-way dissent, most since 1992) release Wednesday 2 PM ET. SNDK +3.77% on 60% EPS beat and 233% data-center surge; NVDA Wednesday AMC. Redbook same-store sales fell to 8.1% YoY; $4.50 gasoline bites.
TABLE OF CONTENTS
A. EXECUTIVE SUMMARY
B. MARKET DATA
C. HIGH-IMPACT STORIES (5)
D. MODERATE-IMPACT STORIES (5)
E. ECONOMY WATCH (5)
F. EARNINGS WATCH (1)
G. WHAT’S NEXT
H. CHART OF THE DAY
A. EXECUTIVE SUMMARY -> TOP
US equities logged a third consecutive losing session as the 30-year Treasury yield breached 5.19% — its highest close since 2007 — reflecting bond market repricing of long-term US fiscal sustainability rather than near-term Fed rate expectations. Fed Governor Waller’s hawkish remarks at the Hoover Institution, combined with Wednesday’s release of the historic April FOMC minutes (the most internally divided Fed vote since 1992), kept rate-hike odds elevated and compressed equity risk premiums on long-duration growth names. Gold’s -1.50% decline on a risk-off day — confirming rising real yields are dominating safe-haven demand — sealed the regime interpretation: this is a real-yield shock, not a growth collapse. Sector rotation was textbook defensive: Healthcare, Energy, and Utilities advanced while Basic Materials (-2.50%) deepened a structural weekly collapse of -8.34%; the Russell 2000 underperformed the S&P 500 by 35 bps as rising domestic credit costs hit small caps disproportionately.
• 30Y at 5.198% (19-yr high), 10Y +6 bps to 4.687%: S&P -0.67%, Nasdaq -0.84%, Dow -0.65% — third consecutive session of losses, approximately 2% off last week’s record highs; term-premium expansion signals fiscal deficit anxiety, not a near-term Fed pivot.
• Earnings highlights: SNDK +3.77% on 60% EPS beat and 233% sequential data-center revenue surge; LLY +3.37% on Q1 EPS +22.67% beat; NVDA Q1 FY2027 reports Wednesday AMC — the week’s pivotal AI hardware demand validation event.
• Iran near-miss: Trump confirmed he was “one hour away” from ordering a military strike before Gulf allies (Saudi Arabia, Qatar, UAE) intervened for a 2–3 day ceasefire window; Brent -0.7% to $111.28 but IEA warns only weeks of global emergency oil reserves remain.
• Fed policy: Governor Waller flagged rate-hike risks as live at Hoover Institution panel; April FOMC minutes (4-way dissent — most since 1992) release Wednesday 2:00 PM ET; front-end rates and hike probabilities will re-price in real time on the hawkish/dovish inflation characterization.
• Consumer stress accelerating: Redbook same-store sales decelerated from 9.6% to 8.1% YoY — the sharpest weekly drop of 2026; Michigan consumer sentiment sits at 48.2 (historic low); Home Depot Q1 guidance cited “greater consumer uncertainty and housing affordability pressure.”
• Semiconductor complex bifurcates: AI memory names (MU +2.52%, INTC +2.45%) diverged sharply from yield-pressured chips (QCOM -3.94%, AVGO -2.27%) — institutional pre-positioning ahead of NVDA’s data-center demand guidance confirms rotation within the complex, not an exit from AI hardware.
1. Fiscal Anxiety Is Now the Dominant Market Force — The 30Y breaching 5.20% marks a qualitative shift: the bond market is no longer solely pricing near-term Fed policy but repricing long-term US fiscal credibility. With foreign official institutions net selling Treasuries, Q2 borrowing $79B above plan, and the Moody’s downgrade backdrop, term-premium expansion is structural. Every investment-grade issuer rolling H2 2026 debt faces materially higher coupons; as the 30Y approaches 5.25%, the equity risk premium over long-duration bonds narrows toward the threshold at which institutional reallocation from equities to bonds becomes mechanically justified.
2. Oil Shock + Rate Shock = Stagflation Trap Deepening — Tuesday’s session crystallized the dual-pressure environment: the Iran near-miss confirmed oil will stay at $108–112+ as long as Hormuz remains closed (IEA emergency reserves nearly exhausted, eliminating the traditional disruption buffer), while the real-yield spike simultaneously squeezes growth multiples. The Fed is trapped: cutting into 3.8% CPI and a 30Y above 5.20% would destroy credibility, while holding amplifies the demand deceleration visible in Redbook’s 150-bps weekly plunge and Michigan sentiment at a historic low of 48.2.
3. AI Hardware Trade Survives — But Stock Selection Is Now Mandatory — Even on a -0.67% S&P tape with the 30Y spiking, SNDK’s 233% sequential data-center revenue surge and MU’s +2.52% recovery confirm that institutional conviction in AI capex spending remains intact. The bifurcation — AI storage/HBM names rallying while yield-sensitive or AI-peripheral chips (QCOM, AVGO) sell off — signals a mature trade: broad semiconductor exposure no longer captures the AI premium. NVDA’s Wednesday AMC earnings are the session that either validates this selective framework or resets it entirely.
B. MARKET DATA -> TOP
Fiscal concerns drove Treasury yields to multi-year extremes Tuesday — the 30-year breached 5.19%, its highest since 2007 — triggering a defensive rotation that left six of 11 sectors red while Healthcare, Energy, and Utilities caught the safety flow. The selloff was disciplined, not panicked: the S&P 500 lost 0.67%, with small caps (Russell 2000 -1.02%) underperforming large caps as domestic credit costs rose disproportionately. The session’s sharpest signal came inside semiconductors — SNDK surged +3.77% on a 60% EPS beat and 233% sequential data-center revenue surge while QCOM shed -3.94% — splitting the chip complex on fundamentals inside a macro headwind. Gold’s -1.50% drop sealed the interpretation: rising real yields, not safe-haven demand, are driving the tape.
CLOSING PRICES – Tuesday, May 19, 2026:
MAJOR INDICES
Major indices fell in near-lockstep on yield pressure, but breadth signals diverge sharply. Dow Theory bull confirmation extends into a second consecutive session: both DJIA and DJTA remain within 2% of their 10-session highs (DJIA -1.40% below, DJTA -1.01% below) — a structural positive. Yet the Russell 2000’s -1.02% underperformance is the tell: SP500 has now outperformed RUT by 4.74% over the past 10 sessions, with narrow mega-cap leadership persisting for a third consecutive session — a breadth warning that cuts directly across the bull confirmation signal.
| Index | Close | Change | %Move | Why It Moved |
|---|---|---|---|---|
| S&P 500 | 7,353.77 | -49.28 | -0.67% | Yield surge (10Y to 4.661%, 30Y near 19-yr high) triggered defensive rotation; growth/cyclicals led declines, six of 11 sectors red |
| Dow Jones | 49,364.31 | -321.81 | -0.65% | Blue-chips fell in lockstep with S&P; yield pressure on financial and industrial names offset by defensives holding up |
| DJ Transportation | 20,161.1 | -55.7 | -0.28% | Modest decline; transports less yield-sensitive than growth names; remained within 2% of 10-session high — Dow Theory still intact |
| Nasdaq 100 | 28,818.84 | -175.52 | -0.61% | Mega-cap tech headwind from long-end yield surge; chip complex split — AI-exposed names (SNDK) rallied while yield-pressured semis (QCOM) sank |
| Russell 2000 | 2,746.69 | -28.41 | -1.02% | Small caps bore disproportionate pain from rising domestic credit costs; 10-session underperformance vs S&P now at -4.74% — breadth deteriorating |
| NYSE Composite | 22,797.67 | -102.90 | -0.45% | Broad-market decline across growth/cyclical universe; slightly less than S&P on NYSE’s heavier defensive weighting |
VOLATILITY & TREASURIES
The 10-year’s +3.7 bps rise to 4.661%, with the 30-year breaching 5.19% — its highest since 2007 — is a long-end problem, not a recession warning. The 2Y climbed only +1.6 bps, producing curve steepening that signals term-premium expansion and fiscal deficit anxiety rather than near-term Fed repricing. The DXY barely moved (+0.13%), confirming no classic safe-haven dollar bid — the bond market is pricing US fiscal risk, not growth collapse.
| Instrument | Level | Change | Why It Moved |
|---|---|---|---|
| VIX | 18.07 | +0.25 (+1.40%) | Mild fear uptick; equities retreating orderly, not crashing — cautious positioning, not panic |
| 10-Year Treasury Yield | 4.661% | +3.7 bps | Fiscal deficit concerns drove long-end higher; 30-year at 5.19% (near 19-yr high) amplified duration pressure on equities |
| 2-Year Treasury Yield | 4.105% | +1.6 bps | Short end rose less than long end → curve steepening; reflects term-premium expansion, not near-term Fed rate repricing |
| US Dollar Index (DXY) | 99.32 | +0.13 (+0.13%) | Marginal USD strength; no classic safe-haven surge — fiscal skepticism tempered the dollar bid despite risk-off equities |
COMMODITIES
Gold’s -1.50% drop on a risk-off day is the session’s most counterintuitive signal — safe-haven demand couldn’t overcome rising real yields at 4.661%. Silver’s -4.20% collapse adds an industrial-demand concern on top of the yield pressure; copper’s -1.88% corroborates the growth-fear read. Bitcoin’s +0.09% near-flat close decoupled from both equity weakness and precious-metals stress, suggesting no broad flight-to-alternatives positioning.
| Asset | Price | Change | %Move | Why It Moved |
|---|---|---|---|---|
| Gold | $4,489.75/oz | -$68.25 | -1.50% | Rising real yields (10Y at 4.661%) compressed non-yielding gold’s appeal; safe-haven bid failed to materialize despite risk-off equities |
| Silver | $74.190/oz | -$3.254 | -4.20% | Double headwind: rising yields removed monetary premium and industrial demand concerns weighed on silver’s hybrid metal status |
| Copper | $6.1970/lb | -$0.1185 | -1.88% | Industrial demand concerns; growth-sensitive metal sold off alongside cyclical equities on fiscal/yield anxiety |
| Platinum | $1,930.55/oz | -$46.85 | -2.37% | Precious metals broad selloff on yield pressure; industrial auto-catalyst demand concerns added to the decline |
| Bitcoin | $76,970.0 | +$66.0 | +0.09% | Near-flat; decoupled from equity weakness and precious-metals selloff — no macro directional signal |
ENERGY
WTI barely moved (-0.05%) after Trump postponed a planned Iran military strike, while the Energy sector outperformed the tape (+0.57%), confirming OPEC structural support absorbed the geopolitical relief. Natural gas split on different drivers: Henry Hub (+3.11%) surged on weather cooling demand and EQT supply curtailments; Dutch TTF (+2.63% in USD) spiked on Qatar LNG supply disruption — same direction, wholly different catalyst. The tight WTI/Brent spread ($6.90) confirms the crude story remains global, not regional.
| Asset | Price | Change | %Move | Why It Moved |
|---|---|---|---|---|
| Crude Oil (WTI) | $104.33/bbl | -$0.05 | -0.05% | Essentially flat; Trump postponed planned Iran attack (removing geopolitical spike risk); OPEC discipline provided structural floor |
| Crude Oil (Brent) | $111.23/bbl | -$0.87 | -0.78% | Iran postponement removed geopolitical premium; tight WTI/Brent spread ($6.90) confirms disruption risk is global, not regional |
| Natural Gas (Henry Hub) | $3.118/MMBtu | +$0.094 | +3.11% | Hotter weather forecasts boosted electricity cooling demand; EQT production curtailments tightened US supply near 7-week highs |
| Natural Gas (Dutch TTF) | $17.62/MMBtu | +$0.45 | +2.63% | Qatar LNG supply disruption (~20% of global LNG affected) raised European winter storage refill fears; distinct from US weather driver |
S&P 500 SECTORS
Textbook defensive rotation: Healthcare (+0.83%), Energy (+0.57%), and Utilities (+0.49%) caught the yield-driven safety flow; Technology, Communication Services, Industrials, and Basic Materials absorbed the duration-selling brunt. Healthcare’s reversal is the session’s most telling signal — today’s top sector carries the quarter’s worst score (-6.67% 3M, -4.20% YTD), confirming tactical flight into undervalued defensives rather than a structural re-rating. Basic Materials deepens its structural collapse: -2.50% today extends an -8.34% weekly and -7.64% monthly deterioration.
| Sector | 1-Day | 1-Week | 1-Month | 3-Month | 6-Month | YTD | 12-Month |
|---|---|---|---|---|---|---|---|
| Healthcare | +0.83% | -0.05% | -1.84% | -6.67% | -1.99% | -4.20% | +12.66% |
| Energy | +0.57% | +4.29% | +8.36% | +13.99% | +33.03% | +36.26% | +45.77% |
| Utilities | +0.49% | -2.75% | -4.56% | -3.30% | +0.92% | +4.45% | +12.26% |
| Consumer Defensive | +0.27% | +1.90% | +4.51% | -0.57% | +13.64% | +12.15% | +8.80% |
| Real Estate | +0.23% | -1.51% | -1.90% | +0.56% | +5.76% | +7.19% | +4.64% |
| Technology | -0.60% | -0.51% | +8.55% | +17.60% | +14.88% | +15.69% | +40.69% |
| Financial | -1.07% | -1.04% | -2.70% | -3.02% | +0.45% | -4.00% | +6.41% |
| Consumer Cyclical | -1.15% | -2.75% | -3.60% | -1.38% | -1.73% | -3.98% | +4.74% |
| Industrials | -1.26% | -3.39% | -3.50% | -3.08% | +13.89% | +10.69% | +21.90% |
| Communication Services | -1.47% | -0.04% | +3.60% | +11.00% | +14.09% | +6.75% | +36.72% |
| Basic Materials | -2.50% | -8.34% | -7.64% | -7.33% | +20.25% | +10.68% | +40.69% |
TOP MEGA-CAP MOVERS:
GAINERS
| Company | Ticker | Close | Change | Why It Moved |
|---|---|---|---|---|
| Sandisk Corp | SNDK | $1,383.29 | +3.77% | Q3 FY2026 earnings: EPS beat by 60%, revenue beat by 26%; data center segment +233% sequentially on AI flash storage demand |
| Lilly (Eli) & Co | LLY | $1,021.41 | +3.37% | Q1 2026 earnings beat: EPS +22.67% vs est., revenue +12.5%; healthcare defensive rotation amplified the earnings-driven bid |
| Micron Technology Inc | MU | $698.74 | +2.52% | AI/data center demand halo from SNDK blowout; flash memory complex rallied on confirmation of accelerating AI storage investment |
| Intel Corp | INTC | $110.82 | +2.45% | AI/data center demand signal from SNDK results lifted chip sector sentiment; Intel benefiting from broader AI infrastructure narrative |
| AbbVie Inc | ABBV | $213.76 | +2.08% | Healthcare defensive rotation; large-cap pharma caught yield-driven safety flow alongside LLY; sector rose +0.83% on the session |
DECLINERS
| Company | Ticker | Close | Change | Why It Moved |
|---|---|---|---|---|
| Qualcomm Inc | QCOM | $195.61 | -3.94% | Rising bond yields pressured high-multiple chip names; analyst concerns over declining sales forecasts and mobile chip competition |
| Cisco Systems Inc | CSCO | $115.41 | -2.92% | Profit-taking after May 14 all-time high following blowout Q3 earnings; yield-driven tech rotation accelerated the pullback |
| Oracle Corp | ORCL | $181.46 | -2.76% | Tech/software selloff; long-end rates at multi-year highs weigh on growth multiples; yield-driven duration selling |
| Alphabet Inc | GOOGL | $387.75 | -2.32% | Communication Services -1.47% on session; yield pressure on high-multiple growth names; macro headwind across mega-cap tech |
| Broadcom Inc | AVGO | $411.16 | -2.27% | Semiconductor yield pressure; broad chip/tech selloff despite AI demand tailwind; offset by SNDK/MU divergence confirms stock-specific split |
C. HIGH-IMPACT STORIES -> TOP
BEARISH
1. 30-Year Treasury Breaches 5.198% — Highest Since 2007; 10-Year Surges +6 bps to 4.687% as Fiscal Anxiety Accelerates Rate Repricing
The core facts:The 30-year Treasury yield breached 5.198% on May 19, its highest level since 2007 — a near 19-year high. The 10-year yield surged +6 basis points to 4.687%, its highest level since January 2025, as the long end of the curve led a broad fixed-income selloff. The yield curve steepened further, with the long end rising faster than the front end — a textbook term-premium expansion signal driven by fiscal deficit anxiety rather than near-term policy repricing. The moves pushed the third consecutive session of equity losses: S&P 500 -0.7%, Nasdaq -0.84%, Dow -0.65%. Mortgage rates and corporate borrowing costs repriced immediately in response. The 5.198% 30-year level marks a structurally significant threshold — the last time the 30Y was this high, it preceded a housing market collapse.
Why it matters:The 30Y breaking 5.20% signals that the bond market is no longer just repricing near-term Fed policy — it is repricing long-term US fiscal sustainability. The combination of the TIC data released Monday (foreign official institutions net selling $14.9B Treasuries), Treasury Q2 borrowing $79B above plan, and now a 30Y at a 19-year high represents a compounding sovereign credibility signal. For equity markets, the 30Y at 5.2% has three distinct effects: (1) Mortgage rates will cross 7.5% within weeks, suppressing residential transaction volumes and homebuilder order rates that the May 18 NAHB beat hinted were stabilizing; (2) Corporate debt refinancing costs rise at the long end — every investment-grade issuer rolling debt in H2 2026 faces materially higher coupons; (3) The equity risk premium narrows as risk-free 30Y returns approach levels that justify defensive bond allocation over equity for pension funds and insurance companies. The equity market’s third consecutive down session directly reflects this repricing in real time.
What to watch:30Y yield for a sustained move above 5.25% as the structural break level that historically triggers institutional duration rebalancing at scale; the upcoming 20Y and 30Y Treasury auctions for bid-to-cover ratios and direct/indirect bidder percentages as the real-time fiscal demand signal; 30-year fixed mortgage rate for its first print above 7.5%.
UNCERTAIN
2. Trump Was “One Hour Away” From Ordering Iran Strike Before Gulf Allies Intervened — Brent Eases -0.7% to $111.28 But IEA Warns Only Weeks of Emergency Oil Supply Remain
The core facts:Senior US officials confirmed on May 19 that President Trump was approximately one hour away from ordering a military strike against Iran before Gulf allies — Saudi Arabia, Qatar, and the UAE — intervened and requested a 2–3 day pause for ceasefire negotiations to progress. Trump posted via social media that the delay was a courtesy to Gulf partners citing proximity to a deal, but simultaneously reaffirmed that military action remains “on a moment’s notice” if an acceptable agreement is not reached. Brent crude eased -0.7% to settle at $111.28/bbl; WTI finished near flat at approximately $108.21/bbl. Despite the slight daily retreat, oil prices remain up over 20% for the month. Concurrently, the International Energy Agency issued an explicit warning that global commercial oil inventories are depleting rapidly — with only weeks of emergency supply remaining — due to the sustained Strait of Hormuz closure.
Why it matters:The “one hour away” disclosure fundamentally changes the market’s probability assessment of near-term military escalation. What was priced yesterday as a postponement is now revealed to have been an eleventh-hour intervention — the strike was authorized and seconds from execution. This raises the “tail risk” probability estimate for an eventual strike: if Gulf allies can stop it once, they may not be able to stop it again if talks fail. The IEA’s warning of “only weeks of emergency supply remaining” from global reserves compounds the severity: if talks break down and a strike occurs after reserves are depleted, the resulting price spike would be far more severe than if reserves were full. The structural oil problem has three compounding dimensions: (1) The Hormuz blockade continues regardless of US strike decisions — every day without a deal is another day of supply destruction; (2) Global emergency reserves are being drawn down toward zero, eliminating the traditional buffer that softens supply-disruption spikes; (3) Oil at $108–112/bbl is already embedding June CPI and summer gasoline prices that complicate the Fed’s inflation path. Brent falling -0.7% today is noise against a +20% monthly backdrop.
What to watch:The 2–3 day Gulf ceasefire window (May 21–22) as the next critical escalation/de-escalation binary; any IEA announcement on coordinated emergency reserve release as the primary policy tool to buy diplomatic time; Brent crude for a sustained break above $115 as the next market stress threshold.
BEARISH
3. Fed Governor Waller Flags Continued Interest Rate-Hike Risks at Hoover Institution Policy Panel — FOMC April Minutes Due Wednesday Preview Historic 4-Way Dissent
The core facts:Federal Reserve Board Governor Christopher Waller participated in a panel discussion at the Hoover Institution Monetary Policy Conference in Stanford, California, where he underscored the risk of sticky consumer inflation and signaled that the FOMC is actively considering the necessity of further interest rate hikes rather than cuts as energy shocks ripple through the economy. Analysts interpreted the remarks as the Fed’s most direct rate-hike signal since the tightening cycle ended in 2023. Waller’s comments come two days ahead of the release of the April 29 FOMC meeting minutes (due Wednesday May 20 at 2:00 PM ET) — the same meeting that produced 4 dissents, the most since October 1992. The dissents split sharply: one member (Miran) voted to cut, while three (Hammack, Kashkari, Logan) opposed the easing-bias language, voting for a tighter stance.
Why it matters:Waller’s Hoover conference remarks represent meaningful Fed communication that the tightening option is live — not as a theoretical scenario, but as something the FOMC is actively deliberating. This is qualitatively different from the standard “data dependent” language that markets had grown accustomed to. The Wednesday minutes release will be the most closely watched Fed document since the 2022 rate-hike cycle — markets will scan for: (1) Whether the majority acknowledged oil-driven inflation as “transitory” (dovish read — rates stay on hold) or as “upside risks that predominate” (hawkish read — rate-hike probability surges); (2) Whether any voting member explicitly endorsed a hike at a subsequent meeting; (3) Whether the 4-way dissent reflects isolated policy disagreement or a broader internal paradigm shift about the Fed’s inflation reaction function. For new Chair Warsh, the April minutes are his inherited policy record — every word will be read as the baseline from which his June FOMC leadership departs. Front-end yields would reprice immediately on either signal from the Wednesday release.
What to watch:FOMC April minutes Wednesday May 20 at 2:00 PM ET — specifically the characterization of inflation risks (transitory vs. upside-biased) and any explicit dissent reasoning about future rate path; CME FedWatch September 2026 FOMC hike probability as the real-time market verdict on the minutes’ hawkishness; Warsh’s first public post-minutes statement as the definitive new-chair policy framing.
BEARISH
4. Materials Sector Worst Performer at -2.1% — Gold -1.5% to $4,501, Copper -1.88%, Silver -4.20%; Precious and Industrial Metals Face Yield-Driven Structural Reset
The core facts:The S&P 500 Materials sector fell -2.1% on May 19, making it the session’s worst-performing sector and extending its brutal weekly decline of -8.34% — the worst weekly performance of any S&P 500 sector. Gold fell -1.5% to approximately $4,501.60/oz, dragging mining heavyweights including Newmont lower. Copper fell -1.88%, signaling deteriorating global industrial demand expectations. Silver declined -4.20%, extending Monday’s -10.51% collapse. Over three months, Materials is down -7.33%, making it the worst-performing S&P 500 sector across all measurement horizons. The selloff is coinciding with the 30Y Treasury yield at 5.198% and the 10Y at 4.687% — rising real yields systematically destroy the monetary metal premium embedded in gold and silver prices.
Why it matters:The materials sector’s systematic destruction across multiple time horizons is sending a compound signal about the macro environment. Two distinct forces are compressing metals simultaneously: (1) Real yield expansion — gold and silver are non-yielding assets; as risk-free yields rise toward 5% on the 30-year, the opportunity cost of holding zero-yield precious metals increases mechanically, compressing monetary metal premiums; (2) Industrial demand deterioration — copper’s -1.88% decline signals that global growth and industrial activity expectations are softening even as headline activity data (GDPNow, Empire State) appears strong — the tariff front-running that inflated recent data is recognized as masking underlying demand weakness. For portfolio managers: Materials sector holdings in equity portfolios face continued structural headwinds from both the yield and growth channels simultaneously. Commodity-linked equities (NEM, FCX, AA, CLF) face earnings estimate cuts as metal prices compress margins. The gold/silver ratio widening further from already-extreme levels suggests silver’s industrial demand component is being systematically repriced lower — a consistent signal from precious metals that the global growth outlook is more fragile than US headline data implies.
What to watch:Gold for a sustained break below $4,450 as the next technical support level for gold miners’ reserve valuations; copper for confirmation of sub-$4.50/lb as a global industrial demand recession signal; Materials sector ETF (XLB) weekly close as the benchmark for the magnitude of the sector’s structural underperformance.
BEARISH
5. Nasdaq -0.84% — Third Straight Session: AMZN, META, TSLA Each Fall ~2% as 30-Year Yield Compresses Long-Duration Tech; S&P -0.7%, Dow -0.65%
The core facts:The Nasdaq Composite fell -0.84% to 25,870.71, the S&P 500 fell -0.7% to 7,353.61, and the Dow fell -0.65% to 49,363.88 — marking the third consecutive losing session and a pullback of approximately 2% from the record highs reached the prior week. The decline was broad but concentrated in premium-valued AI infrastructure and mega-cap technology: Amazon (AMZN, ~$2T), Meta Platforms (META, ~$1.5T), and Tesla (TSLA, ~$600B+) each fell approximately -2%. The catalyst was risk-off rotation driven by the 30-year yield hitting 5.198% — the highest since 2007 — which mechanically compresses the present value of all long-duration assets by raising the discount rate applied to out-year cash flows. The Dow outperformed relative to the Nasdaq (-0.65% vs -0.84%), reflecting continued rotation from growth into value and cyclicals.
Why it matters:Three consecutive sessions of losses following record highs is a meaningful technical pattern, but the more important signal is the internal composition of the decline. AMZN, META, and TSLA falling ~2% each on a single day from the 30Y yield spike reflects how vulnerable premium-multiple AI infrastructure names are to duration risk in the current environment. AMZN at ~30x forward earnings and META at ~25x are no longer pure defensive/value names — they are growth stocks whose valuations are highly sensitive to risk-free rate alternatives. As the 30Y approaches 5.25%, the equity risk premium for holding AMZN over a 30Y Treasury at 5.2% diminishes to single digits for certain allocation frameworks. For large institutional holders (pension funds, sovereign wealth funds), this creates reallocation pressure from long-duration equities toward investment-grade bonds. The Dow’s relative outperformance confirms the rotation thesis: value/cyclical stocks (financials, energy, industrials) benefit from the inflationary environment while pure growth suffers. If the 30Y sustains above 5.2%, expect the Nasdaq’s underperformance vs. Dow to deepen over coming sessions.
What to watch:Nasdaq/Dow spread as the real-time growth-vs.-value rotation gauge; AMZN and META next quarterly earnings for AI capex commentary that could re-anchor growth-stock investor confidence; S&P 500 for a test of the 7,300 level as the next technically watched support after breaking below 7,400.
D. MODERATE-IMPACT STORIES -> TOP
BEARISH
6. Natural Gas Henry Hub +3.11% on Qatar LNG Supply Disruption and US Heat Demand — European TTF +3.12%; Second Energy Commodity Entering Structural Disruption
The core facts:US Henry Hub natural gas futures rose +3.11% on May 19, driven by two simultaneous but distinct catalysts: hotter-than-expected weather forecasts for the southern and eastern US increasing cooling demand, and a separate structural disruption — Qatar LNG supply has been materially impaired by the ongoing Strait of Hormuz conflict, with Qatar representing approximately 20% of global LNG supply. European Dutch TTF natural gas futures surged +3.12% in EUR terms, reflecting European market anxiety about summer/winter LNG storage refill capacity. EQT Corporation implemented production curtailments, tightening near-term US supply. The Qatar LNG angle is structurally more significant than the US weather catalyst: a sustained disruption to Qatar’s LNG exports would reduce European energy security heading into winter, requiring alternative supply sources at premium prices.
Why it matters:The natural gas surge adds a second energy commodity — beyond oil — to the inflation transmission channel. US consumers face a household energy cost squeeze from both directions: gasoline at $4.50+/gallon (oil) and utility bills rising (natural gas). For US portfolio managers, the Qatar LNG disruption has a distinct implication: US LNG exporters (LNG, Venture Global, Sabine Pass) benefit from the European demand premium — US LNG suddenly commands a global arbitrage premium as the alternative to unavailable Qatar supply. US natural gas producers with LNG export capacity are effectively the world’s swing supplier in the current crisis. On the industrial side, natural gas price increases raise feedstock and energy costs for chemical manufacturers, plastics producers, and fertilizer companies — creating margin pressure across the basic materials and industrials supply chain already stressed by oil costs.
What to watch:Henry Hub for a sustained move above $4.00/MMBtu as the threshold at which industrial demand destruction begins; any diplomatic development affecting Qatar’s LNG export capacity as the primary structural catalyst; European gas storage inventory levels (target ~90% by November 1) as the indicator of winter supply security risk.
BULLISH
7. MU +2.52%, INTC +2.45% Pre-NVDA: AI Memory Semiconductors Diverge From Broader Chip Selloff — QCOM -3.94%, AVGO -2.27% as Complex Bifurcates on AI Demand vs. Yield Pressure
The core facts:In a session where the broader market fell -0.7%, Micron Technology (MU, ~$150B market cap) rose +2.52% and Intel (INTC) gained +2.45% — a notable divergence against the down tape. The moves contrast sharply with declines in non-AI-facing semiconductor names: Qualcomm (QCOM) fell -3.94% and Broadcom (AVGO) fell -2.27%. The bifurcation reflects selective positioning by institutional investors ahead of NVIDIA’s Q1 FY2027 earnings on Wednesday May 20 AMC: names directly levered to AI data center memory and compute demand (MU, INTC) attracted buyers anticipating a NVDA validation catalyst, while wireless/communications semis (QCOM) and broad infrastructure names (AVGO) faced selling pressure from both yield headwinds and AI capex uncertainty.
Why it matters:The MU/INTC divergence from QCOM/AVGO within the same session is the most precise market signal available about institutional conviction in the AI hardware trade ahead of Wednesday’s defining NVDA event. Investors are not selling the entire semiconductor complex — they are rotating within it: taking risk off yield-sensitive diversified names while adding AI memory/compute exposure ahead of what could be the most important single earnings report of the year for the AI investment thesis. For MU specifically, the +2.52% recovery partially offsets Monday’s -6% shellacking from the Seagate CEO’s capacity warning — suggesting institutional buyers viewed that selloff as an overreaction to a supply-side concern that NVDA’s demand guidance could decisively override. The pre-NVDA divergence creates an asymmetric setup: if NVDA beats and raises, MU and INTC could see significant short-covering rallies; if NVDA disappoints, the AI memory trade faces a double-leg down as both the demand and supply theses collapse simultaneously.
What to watch:NVDA Q1 FY2027 earnings Wednesday May 20 AMC — data center revenue guidance, Blackwell GPU ramp update, and HBM/memory order cadence as the definitive validation test for the MU/INTC positioning; MU and INTC day-after-NVDA price action as the cleanest measure of whether the pre-earnings positioning was justified.
BEARISH
8. Redbook Same-Store Sales Decelerate Sharply: 9.6% → 8.1% YoY (Week Ending May 16) — Sharpest Weekly Drop This Year as $4.50 Gasoline Bites Consumer Spending
The core facts:The Redbook same-store sales index — a high-frequency weekly gauge of US retail chain performance — fell from 9.6% to 8.1% year-over-year for the week ending May 16, the sharpest weekly deceleration of 2026. The 150-basis-point weekly decline is notable in isolation and becomes more concerning in the context of concurrent data points: the University of Michigan consumer sentiment index hit 48.2 in May’s preliminary reading (a historic low), national average gasoline prices are running at approximately $4.50/gallon, and Home Depot’s Q1 guidance this morning cited “greater consumer uncertainty and housing affordability pressure” with homeowners deferring larger projects.
Why it matters:The Redbook deceleration, while still positive at 8.1% YoY, represents early-stage consumer spending stress that creates a leading-indicator concern for May retail sales data (released in June). Consumer discretionary spending is the transmission channel through which the oil price shock and rising mortgage rates most directly affect corporate revenues. At $4.50/gallon average gasoline prices, the annualized consumer gasoline spend increases by approximately $300B above the pre-conflict baseline — a regressive consumption tax that falls disproportionately on lower-income households and compresses discretionary category spend. The convergence of Redbook weakness, Michigan sentiment at historical lows, and HD’s CEO citing consumer uncertainty represents the first cluster of data suggesting that the tariff-driven front-running surge (which inflated April activity data) may be masking a softening demand trend in May. For consumer discretionary equities (XLY), this is a sector-specific headwind: companies dependent on big-ticket discretionary purchases (home improvement, electronics, apparel) face the combination of weakening demand and sticky cost structures.
What to watch:May retail sales data (released mid-June) as the monthly-frequency confirmation of the Redbook weekly signal; University of Michigan final May sentiment reading for confirmation of the historic-low preliminary print; consumer discretionary sector ETF (XLY) for any acceleration in underperformance relative to XLP (consumer staples).
UNCERTAIN
9. NY Fed’s Perli Affirms Ample Reserves Framework at Atlanta Fed Conference — Rate Control Toolkit “Well-Equipped” Despite Balance Sheet Uncertainty; Distinct From Rate-Direction Signal
The core facts:Roberto Perli, Manager of the System Open Market Account (SOMA) at the New York Fed, delivered a speech at the Atlanta Federal Reserve’s 2026 Financial Markets Conference on May 19. Perli affirmed that the Fed’s rate control toolkit is well-equipped to manage potential reductions in the SOMA portfolio or shifts allowing banks to hold fewer reserves. He clarified that future technical Treasury bill purchases by the Fed will remain strictly market-condition driven — not a signal of policy easing or balance sheet expansion. Perli’s comments are distinct from the rate-direction signals offered by Waller at the Hoover Institution: while Waller addressed the interest rate level path (hike risks), Perli addressed the operational mechanics of reserve management and rate control.
Why it matters:Perli’s reaffirmation is relevant to money market and short-term fixed-income participants navigating an environment where the Fed could simultaneously hold rates at current levels (or hike) while conducting technical reserve operations that might look superficially like easing. His explicit clarification that T-bill purchases would be “strictly market-condition driven” prevents the market from misinterpreting any near-term technical Fed purchase program as a policy pivot signal. In the current environment — 30Y yields at 5.2%, rate-hike odds at 40-45% — the credibility of the Fed’s rate control framework is itself a stabilizing factor. If markets doubted the Fed’s ability to hold its policy rate at a level above 3.5% without resort to balance sheet expansion, the term-premium component of long yields would widen further. Perli’s remarks signal that the plumbing is intact even under fiscal and rate stress — a modest but meaningful credibility affirmation.
What to watch:Any future NY Fed T-bill purchase announcement for the market’s reaction — whether it is read as technical plumbing or policy signal will depend on the rate environment at the time; reserve level data in the next H.4.1 Fed balance sheet release for confirmation of adequate reserve buffers.
UNCERTAIN
10. FOMC April Minutes Due Wednesday May 20 — Historic 4-Way Dissent (Most Since 1992) Previewed; Warsh Inherits Most Internally Divided Fed in Three Decades
The core facts:The minutes from the April 29 FOMC meeting will be released Wednesday May 20 at 2:00 PM ET. That meeting produced four dissents — the most since October 1992 — creating the most publicly divided Fed vote in over three decades. The split was tri-directional: one member (Miran) voted to cut rates, reflecting concern about slowing growth; three members (Hammack, Kashkari, Logan) opposed the easing-bias language and voted for a tighter stance or removal of accommodation signaling, reflecting concern about persistent inflation. The sitting Chair (Powell’s last meeting before Warsh took over) held the majority for no change and no explicit tightening bias. Markets will read the minutes for the internal deliberations behind these dissents — specifically, whether the inflation hawks explicitly endorsed future rate hikes and whether the growth dove cited oil-inflation transience as the rationale for cutting.
Why it matters:The April minutes are the baseline policy record that new Chair Warsh inherits — and his June 16–17 FOMC meeting will be his first opportunity to redirect the internal consensus. For markets, the minutes are a Rosetta Stone for decoding Warsh’s likely first move: if the April majority acknowledged significant upside inflation risks, Warsh can implement his hawkish instincts with internal policy coherence; if the April majority endorsed a “transitory” oil-inflation framing, Warsh’s first meeting will be a more contentious internal realignment. The 4-way dissent also suggests the Fed’s internal decision-making process is unusually transparent right now — individual members are going on record with divergent views at a time when the external macro environment (oil shock, yield spike, new Chair) makes internal coherence especially valuable for market credibility. Wednesday’s minutes release will move bond markets and front-end yields in real time as market participants recalibrate the June FOMC probability distribution.
What to watch:Wednesday May 20 at 2:00 PM ET — FOMC April minutes release; specifically the characterization of inflation as “transitory” (dovish) vs. “upside risks predominate” (hawkish) as the binary that moves front-end rates; CME FedWatch June 2026 FOMC hike probability in the 30 minutes following the minutes release.
E. ECONOMY WATCH -> TOP
The week’s macro picture is split between resilient hard data and mounting uncertainty on two fronts. Labor and housing posted their clearest back-to-back beats in months — ADP’s weekly pulse climbed to 42,250 and pending home sales beat by 40 basis points, flipping year-over-year positive for the first time since 2024. But the Iran energy shock continues to act as a ceiling: Redbook same-store sales decelerated sharply from 9.6% to 8.1%, signaling that $110 Brent is starting to bite consumers. The dominant question this week is whether Trump’s 48-hour ceasefire pause with Iran yields a deal — EIA forecasts Brent falling to $89 by Q4 if Hormuz reopens — and how incoming Chair Warsh will calibrate his first FOMC meeting in June against an April CPI print of 3.8%.
ADP NER Pulse: Private Hiring Rises to 42,250/Week for Period Ending May 2 (ADP Research, May 19)
What they’re saying:ADP’s weekly National Employment Report Pulse shows U.S. private employers added an average of 42,250 jobs per week for the four weeks ending May 2, 2026 — up from 33,000 in the prior reading and marking the second consecutive week of strengthening. The report notes “hiring strengthened for the second week in a row,” with the index running on a four-week seasonally adjusted moving average with a two-week lag.
The context:The ADP NER Pulse is a high-frequency companion to the monthly ADP National Employment Report; April’s monthly figure showed 109,000 private payroll additions at 4.4% annual pay growth. The weekly acceleration — a 28% jump from the prior 33,000 reading — suggests the labor market is absorbing the Iran energy shock without meaningful job shedding, a key variable for the Fed as it weighs whether to hold rates through year-end or begin easing. Unemployment remained at 4.3% in April, and continuing claims (1,782,000 for the week of May 9) have stayed well below recessionary thresholds.
What to watch:Initial jobless claims (Thursday May 21, expected 210K vs. prior 211K) — a move above 225K would signal genuine labor market deterioration; the monthly May jobs report will be the definitive read on whether this weekly momentum held through the full month.
Pending Home Sales Rise 1.4% in April, Flipping Year-Over-Year Positive for First Time Since 2024 (NAR, May 19)
What they’re saying:The National Association of Realtors reports that pending home sales rose 1.4% month-over-month in April, beating the 1.0% consensus estimate. Year-over-year, sales are now up 3.2%, a dramatic recovery from the prior reading of -1.1% — the first positive YoY print in two years. The Northeast led all regions with a 6.6% MoM gain; the South was the only region to decline (-0.7%). NAR Chief Economist Lawrence Yun noted: “Buyers are coming out with cautious optimism despite increasing economic uncertainty and a slight rise in mortgage rates.”
The context:Pending home sales are a leading indicator for existing-home sales, typically closing 1-2 months after contract signing. The beat arrives despite 30-year mortgage rates near 6.46% (per MBA data for the week of May 16) — suggesting latent demand is still finding its way to market even as affordability remains strained. The NAHB Housing Market Index for May (37, reported yesterday) showed builders remain cautious, so the demand signal from pending contracts is not yet matched by a supply response. For the Fed, a housing recovery would add to core shelter inflation pressure, complicating the path to the 2% target.
What to watch:Housing Starts for April (Thursday May 21, expected 1.41M vs. prior 1.502M) — a miss would signal that builder supply is contracting even as buyer demand recovers, a setup that would sustain shelter inflation; Existing Home Sales (Friday May 22) will confirm or rebut this pending sales upturn.
Trump Delays Planned Iran Military Strike at Gulf Allies’ Request; Oil Eases but Remains at $110 Brent (CNBC/NPR, May 18-19)
What they’re saying:President Trump said Monday he shelved a planned Tuesday military strike on Iran after Qatar, Saudi Arabia, and the UAE asked for a 2-3 day pause to allow serious ceasefire negotiations to proceed. Trump said he was “an hour away” from ordering the strike. Brent crude fell more than 1% to $110.69 per barrel on the news; WTI traded at $108.21. Trump indicated a final decision would follow within days depending on the state of talks with Iranian mediators in Pakistan.
The context:The Iran war has been the primary driver of the U.S. energy shock since early April — Brent hit $138 on April 7 and averaged $117 for the month, pushing the April CPI to 3.8% YoY (the highest since May 2023), with energy up 17.9% YoY and gasoline up 28.4%. EIA’s May STEO forecasts Brent falling to $89/b by Q4 2026 if the Strait of Hormuz reopens and Middle East production recovers — a decline that would shave roughly 60-80 basis points off headline inflation, materially changing the Fed’s rate-hold calculus. However, the Hormuz closure has already idled 10.5 mb/d of Gulf production (Iraq, Saudi Arabia, Kuwait, UAE, Qatar, Bahrain combined), and a failed ceasefire attempt would likely drive oil back toward $120+, locking in stagflationary pressure through the year.
What to watch:Any ceasefire announcement in the next 48-72 hours would be the single most market-moving economic event of the quarter; oil price trajectory through the week as talks proceed — a sustained move below $105 Brent would begin reframing the inflation and Fed rate path narrative.
Redbook Same-Store Retail Sales Decelerate to 8.1% YoY for Week Ending May 16 — Down Sharply from 9.6% (Redbook Research, May 19)
What they’re saying:Redbook’s weekly same-store retail sales index decelerated to 8.1% year-over-year for the week ending May 16, 2026 — down 150 basis points from the prior week’s 9.6% reading. The Redbook Index tracks approximately 9,000 large U.S. general merchandise stores, representing over 80% of the equivalent official retail sales series by dollar value. The deceleration is the largest single-week drop in the current series this year.
The context:With CPI running at 3.8% YoY (April), nominal retail growth of 8.1% translates to roughly 4.3% real spending growth — still positive, but the trend matters. The same week saw gasoline averaging approximately $4.50/gallon nationally (up over $1 from pre-Iran-war levels), with about one-third of consumers citing gasoline prices as a top concern in recent University of Michigan surveys. April retail sales (released May 14) showed the third consecutive monthly gain, but the Redbook’s sharp pullback suggests the energy cost burden is beginning to crowd out discretionary spending for a meaningful share of households. This is consistent with the Michigan consumer sentiment hitting its lowest level on record in early May 2026 (48.2).
What to watch:Final University of Michigan Consumer Sentiment for May (Friday May 22, 10 AM ET) — the preliminary was 48.2, a historic low; any further deterioration would confirm consumer stress is intensifying; next official retail sales report (June 12, for May) will provide the comprehensive read.
Warsh Era Begins at Federal Reserve; Policy Direction Uncertain as June 16 FOMC Approaches (CNBC/CBS, May 18-19)
What they’re saying:Kevin Warsh — confirmed as Federal Reserve Chair in a historic 54-45 Senate vote on May 13 — formally begins his chairmanship this week following Jerome Powell’s departure. Warsh has publicly committed to “strict independence” and pledged to keep the Fed “in its lane,” signaling tighter inflation discipline and a narrower institutional focus. He will not speak publicly on policy before his first FOMC meeting on June 16-17. Strategists broadly expect rates to hold at 3.5%-3.75% for the rest of 2026, with J.P. Morgan now forecasting the next move as a 25 bp hike in Q3 2027.
The context:The transition carries unusual policy uncertainty. Trump nominated Warsh expecting rate cuts; the April FOMC meeting produced four dissents — the most since October 1992 — with Governor Miran favoring a cut and Hammack, Kashkari, and Logan opposing the easing-bias language in the statement. The minutes from that historic 4-way dissent meeting release tomorrow (Wednesday, May 20) and will reveal how entrenched each faction’s views are. With core PCE projected to peak at 3.3% in Q2 and headline CPI already at 3.8%, any signal from Warsh of rate cuts before inflation decisively falls would risk re-anchoring inflation expectations — a key test of his stated independence from executive pressure.
What to watch:FOMC April Minutes (Wednesday May 20, 2:00 PM ET) — the key signals to track: use of “transitory” for oil-driven inflation (dovish), “upside risks predominate” language (hawkish), and how far the 4-way dissent divergence extends into the committee’s economic projections; Warsh’s first public remarks after the June 16-17 meeting will set the tone for the remainder of 2026.
F. EARNINGS WATCH -> TOP
YESTERDAY AFTER THE BELL (Markets Reacted Today)
No major earnings yesterday after the bell from US-domiciled companies with >$100B market cap.
TODAY BEFORE THE BELL (Markets Already Reacted)
UNCERTAIN
11. Home Depot (HD): +0.88% | Adj. EPS Beat, Revenue Beat — But GAAP Miss, Comp Sales Below Expectations, CEO Signals Consumer Caution
The Numbers:Released: BMO May 19. Net sales $41.77B vs. $41.59B est. (+0.43% beat). Adj. diluted EPS $3.43 vs. $3.41 est. (+0.70% beat). GAAP diluted EPS $3.30 vs. $3.32 est. (−0.50% GAAP miss). Total comparable store sales +0.6%; US comparable sales +0.4%. Comparable customer transactions −1.3%; average ticket +2.3% to $92.76. FY2026 guidance reaffirmed: total sales growth 2.5–4.5%, comparable sales growth approximately flat to +2%, adjusted diluted EPS growth flat to 4% from $14.69 in fiscal 2025.
The Problem/Win:A revenue and adj. EPS beat masked a softer-than-expected underlying demand picture. Comparable customer transactions falling −1.3% means fewer customers visited stores — but the average ticket rising +2.3% (to $92.76) indicates those who did come spent more per visit, likely on higher-priced repair and maintenance items. CEO Ted Decker cited “greater consumer uncertainty and housing affordability pressure” as the demand backdrop. CFO Richard McPhail flagged that homeowners “continue to defer spend on larger projects” — a direct confirmation that big-ticket renovation demand (kitchens, bathrooms, room additions) is softening as high mortgage rates discourage moves and home equity drawdowns. The stock closed +0.88% as the market focused on the beat and guidance reaffirmation over the cautious commentary.
The Ripple:Home Depot’s results and guidance set up a meaningful contrast with Lowe’s (LOW, reporting BMO Wednesday May 20) as the side-by-side read on the US home improvement demand cycle. The “deferred large projects” narrative directly validates the NAHB Housing Market Index data from Monday (May 18), where 61% of builders still use incentives and price cuts are deepening — confirming that the housing market’s affordability stress is extending from new home purchases into renovation activity. Lumber names and building materials suppliers face the same deferred-demand headwind described by HD’s CFO.
What It Means:HD’s Q1 results confirm a mid-cycle deceleration in home improvement spending driven by housing affordability constraints — not a collapse, but a clear shift from pandemic-era renovation boom to maintenance-focused spending. The guidance reaffirmation provides a floor for the stock, but the transaction count decline signals that the demand environment is worse than headline comp sales suggest.
What to watch:Lowe’s (LOW) Q1 2026 earnings BMO Wednesday May 20 for direct comparison of Pro vs. DIY channel split and guidance; 30-year mortgage rate trajectory over the next 6 weeks for the leading indicator of renovation demand in Q3.
TODAY AFTER THE BELL (Markets React Tomorrow)
No major earnings after the bell from US-domiciled companies with >$100B market cap. (Keysight Technologies (KEYS) reports AMC — excluded: below $100B market cap threshold at ~$59B.)
WEEK AHEAD PREVIEW:
Q1 2026 earnings season concludes this week with five mega-cap reporters on Wednesday May 20. NVIDIA dominates the session — its Q1 FY2027 report is the single most consequential earnings event of the quarter for the AI investment thesis, the semiconductor sector, and broader equity market sentiment.
NVIDIA Corp (NVDA) — AMC Wednesday May 20 — ~$5,344B — The quarter’s defining AI earnings event. Consensus: adj. EPS $1.75, Revenue $78.91B. Key focus: data center revenue guidance for Q2 FY2027 and full-year trajectory; Blackwell GPU ramp and supply allocation update; H20 China-specific GPU demand status post-export controls; management commentary on HBM/memory capacity constraints (particularly relevant given Seagate’s CEO warning Monday); any signal from hyperscaler customers on AI capex commitment depth. Given the semiconductor sector’s two-day selloff ahead of this report, the risk-reward is asymmetric — a beat-and-raise could trigger a broad AI infrastructure relief rally; a miss or cautious guidance would validate the pre-earnings rotation and accelerate sector selling.
Analog Devices (ADI) — BMO Wednesday May 20 — $202.60B — Consensus: adj. EPS $2.89, Revenue $3.51B. Key focus: industrial and automotive semiconductor demand recovery signals; Q3 FY2026 guidance sensitivity to tariff-driven supply chain disruptions; whether the industrial cycle has stabilized or is softening further — a key read on the Seagate supply/AI demand paradox from the industrial angle.
TJX Companies (TJX) — BMO Wednesday May 20 — $166.77B — Consensus: adj. EPS $1.02, Revenue $14.02B. Key focus: comparable store sales trajectory and evidence of consumer trade-down into off-price retail as $4.50/gallon gasoline and rising mortgage rates compress discretionary spending; FY2027 merchandise margin and guidance against the consumer deceleration backdrop visible in today’s Redbook data.
Lowe’s Companies (LOW) — BMO Wednesday May 20 — $122.30B — Consensus: adj. EPS $2.97, Revenue $22.98B. Key focus: the direct side-by-side comparison with today’s Home Depot results — specifically the Pro vs. DIY channel split, same-store sales vs. HD’s +0.6%, and whether LOW’s CFO confirms the “deferred big-ticket projects” narrative HD flagged this morning; FY2026 guidance revisions given the housing market headwind.
Intuit (INTU) — AMC Wednesday May 20 — $110.57B — Consensus: adj. EPS $12.57, Revenue $8.54B. Key focus: TurboTax 2026 tax-filing season final volume and paid unit metrics; progress and uptake of AI-powered Intuit Assist features in TurboTax and QuickBooks; FY2026 full-year guidance as the read on small business health and consumer financial engagement under the current inflation/energy cost environment.
Wednesday’s five-reporter slate also includes FOMC April minutes at 2:00 PM ET, creating a compound event risk: NVDA reports after the close with full-day bond market repricing from the minutes as the macro backdrop. A hawkish minutes surprise combined with a NVDA disappointment would represent the most challenging single-session condition for the AI trade in 2026.
G. WHAT’S NEXT -> TOP
UPCOMING RELEASES:
| Date | Event | Why It Matters |
|---|---|---|
| Wed, May 20 | Fed Paulson Speech (8:00 AM ET) | Pre-minutes Fed communication; any alignment or divergence from Waller’s Hoover hawkish signal will calibrate the market’s inflation-risk read ahead of the 2 PM minutes release. |
| Wed, May 20 | Fed Barr Speech (10:15 AM ET) | Another pre-minutes Fed voice; Barr’s tone on financial stability and rate direction provides additional context for interpreting the 4-way dissent documented in the afternoon minutes. |
| Wed, May 20 | 20-Year Bond Auction (1:00 PM ET) | With the 30Y at a 19-year high of 5.198%, the 20Y auction bid-to-cover ratio is a real-time test of foreign and institutional demand at current fiscal-stress yield levels — a weak auction accelerates the long-end selloff. |
| Wed, May 20 | FOMC April Minutes (2:00 PM ET) | The most watched Fed document since the 2022 rate-hike cycle. Four dissents — the most since 1992. Markets will scan for: “transitory” oil-inflation framing (dovish) vs. “upside risks predominate” (hawkish); any explicit hike endorsement; the baseline Chair Warsh inherits for his June 16–17 debut. Front-end rates and CME hike probabilities will re-price within minutes of release. |
| Thu, May 21 | Housing Starts April (exp. 1.41M, prior 1.502M; 8:30 AM ET) | Expected decline of ~90K from prior month; a miss would confirm builder supply is contracting even as Tuesday’s pending home sales beat shows buyer demand recovering — a supply-constrained setup that sustains shelter inflation and complicates the Fed’s path to 2% core PCE. |
| Thu, May 21 | Building Permits April Prel (exp. 1.39M, prior 1.363M; 8:30 AM ET) | Forward indicator for housing supply; a beat would signal builders are responding to demand despite high mortgage rates, adding future supply relief; a miss locks in tight inventory and persistent shelter CPI pressure. |
| Thu, May 21 | Initial Jobless Claims May 16 (exp. 210K, prior 211K; 8:30 AM ET) | Labor market’s weekly health check; a sustained reading below 220K confirms the jobs market is absorbing the energy shock without shedding. A move above 225K would be the first signal of genuine deterioration — altering the Fed’s rate-hold calculus. |
| Thu, May 21 | Philadelphia Fed Manufacturing Index May (exp. 18, prior 26.7; 8:30 AM ET) | Expected sharp deceleration from 26.7 to 18; a miss below 10 would signal manufacturing is absorbing stagflationary pressure from both input costs (oil/nat gas) and weaker consumer demand visible in the Redbook deceleration — adding to the growth-scare narrative. |
| Thu, May 21 | Continuing Jobless Claims May 9 (prior 1,790K; 8:30 AM ET) | Measures how long the unemployed stay out of work; sustained readings near 1,800K remain below recession thresholds, but any acceleration toward 2,000K would confirm that laid-off workers are struggling to find re-employment in a higher-rate, higher-cost environment. |
KEY QUESTIONS:
1. Will the April FOMC minutes characterize oil-driven inflation as “transitory” or acknowledge “upside risks that predominate” — and does that characterization align with or diverge from Waller’s hawkish Hoover remarks, setting the credibility baseline Warsh inherits for his June 16–17 FOMC debut?
2. Can the Gulf 48-hour ceasefire window (through May 21–22) produce a deal that begins reopening the Strait of Hormuz — or does the window close without agreement, pushing Brent back above $115 and locking in a stagflationary summer as IEA emergency reserves approach exhaustion?
3. With the 30-year at 5.198% and the Redbook deceleration confirming consumer stress, does Thursday’s cluster of housing, jobs, and manufacturing data print a growth scare severe enough to force a market re-evaluation of the rate-hike thesis — or does resilience in claims and permits validate the Fed’s hold stance?
H. CHART OF THE DAY -> TOP
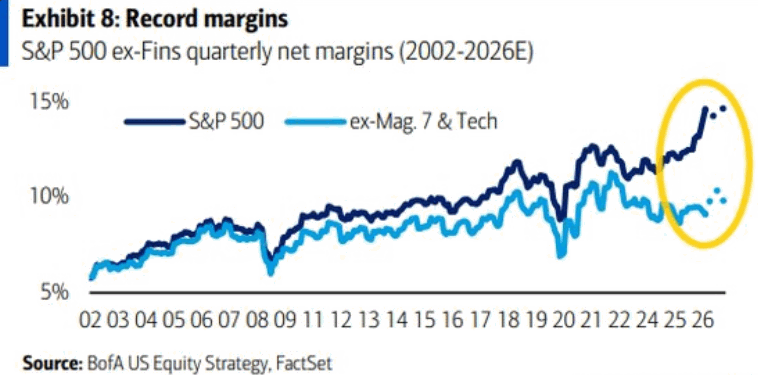
Chart of the Day: Headline S&P 500 margins sit at a record ~15%, but strip out the Magnificent 7 and Tech and the rest of the market is at ~8-9% — flat to declining and well below its 2018 and 2021 peaks. The two lines tracked together for two decades; they have decoupled completely since 2023. This is corporate margin breadth doing exactly what stock-level breadth is doing right now: extraordinary concentration masquerading as a healthy index. The mechanical issue: ex-Mag 7 earnings have no margin cushion. If AI capex flows compress hyperscaler margins even modestly, headline S&P margins re-rate down hard and the broader market has nothing in reserve. This is not durable margin expansion — it is one trade dressed up as an index.
Market Intelligence Brief (MIB) Ver. 18.18
For professional investors only. Not investment advice.
© 2026 RecessionALERT.com
Comments are closed.