
MARKET INTELLIGENCE BRIEF (MIB)
Wednesday, August 5, 2026
The Dow closed at a record 54,349 — and almost nothing else did. Private payrolls added just 44,000, ISM services employment fell into contraction, and September hike odds slid to 57% even as Kashkari and Cook publicly pushed for tightening. Alphabet dropped 4.03% after losing its chief scientist and DeepMind CEO in one day. Gold surged 3.71% to $4,306. Tower REITs fell 6% each as SpaceX aimed Starlink at the carriers. AI infrastructure sold off on no news; NVIDIA rose 3.43%.
TABLE OF CONTENTS
A. EXECUTIVE SUMMARY
B. MARKET DATA
C. HIGH-IMPACT STORIES (7)
D. MODERATE-IMPACT STORIES (6)
E. ECONOMY WATCH (5)
F. EARNINGS WATCH (15)
G. WHAT’S NEXT
H. CHART OF THE DAY
A. EXECUTIVE SUMMARY -> TOP
The Dow’s record 54,349.00 close was a two-stock event — Eli Lilly and Amgen earnings beats landing in a price-weighted index — while the S&P 500, Nasdaq 100 and Russell 2000 all fell as the market began discriminating between AI revenue and the capital intensity required to produce it, selling Lam Research and Palantir on no company-specific news while NVIDIA gained 3.43%. The session’s dominant cross-asset move was gold’s 3.71% surge to $4,306.72, driven by a soft July private-payrolls print that cut September Fed hike odds to roughly 57% even as Kashkari and Cook both argued publicly for tightening. That divergence — the market repricing the Fed against the Fed — matters more than the index split: the front end is now trading labour data rather than committee rhetoric for the first time in several sessions. Breadth was better than the headline suggests, with the NYSE Composite (+0.21%) outperforming the S&P and five of eleven sectors higher, led by Basic Materials (+2.72%).
• Dow sets a record at 54,349.00 (+0.49%) while everything else falls — S&P 500 -0.17%, Nasdaq 100 -0.83%, Russell 2000 -0.65%, and the Transportation Average -0.94%, restoring the Dow Theory non-confirmation after exactly one session of agreement.
• Two independent labour signals miss on the same morning — ADP private payrolls added just 44,000 against ~68-70K consensus, and the ISM Services employment index fell to 47.4% from 51.2%, back into contraction while Business Activity (59.1%) and New Orders (57.2%) both rose. September hike odds cut to ~57% from ~67%.
• Kashkari names September, Cook says the Fed may lack “the luxury of waiting” — a fourth consecutive session of hawkish Fed commentary, and the first from a permanent Board voter. The rate market moved ten points the other way.
• Alphabet -4.03% to $362.43 on an AI leadership overhaul — Hassabis relinquishes the DeepMind CEO role, 27-year chief scientist Jeff Dean departs, and several Gemini leaders exit with the flagship model still unreleased. Drove Communication Services to -2.36%, the worst of eleven sectors.
• Gold +3.71% to $4,306.72 and silver +3.24% — the day’s largest move in any major asset, concentrated in the monetary metals (copper +1.44%, platinum -0.56%). Basic Materials led sectors at +2.72%; VIX fell 4.12% to 15.82, so the hedging bid relocated from options into bullion rather than disappearing.
• Tower REITs down ~6% each on a SpaceX mobile-network plan; Treasury lifts Q3 borrowing $68B to $739B — American Tower, Crown Castle and SBA all fell after SpaceX detailed a full Starlink mobile offering built on 65 MHz of EchoStar spectrum, while a $125B refunding sets 3-, 10- and 30-year auctions for August 11-13.
1. The market has stopped paying for AI revenue regardless of what it costs to produce — The selling reached names with no reporting event of their own: Lam Research -3.25% and Palantir -2.61% disclosed nothing. What is being repriced is not demand — Arista raised full-year revenue guidance to roughly $12.6 billion for the third time this year — but capital intensity. Combined 2026 hyperscaler capex now runs near $725 billion against cloud backlog that tripled to $2.3 trillion, which makes free-cash-flow conversion the variable supporting these multiples. NVIDIA’s 3.43% gain on the same tape and Technology’s sector-level decline of only 0.30% argue this is a discrimination event within AI, not an exit from it. Position for quality of margin structure, not exposure to theme.
2. Three independent instruments read the same weakness in physical demand — while GDPNow reads 6.2% — A services employment index in contraction alongside rising orders, a transport average falling 0.94% on a session when its dominant variable cost declined again, and a sell-side tape clustering downgrades in discretionary retail (Best Buy, Burlington) and auto suppliers (Aptiv) are three unrelated measures describing the same thing. Set against that, the Atlanta Fed’s Q3 nowcast jumped to 6.2% from 5.0%. Headline growth and labour-market internals are now telling opposite stories, and Friday’s payrolls report decides which one the market trades for the rest of the quarter.
3. A bond rally driven by deteriorating growth is not the bond rally equities are pricing — Yields fell today because hiring slowed, not because inflation receded — and those two causes produce identical yield moves with opposite earnings outcomes. The uncomfortable arithmetic is that no participant in this debate is arguing for easing: the funds rate has been held at 3.50%-3.75% for five consecutive meetings, no cut is priced with conviction, and a hike remains a live 57% probability while equities trade at record multiples. A second soft labour print on Friday is not unambiguously good news, and $125 billion of duration supply arrives three sessions later.
 — Leading economic indicators. Accurate market forecasts. Apply for membership at join.recessionalert.com
B. MARKET DATA -> TOP
AI-capex fatigue hit the chip and AI-infrastructure complex — Alphabet slid roughly 4% on a DeepMind leadership shake-up and capex/free-cash-flow concerns, while AMD fell 7% despite beating estimates — dragging the Nasdaq 100 and Russell 2000 lower even as the Dow notched a fresh record close on earnings strength from Eli Lilly and Amgen. Breadth was narrow: blue-chip earnings winners offset broad softness in growth and small-caps. The clearest divergence was gold’s 3.71% surge alongside a pullback in crude, both tracing to progress on reopening the Strait of Hormuz, which cooled inflation expectations, softened the dollar, and pulled Treasury yields modestly lower. SpaceX tumbled 13.6% on surging AI capex and Thursday’s lockup expiry despite beating revenue estimates.
CLOSING PRICES – Wednesday, August 5, 2026:
MAJOR INDICES
The Dow’s push to a fresh record (+0.49%) came from earnings-driven blue-chip strength (Lilly, Amgen, RTX) even as the S&P 500 (-0.17%), Nasdaq 100 (-0.83%) and Russell 2000 (-0.65%) all slipped on AI-capex jitters — a genuinely narrow, earnings-led session rather than a broad advance. NYSE Composite’s modest +0.21% gain confirms breadth was roughly balanced beneath the index-level split.
| Index | Close | Change | %Move | Why It Moved |
|---|---|---|---|---|
| S&P 500 | 7,723.42 | -13.10 | -0.17% | Broad-based pullback as AI-capex jitters hit tech/growth names |
| Dow Jones | 54,349.00 | +263.12 | +0.49% | Fresh record close on earnings-driven blue-chip strength (Lilly, Amgen, RTX) |
| DJ Transportation | 21,576.0 | -203.9 | -0.94% | Lagged the broader complex; no distinct headline catalyst identified |
| Nasdaq 100 | 29,487.79 | -245.37 | -0.83% | AI-capex fatigue weighed on chip/mega-cap tech (Alphabet -4%, AMD -7%) |
| Russell 2000 | 3,017.13 | -19.85 | -0.65% | Tracked the broader risk-off tilt in growth/small-cap names |
| NYSE Composite | 24,513.81 | +50.94 | +0.21% | Broad-market gauge held roughly flat, reflecting mixed large-cap performance |
VOLATILITY & TREASURIES
VIX fell 4.12% alongside modestly lower yields (10Y -1.3bps, 2Y -0.9bps) and a softer dollar — a coherent de-escalation signature, not an inflation scare, as Strait of Hormuz progress cooled both crude and rate-hike odds simultaneously. Bonds and equity vol are confirming the same story rather than diverging.
| Instrument | Level | Change | Why It Moved |
|---|---|---|---|
| VIX | 15.82 | -0.68 (-4.12%) | Eased as Strait of Hormuz de-escalation optimism calmed volatility |
| 10-Year Treasury Yield | 4.614% | -1.3 bps | Slipped on dovish Fed rate-path repricing tied to easing oil/inflation expectations |
| 2-Year Treasury Yield | 4.185% | -0.9 bps | Tracked the 10Y lower on the same rate-cut repricing |
| US Dollar Index (DXY) | 99.71 | -0.14 (-0.14%) | Softer dollar accompanied the rate-cut repricing, supporting gold |
COMMODITIES
Gold (+3.71%) and silver (+3.24%) rallied together on the weaker dollar and dovish Fed repricing, a safe-haven-cum-rate-cut move rather than a growth signal. Platinum’s -0.56% slip and copper’s modest +1.44% gain show the rally was concentrated in the monetary metals, not industrial demand. Bitcoin’s muted +0.99% gain tracked risk sentiment loosely, with no distinct crypto-specific catalyst identified.
| Asset | Price | Change | %Move | Why It Moved |
|---|---|---|---|---|
| Gold | $4,306.72/oz | $+154.12 | +3.71% | Jumped on Strait of Hormuz de-escalation optimism, a softer dollar, and more dovish Fed rate expectations |
| Silver | $62.198/oz | $+1.953 | +3.24% | Tracked gold’s rally on the same safe-haven/dollar dynamics |
| Copper | $6.7393/lb | $+0.0958 | +1.44% | Firmed modestly, unbothered by the precious-metals-specific rally |
| Platinum | $1,746.20/oz | $-9.80 | -0.56% | Lagged the rest of the precious complex, slipping slightly |
| Bitcoin | $65,002.0 | $+640.0 | +0.99% | Modest gain, loosely tracking the day’s mixed risk tone |
ENERGY
WTI (-0.98%) and Brent (-0.06%) eased in tandem on progress toward reopening the Strait of Hormuz, a supply-side relief trade rather than a demand read — one occurring alongside falling yields, not falling equities broadly, keeping the read growth-friendly rather than stagflationary. Dutch TTF’s sharper -4.27% drop shows the relief was felt hardest in European gas markets, while Henry Hub barely moved.
| Asset | Price | Change | %Move | Why It Moved |
|---|---|---|---|---|
| Crude Oil (WTI) | $75.03/bbl | $-0.74 | -0.98% | Eased on progress toward reopening the Strait of Hormuz |
| Crude Oil (Brent) | $79.31/bbl | $-0.05 | -0.06% | Held roughly flat, tracking WTI’s modest Hormuz-driven pullback |
| Natural Gas (Henry Hub) | $2.672/MMBtu | $-0.010 | -0.37% | Little changed, decoupled from the crude-driven Hormuz narrative |
| Natural Gas (Dutch TTF) | $18.09/MMBtu | $-0.81 | -4.27% | Fell sharply as the same Hormuz de-escalation eased European supply-route concerns |
S&P 500 SECTORS
Communication Services’ -2.36% one-day slide (Alphabet-driven) breaks from its own +3.41% weekly gain — a sharp reversal, not a trend change. Basic Materials led today (+2.72%) on gold’s surge while also topping the 12-month table (+38.12%), a structural leader still adding. Energy fell -1.99% today despite being the YTD leader (+28.02%), oil’s pullback catching up to a sector that has outperformed all year.
| Sector | 1-Day | 1-Week | 1-Month | 3-Month | 6-Month | YTD | 12-Month |
|---|---|---|---|---|---|---|---|
| Basic Materials | +2.72% | +6.75% | +5.73% | +0.13% | -1.97% | +14.29% | +38.12% |
| Healthcare | +1.19% | -1.30% | -1.76% | +10.86% | +5.54% | +5.86% | +23.82% |
| Financial | +0.29% | +2.94% | +3.28% | +12.77% | +8.73% | +9.07% | +18.59% |
| Consumer Defensive | +0.17% | -2.23% | +0.38% | -1.00% | -2.18% | +8.45% | +7.13% |
| Real Estate | +0.05% | -1.74% | +0.35% | +3.27% | +9.62% | +11.38% | +9.17% |
| Technology | -0.30% | +10.91% | +4.15% | +10.27% | +26.08% | +23.06% | +32.95% |
| Consumer Cyclical | -0.40% | +7.75% | +2.47% | -0.14% | -2.37% | -1.43% | +8.09% |
| Utilities | -0.97% | -1.70% | -4.02% | -7.42% | -1.06% | +2.28% | +3.34% |
| Industrials | -1.51% | +5.12% | -1.85% | +0.49% | +4.05% | +14.54% | +18.49% |
| Energy | -1.99% | -2.28% | +4.86% | -4.64% | +12.35% | +28.02% | +33.93% |
| Communication Services | -2.36% | +3.41% | -1.81% | -5.56% | -1.57% | +1.08% | +16.30% |
TOP MEGA-CAP MOVERS:
GAINERS
| Company | Ticker | Close | Change | Why It Moved |
|---|---|---|---|---|
| Eli Lilly & Co | LLY | $1,169.86 | +4.86% | Q2 revenue $22.97B (+48% YoY) beat estimates on Mounjaro/Zepbound demand; raised FY2026 revenue guidance |
| Amgen Inc | AMGN | $407.83 | +4.57% | Q2 beat; six growth drivers up 26% of product sales; raised revenue and EPS guidance |
| Arista Networks | ANET | $197.31 | +3.57% | First-ever $3B quarterly revenue, operating margin expanded to 49.9%, Q3 guided to ~$3.30B |
| NVIDIA Corp | NVDA | $219.20 | +3.43% | Gained against the broader semiconductor-sector selloff; no company-specific catalyst identified |
| Thermo Fisher Scientific | TMO | $577.83 | +2.32% | Rose in sympathy with the healthcare sector’s earnings-driven strength (Lilly, Amgen) |
DECLINERS
| Company | Ticker | Close | Change | Why It Moved |
|---|---|---|---|---|
| Space Exploration Technologies | SPCX | $108.29 | -13.60% | Q2 capex jumped sixfold to $18.4B (AI capex alone $15.8B) overshadowed a 92% YoY revenue beat; Aug 6 lockup expiry (140%+ float increase) compounded the pressure |
| Advanced Micro Devices | AMD | $482.05 | -7.04% | Beat on revenue, earnings and margin with Q3 guidance above consensus, but capex near triple the modeled figure cut free cash flow ~40% sequentially |
| Alphabet Inc (Class A) | GOOGL | $362.43 | -4.03% | DeepMind leadership shakeup (Hassabis to chief scientist, Jeff Dean departing) plus AI capex/negative free-cash-flow concerns overshadowed an otherwise solid Q2 |
| Lam Research Corp | LRCX | $307.42 | -3.25% | Caught in the broad semiconductor-equipment selloff on fears AI infrastructure spending is peaking faster than expected |
| Palantir Technologies | PLTR | $150.20 | -2.61% | AI-software valuation pressure amid the broader chip/AI-capex sentiment reset |
— Institutional-grade intelligence for serious investors. Apply for membership at join.recessionalert.comC. HIGH-IMPACT STORIES -> TOP
BEARISH
1. AI-Capex Fatigue Spreads Beyond the Reporters — the Complex That Rallied 11% on Tuesday Gives It Back on Wednesday
The core facts:The semiconductor and AI-infrastructure complex sold off broadly, dragging the Nasdaq 100 down 0.83% to 29,487.79 and the Russell 2000 down 0.65% while the Dow set a record. The decline was not confined to companies that reported: Lam Research fell 3.25% to $307.42 and Palantir fell 2.61% to $150.20, with Applied Materials and Texas Instruments also down 2-3%, none of them on a company-specific catalyst. The transmission ran from AMD’s after-the-close capital-expenditure disclosure on Tuesday — covered in Section F — into names with no earnings event of their own. The scale of the spending now being questioned is disclosed: 2026 capex targets stand at roughly $220 billion for Amazon, $200 billion for Alphabet, $175 billion for Microsoft and $130 billion-plus for Meta, with combined cloud backlog across the largest four platforms rising from roughly $800 billion to $2.3 trillion in a year. NVIDIA was the notable exception, gaining 3.43% to $219.20 against the tape. Technology as a sector fell only 0.30%, but Communication Services dropped 2.36% and Industrials 1.51%.
Why it matters:Yesterday this report documented the merchant suppliers taking the lead back violently — Intel and SanDisk each adding 10.84% on no company-specific catalyst — and identified the mechanism as memory cost inflation accruing to suppliers’ revenue rather than destroying it. It also flagged the specific test that would falsify that thesis: whether the first supplier to report actually captured the pricing or absorbed it in capacity spending. That test ran overnight and the answer transmitted through the complex today. The important structural point is that the selling reached names with no reporting event. Lam Research and Palantir did not disclose anything; they fell because the market re-rated a theme, and a theme re-rating is a different and more durable thing than a single disappointing print. What is being repriced is not AI demand — Arista guided full-year revenue to roughly $12.6 billion in its third raise of the year, and AMD’s data-center revenue more than doubled — but the capital intensity required to serve it. When hyperscaler backlog nearly triples in a year while the capex required to convert that backlog runs near $452 billion annually, the free-cash-flow conversion of the entire complex becomes the variable, and free cash flow is what supports the multiples these names carry. Two things argue against reading this as the start of an unwind. NVIDIA rose 3.43% on the same session, which is inconsistent with a wholesale exit from AI exposure and more consistent with a rotation toward the one name whose margin structure is not in question. And Technology’s sector-level decline was only 0.30%, an order of magnitude smaller than the individual moves, meaning the damage was concentrated rather than systemic. The honest reading is that the market has stopped paying the same multiple for AI revenue regardless of what it costs to produce — which is a discrimination event, not a capitulation.
What to watch:Whether NVIDIA continues to diverge from the rest of the complex on further down sessions — sustained divergence would confirm a quality rotation within AI rather than an exit from it. Watch Cloudflare and Datadog reporting Thursday for whether the software layer that monetises AI capacity is being repriced alongside the hardware that builds it.
BEARISH
2. Alphabet Loses Its Chief Scientist and Its DeepMind CEO on the Same Day — Shares Fall 4.03% With the Flagship Gemini Model Still Unreleased
The core facts:Alphabet announced a leadership overhaul of its artificial-intelligence organisation. Demis Hassabis relinquished the DeepMind chief executive role, becoming chair of DeepMind and chief scientist across Alphabet while continuing to lead Isomorphic Labs, the group’s drug-discovery spinout. Google chief scientist Jeff Dean, a 27-year veteran, is leaving along with senior fellow Sanjay Ghemawat to establish Discovery Loop, an independent public benefit corporation in which Google will invest. Several leaders of the Gemini model are also departing. Koray Kavukcuoglu, DeepMind’s chief technology officer and Google’s chief AI architect, becomes senior vice president of DeepMind reporting directly to Sundar Pichai. Alphabet Class A shares fell 4.03% to $362.43, making it the third-largest mega-cap decliner of the session and the principal driver of Communication Services’ 2.36% sector decline — the worst of the eleven S&P sectors. The reshuffle lands with the flagship version of the latest Gemini model still unreleased against a planned June launch.
Why it matters:Executive reshuffles at large technology companies are usually noise, and the market’s default is to ignore them. It did not ignore this one, and the reason is the conjunction rather than any single departure. A company that has told investors it will spend on the order of $200 billion on capital expenditure in 2026 simultaneously lost the executive who ran its research organisation, the scientist who has been its technical centre of gravity for 27 years, and several leaders of the specific model franchise that spending is meant to produce — while that model’s flagship version is running roughly two months past its planned launch. Any one of those facts is survivable. Together they raise the question of whether the delay caused the reorganisation or the reorganisation will extend the delay, and the market cannot distinguish between those two readings from the outside. The four percent decline is the price of that ambiguity, not a verdict on the people. The counterweight is genuine and should not be dismissed. Hassabis is not leaving Alphabet; he is moving to a role with broader scope across the whole company and retaining Isomorphic Labs, which is the structure a firm adopts when it wants its best researcher researching rather than managing. Dean’s exit is explicitly amicable and Google is investing in the vehicle he is founding, which is closer to a spinout than a defection. What makes this high-impact rather than a governance footnote is the timing against Story 1: on the same session the market began discriminating between AI revenue and the capital required to produce it, the second-largest spender in the complex disclosed that the organisation converting that capital into product is being rebuilt. Investors are being asked to underwrite roughly $200 billion of spending against a research organisation whose leadership was reconstituted today and a flagship model they have not yet seen.
What to watch:The release date of the flagship Gemini model — shipping it would retire the delay question and reframe today’s reshuffle as a reorganisation around a finished product rather than a stalled one. Watch whether further Gemini team departures are disclosed, which would shift this from a planned succession to an exodus.
BEARISH
3. Kashkari Says “Now Is the Time to Start Slowly Moving” Rates Up and Cook Says the Fed May Not Have “the Luxury of Waiting” — Two Hike Advocates in One Session
The core facts:Minneapolis Fed President Neel Kashkari said in a live CNBC interview from the Aspen Ideas Festival that the central bank should begin raising interest rates, favouring a gradual approach that could start as early as the September 15-16 meeting, and warning that waiting risks a more severe tightening cycle later. Kashkari was one of three regional Fed presidents who dissented at last week’s FOMC decision, each voting for a quarter-point increase against a 9-3 hold that left the target range at 3.50%-3.75% for a fifth consecutive meeting. He acknowledged the September outcome depends on data between now and then. Separately, Federal Reserve Governor Lisa Cook repeated that she is prepared to raise rates if inflation does not slow, warning that policymakers may not have the luxury of waiting for inflation to return to the 2% target; Cook backed the July hold but cautioned that the longer inflation stays above target, the harder it becomes to bring down. Despite both sets of remarks, markets trimmed the probability of a September hike to roughly 57% from about 67% a day earlier.
Why it matters:This is the fourth consecutive session in which Federal Reserve officials have publicly kept a hike in the distribution — Williams on Monday, Paulson on Tuesday, and now a sitting Board governor and a voting dissenter on the same Wednesday. What changes today is the escalation in specificity and in seniority. Kashkari did not decline to rule out a hike; he named September and argued the cost of delay is a steeper adjustment later, which is an argument for acting before the data forces it. Cook matters for a different reason: regional presidents rotate and dissent, but a Board governor is a permanent voter, and her formulation that the committee may not have the luxury of waiting concedes that the current stance is behind the problem rather than calibrated to it. The genuinely important fact, however, is the one that runs the other way. On the day two officials pushed for tightening, the market moved in the opposite direction and cut September hike odds by ten percentage points. That divergence is the story. It means the front end is not trading Fed rhetoric at all — it is trading the labour data covered in Story 4 and the crude-price path, and it has concluded that those two inputs will resolve the argument before the committee does. For a portfolio, the uncomfortable arithmetic is that both sides of this can be right simultaneously and the outcome is still bad: no cut is priced with conviction, a hike remains a live 57% probability, and the funds rate has now been held at 3.50%-3.75% for five meetings while equities trade at record multiples. The market is discounting a benign resolution to a disagreement in which no participant is arguing for easing.
What to watch:September hike odds at the 50% line — a break below it would confirm the market has decisively chosen the labour data over the committee’s rhetoric, while a move back above 67% would mean Kashkari’s framing is being adopted. Watch the 2-year yield at 4.185% for any move above 4.25%, which would price the hike risk directly.
UNCERTAIN
4. Private Payrolls Undershoot by a Third and the Market Reprices the Fed Against the Fed — September Hike Odds Fall to 57%
The core facts:July private payrolls came in well below consensus, a sharp deceleration from June; Section E carries the reading and its composition in full. The market-relevant layer is the reaction. Both Treasury yields fell, the 10-year down 1.3 basis points to 4.614% and the 2-year down 0.9 basis points to 4.185%, and the dollar index eased 0.14% to 99.71. Traders cut the implied probability of a September Federal Reserve rate hike to roughly 57% from about 67% the previous day. Gold rose 3.71% and silver 3.24% on the combination of softer labour data and the softer dollar. The VIX fell 4.12% to 15.82. The repricing occurred on the same session that a Federal Reserve governor and a regional president both publicly argued for higher rates.
Why it matters:For two sessions this report documented a market that had stopped pricing US macro entirely, with the oil price supplying every move in the curve while data of opposite sign was filed away unpriced. Today that stopped. A labour print moved yields, moved the dollar, moved the rate path and moved gold, on a session when crude barely changed — WTI fell 0.98% and Brent 0.06%. That is the cleanest available evidence that the domestic data channel has reopened, and it arrived on the first release soft enough to matter. What makes the reading uncertain rather than simply favourable is that the market and the committee are now openly disagreeing about what this print means. The rate market read a hiring slowdown as reducing the case for tightening and cut hike odds by ten points. Kashkari and Cook, speaking the same day, read the inflation picture as requiring tightening regardless. Both readings can be defended from the same data, and the resolution will not come from rhetoric — it comes from whether the labour softening is a one-month deceleration in a noisy, heavily revised series or the leading edge of something the committee has not yet incorporated. The configuration that deserves the most attention is the one neither side is arguing for: weakening labour demand with a central bank that has removed cuts from its distribution and a funds rate held at 3.50%-3.75% for five consecutive meetings. Equity holders are being asked to accept a bond rally driven by deteriorating growth as though it were a rally driven by receding inflation. Those two things produce identical yield moves and opposite earnings outcomes.
What to watch:Friday’s non-farm payrolls report, which is the confirmation or refutation of today’s private-payrolls signal and the single input most likely to settle the September question. Watch whether equities can rally on a second soft labour print — a failure to do so would mark the market switching from reading weak data as dovish to reading it as recessionary.
UNCERTAIN
5. Gold Adds 3.71% to $4,306.72 — the Day’s Largest Move in Any Major Asset, on a Session Where the Dow Set a Record
The core facts:Gold rose $154.12, or 3.71%, to $4,306.72 an ounce, its third consecutive advance and its highest level since mid-June. Silver rose 3.24% to $62.198. The move dwarfed everything else on the tape: the largest index move of the session was the Nasdaq 100’s 0.83% decline and the largest sector move was Communication Services’ 2.36% drop. The rally was concentrated in the monetary metals — copper added only 1.44% and platinum fell 0.56%, so this was not an industrial-demand signal. Supporting inputs were a dollar index down 0.14% to 99.71, both Treasury yields lower, and reduced odds of near-term Federal Reserve tightening following the July private-payrolls miss. Basic Materials was the best-performing S&P sector at +2.72%, and is also the strongest twelve-month sector at +38.12%. The advance came on a session when the Dow Jones Industrial Average closed at a record 54,349.00 and the VIX fell 4.12% to 15.82.
Why it matters:A 3.71% move in gold is a large move by the standards of the asset, and it was the day’s dominant cross-asset signal by a wide margin. The mechanical explanation is straightforward and fully supported: lower real yields, a softer dollar and reduced expectations of near-term tightening all raise the value of a non-yielding store of value, and all three were present. The reason this is uncertain rather than a clean risk-off tell is that the classic confirming signal is missing. Gold usually rises this hard alongside rising implied volatility and falling equities. Today the VIX fell 4.12%, the Dow set a record and credit showed no stress. Yesterday this report noted the inverse configuration — the VIX rising 4.04% on a 1.79% equity advance — and asked whether the hedging bid would persist once the earnings reactions cleared. It did not persist in options; it appears instead to have relocated into bullion. That relocation is the interesting part. Options hedges decay and expire, which is why yesterday’s volatility bid unwound on schedule. A gold position does not decay, and buying it is what an allocator does when the concern is not a dated event but a persistent condition — an inflation path the Federal Reserve has not resolved, a funds rate frozen for five meetings, and a Middle East supply picture in which one chokepoint is easing while another is deteriorating. The constraint on reading too much into this is that gold has been in a structural advance all year and Basic Materials is the twelve-month sector leader at +38.12%; a strong day in an asset already trending is weaker evidence than a strong day in one that is not. But the concentration in monetary rather than industrial metals is the detail that keeps this a macro signal rather than a commodity one.
What to watch:Whether gold holds above $4,300 into Friday’s payrolls report — holding through a strong labour print would confirm the bid is structural rather than a rate-path trade. Watch the gold-VIX relationship: a session where both rise together would mark hedging demand broadening beyond bullion.
UNCERTAIN
6. Houthis Strike Saudi Tankers off Yanbu and the EIA Confirms a Surprise Crude Build — Brent Rallies Above $80 Intraday and Still Closes Lower
The core facts:Yemen’s Houthi forces said they fired on two Saudi oil tankers in the Red Sea off Yanbu, a principal Saudi crude export port; Saudi officials and the UK Maritime Trade Operations Centre confirmed the vessel Encelia was struck by a projectile and caught fire. Crude rallied on the news, with Brent trading up roughly 1% above $80 a barrel intraday and WTI above $76. Separately, the Energy Information Administration reported a crude inventory build of roughly 2.5 million barrels for the week ended July 31 against expectations for a draw, breaking a seven-week drawdown streak and confirming Tuesday’s American Petroleum Institute build; Cushing stocks also rose, while products drew hard in the opposite direction with gasoline and distillate both down. Neither the attack nor the build survived to the close: WTI settled at $75.03, down 0.98%, and Brent at $79.31, down 0.06%. Dutch TTF fell 4.27% to $18.09 per MMBtu. Energy was the second-worst S&P sector at -1.99% despite remaining the year’s best performer at +28.02%.
Why it matters:Yesterday this report set a specific test: whether Wednesday’s EIA print would confirm the API build and give the crude decline a fundamentals leg independent of Hormuz diplomacy. It did. A second consecutive build, breaking a seven-week draw streak against an expected drawdown, is a physical-inventory fact that owes nothing to Tehran, and it means the disinflationary impulse now has an anchor that survives a diplomatic failure. The far more revealing event, however, is what the market did with the Houthi attack. A missile strike that set a Saudi tanker on fire off a primary export port lifted Brent above $80 and the gain was fully surrendered by the close. That is the market declaring a ranking: the prospect of Hormuz reopening — the chokepoint that has been blocked since February 28 and carries millions of barrels a day — outweighs an active escalation at Bab el-Mandeb. The two chokepoints are now moving in opposite directions simultaneously, and this is the first session where the tape priced that asymmetry explicitly rather than trading a single Middle East variable. Two cautions sit against the constructive read. The first is that the Hormuz side remains an unsigned arrangement whose predecessor collapsed in June over the routing question, and today’s price action means essentially none of that risk is compensated. The second is sector arithmetic that continues to cut against the index: Energy is the largest year-to-date contributor in the S&P at +28.02% and it fell 1.99%, so cheaper crude accrues to the other ten sectors at the direct expense of the one that has carried the market since January. That Energy’s decline was twice Brent’s on a day Brent barely moved suggests equity holders are pricing a structurally lower forward curve rather than the day’s spot print.
What to watch:Whether Brent can be pushed back above $80 and hold there on further Red Sea escalation — a failure would confirm that the market has fully subordinated Bab el-Mandeb risk to the Hormuz outcome. Watch next week’s EIA report for a third consecutive build, which would establish an inventory trend independent of any diplomatic result.
UNCERTAIN
7. A 15% Polysilicon Tariff Plus a Minimum Import Price Lands Thursday — a Section 232 Action That Hits Solar and the Chip Supply Chain at Once
The core facts:The administration will announce as soon as Thursday, August 6, a 15% tariff on polysilicon derivative products paired with a series of minimum import prices covering polysilicon, wafers, cells and modules. The action concludes a Section 232 national-security investigation into polysilicon imports and adopts a hybrid structure — a tariff and a price floor operating together — rather than a conventional duty alone. The stated purpose is to protect US polysilicon production, including Hemlock Semiconductor, partly owned by Corning, against Chinese dominance of the material. Importers investing in US wafer and cell production will be able to offset the cost of the protections. Estimated impact on imported solar cells is roughly $0.10 per watt, or $600 to $800 in additional cost. Section 232 has previously been used for steel, aluminium, copper, autos and semiconductors. Polysilicon is an input to both solar panels and semiconductor wafers, so the affected universe spans two sectors rather than one.
Why it matters:The market has largely stopped pricing tariff headlines, and on most days that habit is correct. This one is different on three counts and deserves attention before Thursday rather than after. First, the mechanism: a minimum import price is a floor beneath which foreign product cannot be sold at all, which is a far harder constraint than an ad valorem duty that can be absorbed or passed through. A 15% tariff is a cost; a price floor is a market-structure change, and pairing them removes the usual adjustment channels. Second, the coverage: polysilicon is not a solar input that also happens to appear in chips — it is the feedstock for semiconductor wafers, which means this action reaches into the same supply chain that Stories 1 and 2 are already re-rating on cost grounds. On a session when the market began discriminating between AI revenue and the capital intensity required to produce it, an announced increase in the cost of the base material for wafers is not a peripheral trade story. Third, the legal posture: Section 232 rests on national-security authority and has survived challenge where the Section 301 forced-labor programme — now facing three multi-state suits in the Court of International Trade — may not. Producers should not assume this action shares the litigation risk of the tariffs currently being contested. The offsetting considerations are real, which is why this reads uncertain rather than negative. Domestic producers gain pricing power and a protected demand base, the offset provision gives importers a route to avoid the cost by investing in US capacity, and the quantified impact of $600 to $800 per installation is meaningful for solar project economics but small relative to a semiconductor wafer’s finished value. The genuine risk is that the price floor proves stickier than the tariff and persists after the strategic rationale has been served.
What to watch:The Thursday proclamation for whether the minimum import prices extend to finished wafers used in semiconductors or stop at solar-grade material — that single scope question determines whether this is a solar story or a chip-supply-chain story. Watch Corning and the domestic solar manufacturers for the first clean read on who the market believes captures the protection.
— Quantifying recession risk so you don’t have to guess. Apply for membership at join.recessionalert.comD. MODERATE-IMPACT STORIES -> TOP
UNCERTAIN
8. The Dow Sets a Record While the S&P, Nasdaq and Russell All Fall — a Two-Stock Index Advance
The core facts:The Dow Jones Industrial Average rose 263.12 points, or 0.49%, to a record 54,349.00. Every other major US index fell: the S&P 500 lost 0.17% to 7,723.42, the Nasdaq 100 fell 0.83% to 29,487.79, the Russell 2000 dropped 0.65% to 3,017.13, and the Dow Jones Transportation Average declined 0.94% to 21,576.0. The NYSE Composite, the broadest available gauge, rose 0.21% to 24,513.81 — outperforming the S&P 500 for the session. Five of eleven S&P sectors advanced. The Dow’s gain was driven by earnings-led blue-chip strength, with Eli Lilly rising 4.86% and Amgen 4.57%, both covered in Section F. This inverts the configuration of the prior session, when the Dow crossed 54,000 for the first time alongside record closes in the S&P 500 and a 3.32% gain in the Nasdaq 100.
Why it matters:A record close on a day when three of the four other major averages fall is not a broad advance; it is a price-weighted index responding to two large moves in expensive stocks. Eli Lilly trades above $1,100 a share, which in a price-weighted construction gives a 4.86% gain roughly the influence of several ordinary constituents combined. Strip Lilly and Amgen and the Dow’s record is not obviously there. The instructive detail is what the broader gauges did. Yesterday this report flagged that the NYSE Composite had risen only 0.85% against the S&P’s 1.79% on the day the record was set, and read the widening gap as leadership re-concentrating into technology. Today that relationship reversed: the NYSE Composite rose 0.21% while the S&P 500 fell 0.17%, meaning the average stock outperformed the cap-weighted index. That is the mirror image of yesterday and it is genuinely constructive — it says the decline was concentrated in the largest technology weights rather than distributed across the market. What keeps this uncertain is that a rotation into healthcare on two earnings beats is not the same thing as broadening participation, and the Russell 2000’s 0.65% decline argues against reading it that way. Small caps do not benefit from Lilly’s guidance raise. The most defensible synthesis is that today was a sector rotation dressed as an index divergence: money moved from AI infrastructure into pharmaceutical earnings, the price-weighted index happened to be positioned to capture it, and the cap-weighted index was not. Neither the record nor the decline tells you much about the market’s direction; the composition of both tells you the market is now sorting by earnings quality rather than by theme.
What to watch:Whether the NYSE Composite continues to outperform the S&P 500 for a second and third session — sustained outperformance would confirm genuine broadening rather than a one-day rotation. Watch the Russell 2000 for any move back above 3,036, its prior record, which would be the cleanest evidence that participation is widening rather than narrowing.
BEARISH
9. SpaceX Points Starlink Mobile Directly at the Carriers and the Tower REITs Fall 6% Each
The core facts:SpaceX chief operating officer Gwynne Shotwell outlined plans for a full mobile network built on low-earth-orbit satellites, describing an offering aimed directly at terrestrial wireless. The company has acquired roughly 65 MHz of spectrum from EchoStar and plans to deploy next-generation Starlink Mobile satellites in 2027 with upgraded service targeted for the end of that year, which Shotwell characterised as potentially a hundred times better than the current direct-to-cell service. The existing service already runs more than 650 direct-to-cell satellites across 22 countries with roughly 60 compatible handsets and a $10 add-on price. The market transmission landed today: tower REITs American Tower, Crown Castle and SBA Communications each fell roughly 6%, and carriers AT&T, Verizon and T-Mobile were pressured. Real Estate as a sector still closed marginally higher at +0.05%, indicating the damage was concentrated in the tower names rather than distributed across property.
Why it matters:Satellite-to-phone has been a stated threat to the tower model for several years and the market has consistently declined to price it, on the reasonable ground that low-earth-orbit constellations supplement coverage in gaps rather than replace macro towers for high-speed urban and suburban data. That objection remains technically sound. What changed today is not the physics but the balance sheet behind it. A company that just reported $7.81 billion of quarterly revenue growing 92% and $18.4 billion of quarterly capital expenditure has bought dedicated spectrum and named a delivery year. Spectrum acquisition is the fact that separates this from previous announcements: it is the input a satellite operator does not need for gap-filling and does need to compete for primary connectivity. A 6% single-session decline across all three tower REITs simultaneously is the market re-rating the terminal value of the leasing model, not trading a headline. The transmission channel is worth stating precisely, because it runs through the tenants rather than the landlords. Tower REITs do not compete with Starlink; they lease to carriers who do, on long-dated contracts with escalators. Satellite competition damages the towers only insofar as it damages carrier economics enough to change renewal behaviour at the end of those contracts — which is why the carriers were pressured on the same session. The countervailing considerations are substantial: the upgraded service is targeted for late 2027, meaning roughly eighteen months of execution risk on a company that has never operated a consumer mobile network, and the EchoStar spectrum itself comes from a group whose Hughes Satellite Systems subsidiary filed for Chapter 11 protection this week. A durable revaluation requires the service to actually ship.
What to watch:Whether the tower REITs recover the 6% within the week — a failure to do so would confirm the market has permanently marked down the terminal value rather than reacted to a headline. Watch for carrier commentary on renewal terms or tower-lease strategy, which is the channel through which any of this actually reaches tower cash flows.
BEARISH
10. Treasury Lifts Its Q3 Borrowing Estimate by $68 Billion to $739 Billion and Sets a $125 Billion Refunding for Next Week
The core facts:The Treasury’s quarterly refunding statement raised the third-quarter net marketable borrowing estimate by $68 billion to $739 billion. Alongside it, Treasury announced a $125 billion August refunding operation, with 3-year, 10-year and 30-year auctions scheduled for August 11 through 13. Section E carries the fiscal detail; the market layer is that the announcement landed on a session when both Treasury yields fell — the 10-year down 1.3 basis points to 4.614% and the 2-year down 0.9 basis points to 4.185% — and the dollar index eased 0.14% to 99.71. The yield decline was attributed to the July private-payrolls miss rather than to supply.
Why it matters:A $68 billion upward revision inside a single quarter is a meaningful change to the supply the market must absorb, and the fact that it produced no visible concession in yields on the day is the observation worth carrying forward rather than dismissing. Treasury supply is the slowest-acting of the major yield inputs: it does not move the curve on announcement day, it moves it at auction, and specifically at the tail of long-dated auctions where the marginal buyer has to be found. The August 11-13 sequence is therefore the event, not today’s statement — three auctions across the curve inside three days, into a market where the front end is simultaneously trying to price a 57% probability of a September rate hike. That combination is what makes this bearish rather than neutral. Duration buyers face an unresolved policy question at the same moment they are asked to take down $125 billion, and the 30-year leg on August 13 is where any indigestion will show up first. The moderating considerations are real. The revision reflects cash-management and receipts timing as much as it reflects a deteriorating fiscal path, and a single quarter’s estimate is routinely revised in both directions. More importantly, the yield curve currently has an offsetting bid that has nothing to do with supply: if the labour softening in Story 4 continues, duration demand rises for growth reasons and comfortably absorbs an incremental $68 billion. The risk case is the opposite pairing — a firm payrolls print on Friday that revives the hike trade, followed three sessions later by the largest supply event of the quarter. That is the specific sequence in which a refunding announcement the market ignored on the day becomes the reason for a sharp move a week later.
What to watch:The August 13 30-year auction tail and bid-to-cover ratio, which is the cleanest single read on whether $739 billion of quarterly supply is being absorbed comfortably. Watch the 10-year yield at 4.614% into the August 11 auction — a back-up above 4.70% before the auctions would signal the market is demanding concession.
BEARISH
11. Services Employment Falls Back Into Contraction While Business Activity and New Orders Both Rise — the Second Labour Signal of the Day
The core facts:The July ISM Services PMI came in slightly below consensus while the survey’s Employment Index dropped back below the 50 line into contraction from expansion the prior month, even as the Business Activity and New Orders subindices both rose. Section E carries the full composition. The market layer is that this was the second labour-demand signal of the session, arriving alongside the July private-payrolls miss, and that both pointed the same direction. Treasury yields fell modestly and September Federal Reserve rate-hike odds were cut to roughly 57% from about 67%. The services sector employs the large majority of the US workforce, making the survey’s employment component a more direct read on aggregate hiring intent than the manufacturing equivalent.
Why it matters:The internal split in this survey is the whole point and it is the reason this is bearish rather than merely soft. Business Activity and New Orders both rose, which means demand is not the problem — services firms are seeing more work, not less. Employment nonetheless fell back into contraction. A services sector that reports rising orders while cutting headcount is describing one of two conditions: either firms have found a way to serve incremental demand without incremental labour, or they do not believe the demand will persist long enough to justify hiring against it. The first is a productivity story and is favourable for margins; the second is a confidence story and is the leading edge of a slowdown. The survey cannot distinguish between them, but the pairing with the private-payrolls miss on the same day tilts the reading toward the second, because a productivity explanation should show up as strong output with flat hiring rather than as an outright hiring decline across two separate measures. What elevates this above a routine data footnote is the corroboration structure. A single soft payrolls print in a noisy, heavily revised series proves very little. A soft payrolls print and a services employment index falling into contraction on the same morning, both against a backdrop of rising activity indices, is two independent instruments reading the same thing. That combination is what moved September hike odds by ten points, and it is why Friday’s non-farm payrolls report now carries more weight than it otherwise would. The offsetting consideration is straightforward: one month does not make a trend, ISM employment subindices are among the noisiest components of the survey, and this reading follows a manufacturing print at multi-year highs only two sessions ago.
What to watch:Whether the services employment index remains below 50 in the August survey — two consecutive contractionary readings alongside expanding orders would convert this from noise into a genuine hiring-intent signal. Watch Friday’s payrolls report for whether the household and establishment surveys corroborate the same softening.
BEARISH
12. The Transports Fall 0.94% on the Day the Dow Sets a Record — the Dow Theory Non-Confirmation Returns After One Session
The core facts:The Dow Jones Transportation Average fell 203.9 points, or 0.94%, to 21,576.0 on a session when the Dow Jones Industrial Average rose 0.49% to a record 54,349.00. The Transportation Average was the weakest of the major indices, underperforming the S&P 500’s 0.17% decline, the Russell 2000’s 0.65% decline and the Nasdaq 100’s 0.83% decline. No distinct headline catalyst was identified for the move. WTI crude fell 0.98% to $75.03 and Brent was essentially unchanged at $79.31, meaning the transports declined on a session when their dominant variable cost was flat to lower. This reverses the prior session, when the Transportation Average rose 2.58% and outpaced every major average, resolving a three-session non-confirmation that this report had tracked.
Why it matters:Yesterday this report treated the transports’ 2.58% surge as the resolution of a Dow Theory non-confirmation, and argued specifically that it took a second consecutive crude decline to shift what the market believes the forward fuel curve looks like — that transports trade the expected average fuel price over the hedging horizon rather than the spot print. Today tests that argument and weakens it. Crude did not reverse; WTI fell again. Under the cost-driven thesis the transports should have held their gains at minimum. Instead they gave back more than a third of the prior session’s advance and were the worst-performing major average on the day. That pattern is difficult to reconcile with a fuel-cost story and points back toward the demand-side constraint this report identified before yesterday’s move — that the complex is not being held back by input costs but by the volume of goods it expects to move. The Dow Theory implication is unfavourable and it arrived on the least convenient possible day. The Industrials set a fresh record and the average whose function is to confirm that the physical economy is actually moving goods declined instead, restoring the divergence after exactly one session of agreement. A one-day resolution that fails immediately is weaker evidence than no resolution at all, because it demonstrates the confirming move was a trade rather than a re-rating. The honest limitation is that Dow Theory is a slow, noisy framework built for multi-week trends, and reading a single 0.94% session as a signal risks exactly the over-interpretation that made yesterday’s resolution look convincing. The transports also sit inside Industrials, which fell 1.51% as a sector on the AI-infrastructure and capital-goods weakness in Story 1, so some of today’s decline is sector beta rather than a transport-specific demand judgement.
What to watch:Whether the Transportation Average can close above its recent high while crude remains below $80 — that combination is the only clean confirmation that the physical economy is expanding rather than merely paying less for fuel. Watch whether transports underperform again on a session when Industrials are flat, which would isolate a transport-specific demand problem from sector beta.
UNCERTAIN
13. The Analyst Tape Skews to Downgrades in Retail and Auto Suppliers While Upgrades Cluster in Healthcare and Platforms
The core facts:A broad set of ratings changes landed. Upgrades: Morgan Stanley raised Archer Daniels Midland from Underweight to Equal Weight; Argus raised Bristol Myers Squibb from Hold to Buy; Deutsche Bank raised Coupang from Hold to Buy; Argus raised Digital Realty from Hold to Buy; Bernstein raised e.l.f. Beauty from Market Perform to Outperform; and Morgan Stanley resumed coverage of TJX Companies at Overweight. Downgrades: Morgan Stanley cut Aptiv from Overweight to Equal Weight; Jefferies cut Best Buy from Buy to Hold; Stifel cut TransDigm from Buy to Hold; BofA cut Vale from Buy to Neutral; and Citi cut Burlington to Neutral. Price targets were not disclosed in the source. The Bristol Myers Squibb upgrade lands two sessions after reports of merger talks involving the company. Consumer Cyclical closed down 0.40% and Consumer Defensive up 0.17%.
Why it matters:Yesterday’s ratings tape skewed heavily to downgrades concentrated in consumer and mega-cap index anchors, and this report read it as the sell side withdrawing from the part of the market that was not participating in the record. Today’s set narrows that judgement in a useful way. The downgrades did not spread across the index; they clustered specifically in discretionary retail — Best Buy and Burlington — and in the auto supply chain, with Aptiv cut on the same day Consumer Cyclical closed down 0.40%. TransDigm’s downgrade sits alongside Industrials falling 1.51%. That is a coherent sectoral judgement about the goods-consuming end of the economy rather than a general de-rating, and it corroborates the demand-side reading in Stories 11 and 12 from an entirely independent direction. Three separate instruments — a services employment index in contraction, a transport average declining on cheaper fuel, and a sell side cutting retail and auto suppliers — are describing the same weakness in physical demand on the same session. The upgrades sit on the other side of exactly that line. Bristol Myers Squibb, Digital Realty and Coupang are healthcare, data-centre real estate and a platform, none of which depend on discretionary goods volume, and the healthcare tilt aligns with the sector’s 1.19% gain and with the rotation described in Story 8. The standing limitation applies with full force: ratings changes are lagging indicators presented as forward calls, and the Bristol Myers upgrade in particular arrives after a merger-talks report rather than ahead of it, which tells you where the stock has been. Aptiv’s downgrade from a house that has been positive on it is the most genuinely informative action in the set, because it is a reversal rather than a confirmation.
What to watch:Whether further auto-supplier and discretionary-retail downgrades follow this week, which would mark the sell side moving from isolated calls to a sector view on goods demand. Watch Consumer Cyclical relative to the S&P 500 — sustained underperformance would confirm the ratings tape is reading the economy correctly rather than late.
— Separating signal from noise since 2007. Apply for membership at join.recessionalert.comE. ECONOMY WATCH -> TOP
Today’s data split sharply between goods-side momentum and services-side labor softening: GDPNow surged to 6.2% for Q3 on strong consumption and investment nowcasts, even as ADP showed private payrolls adding just 44,000 in July and ISM Services’ employment gauge fell back into contraction at 47.4. That divergence complicates the Fed’s calculus — Minneapolis’s Kashkari argued today for rate hikes to begin as soon as September even as the labor data argues for caution, while Treasury simultaneously lifted its Q3 borrowing estimate to $739 billion, adding fiscal supply to an already crowded rates backdrop. Friday’s payrolls report is now the swing factor for whether growth or labor softness dominates the September debate.
Private Payrolls Add Just 44,000 in July, Sharply Missing Estimates (ADP/PR Newswire, August 5, 2026)
What they’re saying:ADP’s National Employment Report showed private-sector employers added only 44,000 jobs in July, badly missing consensus near 68,000-70,000 and decelerating sharply from June’s revised gain near 95,000-98,000. Annual pay growth held at 4.4% for job-stayers, while job-changers’ pay gains accelerated to 7.0%, the fastest since August 2025.
The context:The report reinforces a summer hiring slowdown as employers stay cautious amid elevated rates. Treasury yields eased and the dollar weakened on the print as traders further discounted near-term Fed tightening odds — even as Minneapolis Fed’s Kashkari argued hours later that policy should tighten anyway.
What to watch:BLS’s official July jobs report, due Friday, August 7 — consensus expects nonfarm payrolls near 80K after June’s 57K, with the unemployment rate seen holding at 4.2%.
ISM Services Index Holds at 54.1 as Employment Component Falls Back Into Contraction (ISM/PR Newswire, August 5, 2026)
What they’re saying:The ISM Services PMI printed 54.1% in July, a 25th straight month of expansion but slightly below the 54.5% consensus. Business Activity jumped 3.7 points to 59.1% and New Orders rose to 57.2%, but the Employment Index reversed sharply to 47.4% — a 3.8-point drop from June’s 51.2% and back into contraction after just one month above 50.
The context:The split between robust activity/orders and contracting service-sector hiring echoes the same day’s soft ADP print, adding to evidence that firms are managing demand without adding headcount. Prices Paid also accelerated to 70.3%, keeping the inflation side of the ledger uncomfortable for policymakers even as growth holds up.
What to watch:August’s ISM Services employment component, and Friday’s BLS report for confirmation of a broader services-sector hiring pullback.
Minneapolis Fed’s Kashkari Says ‘Now Is the Time’ to Start Raising Rates (CNBC, August 5, 2026)
What they’re saying:Speaking live from the Aspen Ideas Festival, Minneapolis Fed President Neel Kashkari said the FOMC should begin a gradual tightening cycle as soon as September, arguing current policy isn’t restrictive enough to bring inflation back to target. He cited resilient corporate earnings, a stable labor market, and supply-side pressure from tariffs, fertilizer disruptions, and AI infrastructure spending as reasons to act before inflation becomes entrenched.
The context:Kashkari was one of three regional presidents who dissented in favor of a hike at last week’s FOMC meeting; today’s remarks signal that dissent is hardening into a more public campaign ahead of September. The comments landed the same day as a soft ADP print, underscoring the tension between a cooling labor market and a Fed faction still focused on inflation risk.
What to watch:The September FOMC meeting and dot plot; whether other regional presidents echo Kashkari’s call.
Atlanta Fed’s GDPNow Jumps to 6.2% for Q3 on Strong Consumption and Investment Data (Atlanta Fed, August 3, 2026)
What they’re saying:The GDPNow model’s Q3 real GDP growth estimate rose to 6.2% (seasonally adjusted annual rate) on August 3, up sharply from 5.0% on July 30, after Census Bureau and ISM data lifted the nowcasts for real personal consumption (to 4.6% from 3.3%) and real private investment (to 17.9% from 15.9%).
The context:A GDPNow reading this strong, if it holds, would mark one of the fastest quarterly growth prints in years and cuts directly against the recession narratives building elsewhere in the data. The model is volatile and subject to revision as more data arrives through the quarter, but the jump underscores how resilient headline growth has been even as labor-market internals soften.
What to watch:Whether the estimate holds as more data — including Friday’s jobs report — feeds into the model; the BEA’s advance Q3 GDP release in late October.
Treasury Lifts Q3 Borrowing Estimate to $739 Billion, $68 Billion Above May Forecast (U.S. Treasury, August 5, 2026)
What they’re saying:In its quarterly refunding announcement, Treasury said it now expects to borrow $739 billion in privately-held net marketable debt during the July-September quarter, up $68 billion from its May estimate, citing lower projected net cash flows. Treasury separately detailed a $125 billion August refunding package covering $96.3 billion of maturing notes and bonds and roughly $28.7 billion in new financing, with 3-, 10-, and 30-year auctions scheduled for August 11-13.
The context:The upward revision reinforces the persistent gap between spending and revenue driving the roughly $1.9 trillion FY2026 deficit projected by the CBO, and adds incremental supply pressure to a Treasury market already digesting elevated long-end yields.
What to watch:The August 11-13 note and bond auctions for demand signals (bid-to-cover, indirect bidder share); the October refunding announcement for the Q4 borrowing estimate.
— Know the probability before the market prices in the risk. Apply for membership at join.recessionalert.comF. EARNINGS WATCH -> TOP
YESTERDAY AFTER THE BELL (Markets Reacted Today)
BEARISH
14. Space Exploration Technologies (SPCX): -13.60% | A 92% Revenue Beat Buried Under an $18.4 Billion Capex Quarter and Tomorrow’s Lockup
The Numbers:Released: AMC Tuesday, August 4. Revenue $7.81 billion, up 92% year over year from $4.07 billion, against consensus near $6.81 billion. Connectivity revenue, which includes Starlink, rose 66% to $4.3 billion with subscribers doubling to 12 million, though average revenue per subscriber fell 22% year over year on international expansion and lower-priced plans. Net loss narrowed to $541 million from $1.01 billion. Capital expenditure was $18.4 billion against $10.1 billion in the prior quarter and analyst forecasts near $13 billion, of which $15.83 billion was AI-related. Management raised its long-term revenue trajectory.
The Problem/Win:The revenue line beat by roughly a billion dollars and the subscriber base doubled, but neither fact survived contact with the capital expenditure disclosure. Capex came in $5.4 billion above the analyst forecast and nearly doubled sequentially, with the overwhelming majority directed at AI infrastructure rather than launch or constellation capacity. Compounding it, the first post-IPO lockup expires Thursday, August 6, when roughly 911.5 million insider shares become eligible with the first 20% releasable immediately. A spending shock and a supply event arriving in the same week left no buyer willing to absorb both.
The Ripple:SPCX was the largest mega-cap decliner of the session at -13.60% to $108.29 and became the template for the day’s AI-capex re-rating described in Section C, transmitting into names with no earnings event. Separately, the accompanying Starlink Mobile announcement knocked roughly 6% off American Tower, Crown Castle and SBA Communications and pressured AT&T, Verizon and T-Mobile — covered as Story 9.
What It Means:The business is growing faster than the market modelled and consuming capital faster still; at $18.4 billion a quarter the free-cash-flow crossover moves further out with every beat. Until the lockup supply clears, fundamentals are not the marginal price-setter here.
What to watch:Thursday’s lockup expiry and whether the first 20% tranche is actually sold or held — volume on August 6 and 7 is the cleanest read. Watch whether management provides a capex ceiling, the single disclosure that would let the market underwrite the spending.
UNCERTAIN
15. Advanced Micro Devices (AMD): -7.04% | Data Center Revenue Doubles, Capex Comes In at Nearly Triple the Model
The Numbers:Released: AMC Tuesday, August 4. Revenue $11.5 billion, up 50% year over year and 13% sequentially, against consensus of $11.28 billion. Non-GAAP diluted EPS $1.66, up 246% year over year, against $1.61 expected. Data Center revenue $6.7 billion, up 107% and now 58% of the company, driven by EPYC CPUs and Instinct GPUs. Client and Gaming $3.8 billion, with Client up 23% and Gaming down 31%. Embedded $977 million, up 19%. Free cash flow $1.6 billion. Capital expenditure $808 million against roughly $298 million modelled. Q3 guidance of approximately $13.0 billion plus or minus $300 million against $12.5 billion consensus, with non-GAAP gross margin guided to roughly 56%.
The Problem/Win:AMD beat on revenue, earnings and margin and guided the next quarter roughly $500 million above consensus — and fell 7%. Two lines did the damage. Capital expenditure at $808 million against a $298 million model is not a rounding difference, and it cut free cash flow sharply on a sequential basis. Second, gross margin guided to approximately 56% for Q3 is effectively flat against Q2, which tells investors the company is not converting the data-centre boom into expanding margin. Growth that requires proportionally more capital is worth a lower multiple than growth that does not.
The Ripple:The reaction transmitted straight into names with no reporting event: Lam Research fell 3.25%, Palantir 2.61%, with Applied Materials and Texas Instruments down 2-3%. That spillover is the substance of Story 1. NVIDIA diverged, rising 3.43% — the market separating the one merchant supplier whose margin structure is not in question from the rest of the complex.
What It Means:Demand for AI silicon is not the variable any more; the capital intensity of serving it is. A 107% increase in data-centre revenue that arrives with flat gross margin and tripled capex changes what the earnings stream is worth, not how large it is.
What to watch:Whether Q3 gross margin comes in above the 56% guide when AMD reports — margin expansion would retire the thesis that the company is buying its growth. Watch NVIDIA’s next report for whether the same capex pressure appears at the market leader.
BULLISH
16. Arista Networks (ANET): +3.57% | The First $3 Billion Quarter, and the Third Guidance Raise of the Year
The Numbers:Released: AMC Tuesday, August 4. Revenue $3.04 billion, up 37.7% year over year and 7.22% above consensus — the company’s first quarter above $3 billion. Non-GAAP diluted EPS $1.02 against $0.89 expected, a 15.18% beat. Non-GAAP operating margin 49.9% versus 48.8% a year earlier; GAAP operating margin 45.4% versus 44.7%. Full-year 2026 revenue guidance raised to approximately $12.6 billion, implying 40% growth and marking the third increase this year, with full-year gross margin guided to 62%-64% and operating margin to 48%-49%. Q3 guidance of roughly $3.3 billion revenue, gross margin near 63% and EPS of $1.06-$1.08.
The Win:Arista did precisely what the rest of the AI complex failed to do this session: it grew revenue 37.7% while expanding operating margin more than a full point year over year. A third guidance raise inside a single year is unusual and signals demand visibility rather than a one-quarter surge. Management indicated AI networking demand remains materially above available supply, and that growth is no longer confined to back-end AI deployments — the front-end and enterprise layers are contributing.
The Ripple:Arista closed +3.57% at $197.31 and was one of only five mega-cap gainers, holding its gain on a session when the broader chip and AI-infrastructure complex sold off hard. That divergence is meaningful: the networking layer captured the AI spend while the silicon layer was penalised for the capital required to produce it.
What It Means:Arista is the counterexample to Story 1’s thesis and the strongest evidence that the market is discriminating rather than exiting AI. Where the capital intensity is low and the margin expands, the multiple is intact.
What to watch:Whether the 48%-49% full-year operating margin guide holds as revenue scales toward $12.6 billion — margin compression at scale is the one thing that would break this story. Watch the Q3 print against the $3.3 billion guide for a fourth consecutive raise.
BULLISH
17. Amgen (AMGN): +4.57% | Revenue Beats by $670 Million and Both Ends of Guidance Move Up
The Numbers:Released: AMC Tuesday, August 4. Revenue $10.1 billion, up 10% year over year and $670 million above the $9.43 billion consensus. Adjusted EPS $6.29 against $5.60 expected, a 12.3% beat. Full-year 2026 guidance raised to $38.2-$39.4 billion in revenue and $22.30-$23.50 in non-GAAP EPS. Six key growth drivers — Repatha, EVENITY, TEZSPIRE, rare disease, innovative oncology and biosimilars — grew 26% year over year and now represent nearly 70% of product sales. Repatha sales rose 37%, UPLIZNA 90%, biosimilars 29% and PAVBLU 121%. Twenty-two products posted double-digit growth and 17 are running above $1 billion annually. Free cash flow $3.5 billion; dividend $2.52, up 6%.
The Win:The quality of the beat matters more than its size. Twenty-two products growing at double digits and 17 above a $1 billion run rate is the definition of a portfolio that does not depend on any single asset, and the six named growth drivers advancing 26% while reaching 70% of product sales means the mix shift toward the newer franchises is essentially complete. Repatha at +37% on VESALIUS-CV outcomes data is a franchise re-accelerating years after launch, which is rare.
The Ripple:Amgen closed +4.57% at $407.83, the second-largest mega-cap gainer, and together with Eli Lilly supplied the bulk of the Dow’s record close described in Story 8. Healthcare was the second-best sector at +1.19%, and Thermo Fisher rose 2.32% in sympathy.
What It Means:On a session when the market punished growth that costs capital, it paid up for growth that arrives with $3.5 billion of quarterly free cash flow and a rising dividend. That contrast is the rotation described in Story 8 in a single name.
What to watch:The announced CFO transition and whether the raised $22.30-$23.50 EPS range survives it intact. Watch biosimilar pricing, the one line in the portfolio where 29% growth is most vulnerable to competitive entry.
UNCERTAIN
18. Gilead Sciences (GILD): -3.96% | PrEP Clears $1 Billion in a Quarter for the First Time and the Stock Falls Anyway
The Numbers:Released: AMC Tuesday, August 4. Base business sales rose 10% year over year to $7.6 billion, the strongest second-quarter growth in three years. HIV sales rose 12% to $5.7 billion. Yeztugo, the long-acting injectable PrEP product, recorded $232 million, up 40% sequentially, with more than 70% of users returning for reinjection at six months; the company maintained its expectation of roughly $1 billion in full-year Yeztugo sales. Total PrEP sales exceeded $1 billion in a quarter for the first time, more than doubling year over year, and now run at a $4 billion annual rate. Full-year HIV growth guidance was raised to 9%-10% from 8%, base-business sales guidance to $29.8-$30.1 billion and total product sales to $30.1-$30.4 billion. The quarter carried a large reported per-share loss.
The Problem/Win:The operating story is unambiguously good — three separate guidance raises, a new franchise crossing $1 billion quarterly, and a 70% six-month persistence rate on Yeztugo that answers the central adherence question for long-acting PrEP. The stock still fell nearly 4%. The most defensible explanation is the sizeable reported loss for the quarter and the fact that the raises, while real, were modest against a share price that had already discounted the PrEP ramp. This was a good quarter that was already in the price.
The Ripple:Gilead’s decline ran directly against Healthcare’s 1.19% sector gain and against Eli Lilly and Amgen, both up more than 4.5% on the same session. Within a sector that led the market, Gilead was the conspicuous exception — the rotation described in Story 8 was selective even inside its favoured sector.
What It Means:A $4 billion annualised PrEP franchise with demonstrated persistence is a genuine long-duration asset, but the market has already paid for it. From here the stock needs the base business, not the new franchise, to do the work.
What to watch:Whether Yeztugo’s six-month reinjection rate holds above 70% in the next quarter — persistence, not initiation, determines the franchise’s terminal value. Watch the FDA decision timeline on the once-weekly oral PrEP filing, which would extend the franchise beyond injectables.
BULLISH
19. Booking Holdings (BKNG): +6% | Gross Bookings Beat the Top of Guidance by Three Points With Middle East Disruption Still Assumed
The Numbers:Released: AMC Tuesday, August 4. Gross bookings $51.0 billion, up 9% year over year and 8% in constant currency, exceeding the high end of guidance by approximately three percentage points. Room nights 325 million, up 5%. Revenue $7.4 billion, up 8%. Diluted EPS $2.53, up 131%; adjusted EPS $2.54, up 15%. Capital returned to shareholders totalled $4.1 billion, the highest quarterly figure in company history, comprising $3.7 billion of buybacks and $300 million of dividends. The cost-savings target was raised to $650 million. Q3 guidance calls for room nights up 3%-5% and gross bookings, revenue and adjusted EBITDA each up 4%-6%; full-year guidance is for high single-digit growth in bookings, revenue and adjusted EBITDA with adjusted EPS growth in the low-to-mid teens.
The Win:The beat is more impressive than the headline percentage suggests because of what the guidance assumed. Management set the bar with persistent indirect Middle East effects built in — elevated flight prices and reduced capacity — and cleared the top of it by three points anyway. Travel demand absorbed a supply shock that the company had explicitly told investors would constrain it. The record $4.1 billion capital return, at 55% of the quarter’s revenue, signals management sees no better use for the cash than its own shares.
The Ripple:A 9% gross-bookings gain with Middle East disruption assumed is a constructive read on discretionary consumer spending that sits awkwardly against the goods-side weakness in Stories 11, 12 and 13 — services demand is holding where goods demand is not. Notably, management disclosed that AI-driven referrals remain below 1% of room nights, a data point that undercuts the disruption thesis applied to online travel.
What It Means:Booking is compounding earnings through a geopolitical supply shock while shrinking the share count aggressively. The Q3 deceleration to 4%-6% growth is the honest caveat, but it is guidance from a management team that just beat its own top end.
What to watch:Whether the AI referral share stays below 1% of room nights next quarter — an inflection there is the only genuine structural threat to the model. Watch whether the Q3 guide of 4%-6% proves as conservative as the Q2 guide did.
TODAY BEFORE THE BELL (Markets Already Reacted)
BULLISH
20. Eli Lilly (LLY): +4.86% | Revenue Up 48% on $14.9 Billion of Incretin Sales, Full-Year Guidance Raised by $3 Billion
The Numbers:Released: BMO. Revenue $22.97 billion, up 48% year over year and 11.07% above the $20.69 billion consensus. Non-GAAP EPS $8.38 against $6.17 expected, a 35.86% beat and up 33% year over year; GAAP EPS $7.94 versus $7.33 expected, up 26%. Mounjaro and Zepbound generated a combined $14.9 billion: worldwide Mounjaro revenue rose 91% to $9.9 billion with US revenue up 45% to $4.8 billion, and US Zepbound revenue rose 44% to $4.9 billion on strong demand partially offset by lower realised prices. Full-year 2026 revenue guidance was raised to $85-$87 billion from $82-$85 billion; adjusted EPS guidance was narrowed to $35.50-$36.50 from $35.50-$37.00. Market capitalisation $1.10 trillion.
The Win:A $2.28 billion revenue beat and a $3 billion increase to the bottom of full-year guidance is the largest single upward revision of the reporting season so far. The composition is what makes it credible: 91% growth in Mounjaro is volume-driven, and management explicitly flagged that Zepbound’s 44% US gain came despite lower realised prices — meaning the franchise is absorbing price erosion and still compounding. The narrowed EPS range, trimming the top end from $37.00 to $36.50, is the one qualification and reflects the cost of that volume.
The Ripple:Lilly was the session’s largest mega-cap gainer at +4.86% to $1,169.86 and, as a trillion-dollar company trading above $1,100 a share, supplied the single largest contribution to the Dow’s record close described in Story 8. Healthcare gained 1.19% against a falling S&P 500. Lilly’s strength came as Novo Nordisk fell on its own obesity-franchise concerns, sharpening the share-shift narrative in incretins.
What It Means:Lilly is now large enough that its earnings surprises move the index, and the incretin franchise is still accelerating three years into launch while ceding price. Volume growth of this magnitude with declining realised prices is a market-share story, not a pricing one.
What to watch:Realised price per Zepbound prescription in Q3 — continued erosion at 44% volume growth is fine, but the trade-off breaks if volume decelerates first. Watch the gap between the raised $85-$87 billion revenue range and the narrowed EPS range, which quantifies the margin cost of the volume.
BULLISH
21. Shopify (SHOP): +17.02% | More Than 30% Growth in GMV, Revenue, Gross Profit and Free Cash Flow Simultaneously
The Numbers:Released: BMO. Revenue $3.58 billion, up 34% year over year and 3.94% above the $3.45 billion consensus. Non-GAAP EPS $0.42 against $0.40 expected; GAAP EPS $1.16 against $0.31 expected, a 277% beat. Gross merchandise volume $115.6 billion, up 32%. Gross profit $1.71 billion. Free cash flow $654 million at an 18% margin. Operating income $488 million; net income $1.50 billion, or $439 million excluding equity investment impacts. Subscription solutions revenue $802 million and merchant solutions $2.78 billion. Q3 guidance calls for revenue growth in the low thirties percent, gross profit dollar growth in the mid-to-high twenties, and free cash flow margin in the high teens to low twenties. AI-driven orders tripled year over year.
The Win:The achievement is the synchronisation. Growing GMV, revenue, gross profit and free cash flow all above 30% at the same time is rare at this scale and rules out the usual explanations — this is not volume bought with margin or growth funded by cash burn. The AI disclosure is the part that drove the 17% move: orders originating from AI tripled year over year, which reframes generative AI as a demand channel for merchants rather than a disintermediation threat to the platform. That is the opposite of the thesis the market had been carrying.
The Ripple:Shopify’s 17.02% gain was the largest single-name move among $100 billion-plus reporters and stood in direct opposition to the AI-capex de-rating in Story 1 — evidence that the market is punishing AI capital intensity while paying up for AI revenue that arrives without it. A 32% GMV gain also cuts against the discretionary-goods weakness in Stories 11 and 13.
What It Means:Shopify has resolved the central bear case on commerce platforms — that AI agents would route transactions around them. Tripling AI-originated orders says the platform is capturing the channel, not losing to it.
What to watch:Whether Q3 revenue growth holds in the low thirties as guided — the guide implies deceleration from 34%, and after a 17% single-session move the stock has no cushion for a miss. Watch AI-originated order share as a disclosed metric in future quarters.
BULLISH
22. Walt Disney (DIS): +3.65% | Record $10 Billion Experiences Quarter and the Buyback Goes to $9 Billion
The Numbers:Released: BMO, fiscal Q3 2026. Revenue $25.25 billion, up 7% year over year but 0.57% below the $25.39 billion consensus. Adjusted EPS $2.06 against $1.86 expected, an 11.01% beat, up from $1.61 a year ago; GAAP EPS $1.51 against $1.68 expected, a 10.22% miss. Operating income rose 21% to $5.6 billion. Disney Experiences posted record quarterly revenue of $10 billion, up 10%, on 4% global guest growth, 3% domestic park attendance gains and 4% higher per-capita spending. Direct-to-consumer streaming revenue rose 11% to $5.53 billion at a 13% SVOD operating margin, keeping the segment on track for double-digit margins this fiscal year. The share repurchase target was raised to at least $9 billion from $7 billion. Results included a $100 million tariff refund and the box-office contribution from Toy Story 5.
The Win:Operating income up 21% on revenue up 7% is the whole quarter in one comparison — Disney converted modest top-line growth into three times the operating leverage. Experiences at a record $10 billion with per-capita spending up 4% says the parks retain pricing power, and a 13% streaming operating margin retires the question of whether direct-to-consumer can be structurally profitable. Raising the buyback by $2 billion is a management vote of confidence in the cash flow. The GAAP miss and the small revenue shortfall are the honest qualifications.
The Ripple:Disney’s 3.65% gain came on a session when Communication Services fell 2.36% as the worst sector, meaning it materially outperformed its own sector group and offset part of the Alphabet-driven damage described in Story 2. Consumer discretionary spending at the parks also runs against the goods-demand weakness identified in Stories 11 and 13 — the same services-versus-goods split visible in Booking’s results.
What It Means:The two segments that were structural concerns — parks cyclicality and streaming profitability — both delivered in the same quarter. Disney is now a cash-return story with a credible margin trajectory rather than a turnaround.
What to watch:Whether SVOD operating margin holds above 13% in fiscal Q4 — the double-digit full-year commitment depends on it. Watch domestic park attendance, up only 3% against 4% global growth, for any sign the US consumer is the weaker leg.
UNCERTAIN
23. Uber Technologies (UBER): -5.29% | Bookings Beat the Top of Guidance, Revenue and the Q3 Outlook Both Come Up Short
The Numbers:Released: BMO. Revenue $14.19 billion, 0.31% below the $14.24 billion consensus. Adjusted EPS $0.81 against $0.80 expected; GAAP EPS $1.17 against $0.83 expected, a 40.46% beat. Gross bookings rose 22% year over year to more than $58 billion, above the top end of guidance, helped by roughly 8 million World Cup travellers. Trailing twelve-month free cash flow exceeded $10 billion for the first time. Q3 guidance calls for gross bookings of $58.25-$60.25 billion, a $59.25 billion midpoint against $59.33 billion expected, and non-GAAP EPS of $0.84-$0.88 against $0.89 consensus.
The Problem/Win:Uber delivered its strongest operating quarter as a public company on the metrics that describe the business — bookings up 22% above the guidance ceiling, and a first-ever $10 billion trailing free-cash-flow figure — and the stock fell 5.29%. The disconnect sits in the two lines that describe the next quarter. Revenue came in marginally light while bookings beat, meaning take rate compressed, and the Q3 EPS guide of $0.84-$0.88 sits below consensus at every point in the range. A World Cup-assisted bookings number that does not convert into revenue or forward earnings is a quality-of-growth problem.
The Ripple:Uber’s decline ran alongside Consumer Cyclical’s 0.40% sector fall and reinforces the pattern in Stories 11, 12 and 13 — but with an important qualification. Where Booking and Disney showed services demand holding up, Uber shows services volume holding up while the economics of serving it deteriorate. That is the same distinction Story 1 draws about AI: the market is now pricing the cost of growth, not its rate.
What It Means:Uber has decisively won the volume argument and is now being judged on take rate and incremental margin. A guide below consensus on both bookings and EPS after a bookings beat is the market asking what the growth is worth, not whether it is real.
What to watch:Take rate in Q3 — the gap between a bookings beat and a revenue miss is the entire story, and it either closes or compounds. Watch whether the bookings run rate holds once the World Cup contribution drops out of the comparison.
UNCERTAIN
24. CVS Health (CVS): -5.08% | Net Income Nearly Triples and Guidance Goes Up — Then the Call Flags Caremark Membership Losses
The Numbers:Released: BMO. Revenue $106.10 billion, up 6.07% against the $100.03 billion consensus. Adjusted EPS $2.58 against $1.85 expected, a 39.14% beat; GAAP EPS $2.31 against $1.60 expected, a 44.47% beat. Net income $2.9 billion, nearly tripling year over year. All three segments — insurance, pharmacy and health services — exceeded revenue expectations. Aetna’s medical benefit ratio improved to 87.4% from 89.9% a year earlier and against 89.8% expected. Full-year 2026 revenue guidance was raised to at least $414 billion from at least $405 billion, and adjusted EPS guidance to $7.90-$8.10 from $7.30-$7.50. The company also announced a weight-loss drug arrangement with Eli Lilly.
The Problem/Win:On the numbers this was the strongest quarter of the CVS turnaround: a 240 basis point improvement in Aetna’s medical benefit ratio against expectations for essentially no improvement is the single metric the entire investment case has rested on for two years, and it moved decisively. Net income tripled and both ends of full-year EPS guidance rose 60 cents. The stock fell 5.08% anyway, on management commentary during the call flagging expected membership declines at Caremark, the pharmacy benefit manager. The market chose the forward volume disclosure over the current margin recovery.
The Ripple:CVS fell on a session when Healthcare was the second-best sector at +1.19% and both Eli Lilly and Amgen gained more than 4.5% — the second name after Gilead to decline within a leading sector. The PBM membership signal is the read-through worth carrying: it points at pricing pressure across the pharmacy benefit management channel rather than at CVS specifically.
What It Means:The Aetna problem that broke this stock is measurably fixed. The market has simply moved on to the next one, and Caremark’s membership base is a larger and less tractable question than a medical loss ratio.
What to watch:The scale of Caremark membership attrition when quantified in the next quarter — management flagged the direction but not the magnitude. Watch whether Aetna’s medical benefit ratio holds near 87.4%, since a single quarter of improvement is not yet a trend.
TODAY AFTER THE BELL (Markets React Tomorrow)
UNCERTAIN
25. Sandisk (SNDK): -4% AH | Revenue Up 372%, Gross Margin at 84.6%, a $14 Billion Buyback — and the Stock Falls
The Numbers:Released: AMC, 4:30 PM ET, fiscal Q4 2026. Revenue $8.965 billion, up 372% year over year and comfortably above the $8.48 billion consensus. Adjusted EPS $39.25 against $34.96 expected, exceeding projections by roughly 14%. GAAP net income $6.903 billion against a $23 million loss a year earlier, with diluted GAAP EPS of $43.97 versus a $0.16 loss. Gross margin expanded to 84.6%, with growth driven by the Datacenter and Edge segments. The company authorised an additional $14 billion share repurchase. Q1 2027 revenue is guided to a midpoint near $10.55 billion. Shares initially fell more than 8% in extended trading before paring the decline to roughly 4% at $1,287.67.
The Problem/Win:By every operating measure this was an exceptional quarter — revenue nearly quintupling, an 84.6% gross margin that is extraordinary for any hardware business, a swing from loss to $6.9 billion of GAAP net income, and forward guidance implying continued sequential growth to $10.55 billion. The stock fell regardless. The explanation is positioning rather than performance: Sandisk had risen roughly 500% in 2026 before the print, and a beat of 14% on EPS was not large enough against expectations embedded at that level. This is a valuation reaction, not an operational one.
The Ripple:Sandisk gained 10.84% on Tuesday on no company-specific catalyst, part of the merchant-supplier rally this report documented, and gave part of it back after reporting. Together with Western Digital’s simultaneous decline, this is the second and third confirmation of the pattern in Story 1: the memory complex is delivering the pricing but the market is no longer paying more for it.
What It Means:NAND undersupply is translating into margin exactly as the bull case required, and the stock still could not rally. That gap between fundamental delivery and price response is the clearest evidence that the memory trade is now a crowded-positioning problem rather than a demand question.
What to watch:Whether NAND price increases hold through the September quarter and whether the 84.6% gross margin is sustained — that margin is the entire valuation. Watch execution of the $14 billion buyback, which is the mechanism most likely to support the shares near term.
UNCERTAIN
26. Western Digital (WDC): -5.36% AH | Beats on Both Lines, Guides Above Consensus, Sells Off Anyway
The Numbers:Released: AMC, fiscal Q4 2026. Revenue $3.75 billion, up 44% year over year and above the $3.69 billion consensus. EPS $3.56 against $3.29 expected, a beat of $0.27 or 7.88%. Gross and operating margins both expanded and earnings per share more than doubled year over year. Q1 2027 guidance calls for adjusted EPS of $3.85-$4.15 against a $3.81 estimate and revenue of $4.0-$4.2 billion against $4.01 billion expected — a $4.1 billion midpoint approximately 1.5% above consensus. Following the 2025 separation of its flash memory business into Sandisk, Western Digital is now a pure-play hard-disk-drive company. Shares fell 5.36% in extended trading.
The Problem/Win:Western Digital beat revenue, beat earnings, expanded both margin lines, doubled EPS and guided the next quarter above consensus on both metrics — and fell more than 5%. There is no operational fault to identify. The stock had risen over 200% in 2026 into the print on HDD pricing power, and a 7.88% EPS beat with a 1.5% guidance raise is simply not enough to service that positioning. The market wanted an acceleration and received a continuation.
The Ripple:Western Digital and Sandisk — separated from the same parent little more than a year ago — reported on the same evening and both sold off on beats. Two independent storage businesses delivering pricing power to no reward is a stronger signal than either alone, and it extends Story 1’s thesis from AI silicon into storage media. Read-through is negative for Seagate and the broader storage complex.
What It Means:The HDD upcycle is intact and the pure-play structure is delivering exactly what it was designed to. The share price has simply already paid for two more quarters of it.
What to watch:Whether the Q1 2027 guide of $3.85-$4.15 is beaten decisively rather than met — after a 200% run, meeting guidance is now a negative outcome. Watch Seagate’s next print for confirmation that HDD pricing is an industry condition rather than a Western Digital execution story.
BEARISH
27. AppLovin (APP): -20% AH | 53% Revenue Growth Is Not Enough When It Misses, and the Guide Comes In Light Too
The Numbers:Released: AMC. Revenue $1.92 billion, up 53% year over year but below the $1.94 billion consensus. Diluted EPS of $3.76 came in under the $4.21 estimate. Adjusted EBITDA margin held at 84%. Q3 revenue is guided to $2.06-$2.09 billion, roughly 0.6% below analyst estimates at the midpoint. Shares fell about 20% in extended trading.
The Problem:A 20% decline on a 1% revenue miss is the clearest illustration of operating leverage running in reverse at a high multiple. The revenue shortfall was roughly $20 million on a $1.94 billion expectation and the guidance shortfall was six-tenths of one percent — neither is a business failure. But AppLovin has been valued as a company that beats and raises, and it did neither. The EPS miss is the more substantive item: falling meaningfully short on earnings while holding an 84% EBITDA margin implies the gap sits below the operating line rather than in the core advertising engine.
The Ripple:AppLovin is the fourth after-hours decline of the evening alongside Sandisk, Western Digital and, on the prior evening, AMD — an unbroken sequence of high-multiple technology names selling off on results ranging from strong beats to a marginal miss. That consistency, more than any single reaction, is what sets up Thursday’s open and what Cloudflare and Datadog report into.
What It Means:At 53% growth and an 84% EBITDA margin the business remains exceptional; the multiple simply required perfection and did not get it. The de-rating is about what investors will pay for growth, not whether the growth exists.
What to watch:Whether the e-commerce advertising segment is disclosed as the source of the shortfall, since that is the growth vector the valuation rests on. Watch whether the 84% EBITDA margin holds in Q3 — margin erosion alongside a revenue miss would convert a de-rating into a thesis break.
BULLISH
28. McKesson (MCK): AH: n/a | Non-GAAP EPS Beats by $0.39 and Full-Year Guidance Moves Up Again
The Numbers:Released: AMC, 4:30 PM ET, fiscal Q1 2027. Non-GAAP EPS $9.93, beating the $9.54 consensus by $0.39; the consensus carried into the print was $9.56. Full-year fiscal 2027 adjusted EPS guidance was raised to $44.20-$45.00 from $43.80-$44.60, with revenue guided to $423.60-$439.74 billion. Revenue consensus for the quarter was $103.88 billion. Context from the prior quarter: consolidated revenues of $96.3 billion rose 6%, adjusted diluted EPS of $11.69 rose 16%, and the company entered a $2.25 billion accelerated share repurchase with total buyback authorisation at $7.7 billion as of April 2026. The after-hours price reaction was not available at the time of writing.
The Win:A 4% EPS beat paired with a raise to both ends of full-year guidance is a clean quarter from a business with structurally thin margins, where distribution EPS growth comes from volume, mix and buyback rather than pricing. Raising the floor of the annual range by 40 cents in the first quarter of the fiscal year signals confidence in the remaining three, which is not the usual posture for a drug distributor this early.
The Ripple:McKesson’s result completes an unusually strong healthcare slate — Lilly, Amgen and now McKesson all beating and raising on the same day the sector gained 1.19% while the S&P 500 fell. It also sits directly opposite CVS: distribution economics are improving while pharmacy benefit management volumes are flagged as declining, which points at value migrating along the drug supply chain rather than contracting within it.
What It Means:McKesson is compounding through the same GLP-1 volume wave that is driving Lilly, capturing it as distribution throughput rather than drug margin. That is a lower-beta way to hold the same secular trend.
What to watch:Tomorrow’s opening price reaction, unavailable at the time of writing, against the raised $44.20-$45.00 guidance range. Watch specialty and oncology distribution growth, the segments carrying the margin mix.
WEEK AHEAD PREVIEW:
Q2 2026 earnings season is 61% reported, with an 86% EPS beat rate and blended growth of +47.4% year over year. Thursday, August 6 brings five reporters above $100 billion in market capitalisation.
ConocoPhillips (COP) — BMO, Thursday August 6 — consensus near $2.89-$2.96 EPS on revenue around $18.8-$19.8 billion, up more than 100% year over year. Key focus: the company is unhedged on both oil and LNG production, making it the cleanest large-cap expression of the Hormuz outcome described in Story 6 — full upside to any supply disruption and full downside to a reopening. Estimates have risen 15.1% over 90 days on higher crude, so the bar has moved with the price.
Parker-Hannifin (PH) — BMO, Thursday August 6 — consensus $8.26-$8.27 EPS on revenue of $5.57 billion, fiscal Q4 and full year. Key focus: aerospace systems, where consensus sits at $1.83 billion, up 9.2% year over year, and where segment operating margin reached 29.5% last quarter; the record $12.5 billion order backlog and the CIRCOR aerospace acquisition adding roughly $500 million of annual revenue are the two swing factors. Industrials fell 1.51% today, making this a useful read on whether the weakness is demand or sentiment.
Howmet Aerospace (HWM) — BMO, Thursday August 6 — consensus $1.24 EPS on revenue of $2.43 billion, with the market expecting 18.2% year-over-year revenue growth. Key focus: whether EBITDA margin holds near the 32% reached last quarter, when operating income rose 52% and free cash flow more than doubled to $359 million; commercial aerospace and gas-turbine demand are the drivers, and the gas-turbine line is a direct read on data-centre power build-out.
Datadog (DDOG) — BMO, Thursday August 6 — company guidance of $1.07-$1.08 billion revenue and $0.57-$0.59 adjusted EPS, against consensus of $1.079 billion and $0.583, the latter up 26.1% year over year. Key focus: whether observability spending is being funded out of the same AI budgets now under scrutiny in Story 1; roughly 4,550 customers above $100,000 in annual recurring revenue, up 21%, and the newer AI products including GPU Monitoring and Bits AI Security Analyst are where the answer shows up.
Cloudflare (NET) — AMC, Thursday August 6 — company guidance of $664-$665 million revenue against consensus of $665.4 million, up 30% year over year, with non-GAAP EPS of $0.27, up 28.6%. Key focus: Jefferies expects revenue acceleration and a full-year raise, with investors looking for a credible path to mid-30% growth by the end of 2026. As the last of the four AI-adjacent software names reporting this week, it lands after Thursday’s reaction to Datadog and after the four consecutive after-hours technology selloffs described in Story 27.
Friday, August 7 reporters are not yet visible in the earnings calendar and are carried forward. The next FactSet Earnings Insight update is due August 7.
— US market commentary trusted by family offices and institutions. Apply for membership at join.recessionalert.comG. WHAT’S NEXT -> TOP
UPCOMING RELEASES:
| Date | Event | Why It Matters |
|---|---|---|
| Thu, Aug 6 | Initial Jobless Claims (expected 202K); Continuing Claims (expected 1,790K) | The highest-frequency labour read available, and the first chance to corroborate or contradict today’s 44,000 ADP print. A jump above 210K would turn a one-month deceleration into a trend the day before payrolls. |
| Thu, Aug 6 | Challenger Job Cuts (July) | Announced layoffs lead separations by weeks. With the ISM services employment index back in contraction at 47.4%, a rising cut count would confirm firms are reducing headcount rather than merely pausing hiring. |
| Thu, Aug 6 | Nonfarm Productivity Q2 Prelim (expected 0.6%); Unit Labour Costs Q2 Prelim (expected 2.1%) | Directly adjudicates today’s central ambiguity: services firms reporting rising orders while cutting staff is either a productivity story or a confidence story. Strong productivity with contained unit labour costs supports the benign reading and eases the Fed’s inflation problem. |
| Thu, Aug 6 | Section 232 polysilicon proclamation — 15% tariff plus minimum import prices | A price floor is a market-structure change, not an absorbable cost. The scope question is what matters: whether the minimum prices extend to semiconductor-grade wafers or stop at solar-grade material determines if this is a solar story or a chip supply-chain story. |
| Thu, Aug 6 | Fed’s Musalem speaks (5:30pm ET) | The fifth consecutive session of Fed commentary. Markets have cut September hike odds to ~57% against explicit hawkish guidance from Kashkari and Cook; another voice endorsing that framing would test how long the market can keep pricing against the committee. |
| Fri, Aug 7 | Non-Farm Payrolls (July, expected 80K after June’s 57K) | The single most important input of the week and the confirmation or refutation of today’s private-payrolls signal. It is the release most likely to settle the September question in either direction. |
| Fri, Aug 7 | Unemployment Rate (July, expected 4.2%) | The household survey provides an independent read on the establishment number. A move above 4.2% alongside a soft payrolls print would shift the market from treating weak data as dovish to treating it as recessionary. |
| Fri, Aug 7 | Average Hourly Earnings (July, expected +0.3% MoM / +3.5% YoY) | The wage side of the Fed’s problem. ADP showed job-changers’ pay accelerating to 7.0%, the fastest since August 2025 — an AHE upside surprise on a weak headline is the worst combination for the hold-versus-hike argument. |
| Fri, Aug 7 | Consumer Inflation Expectations (July, expected 3.7%); Fed’s Barkin speaks (10:00am ET) | Expectations near 3.7% remain well above target and are the specific variable Kashkari cited in arguing that waiting risks entrenchment. Barkin speaks hours after the payrolls print, making his the first official reaction to it. |
| Tue-Thu, Aug 11-13 | $125 billion Treasury refunding — 3-year, 10-year and 30-year auctions | Supply moves the curve at auction, not at announcement. Three auctions in three days into an unresolved policy question is the sequence where a $68 billion borrowing revision the market ignored today becomes a sharp move. The August 13 long bond tail is the cleanest read on absorption. |
KEY QUESTIONS:
1. If Friday’s payrolls report confirms today’s ADP and ISM services signal, do equities rally on it as dovish — or does a second consecutive soft labour print mark the moment the market starts reading weak data as recessionary rather than accommodative?
2. How long can the front end keep cutting September hike odds while a permanent Board voter and three dissenting regional presidents argue the other way — does the labour data settle the argument before the committee does, or does the rhetoric reassert itself into the meeting?
3. Is today’s AI-infrastructure selling a rotation toward the names whose margin structure is not in question — NVIDIA rose 3.43% against the tape — or the first stage of a broader de-rating of capital intensity across the entire complex?
H. CHART OF THE DAY -> TOP
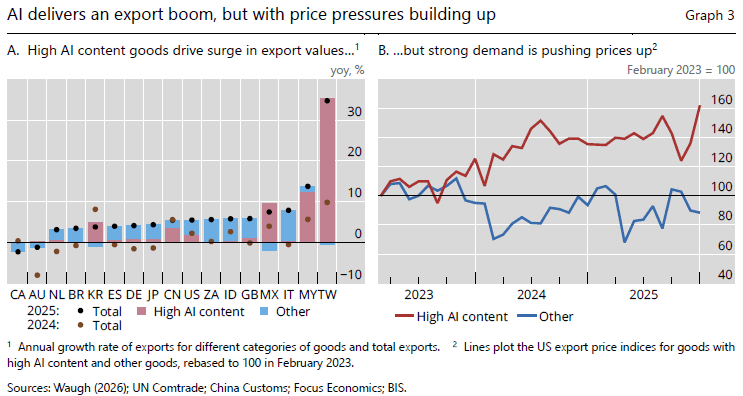
Strip the AI column out and Taiwan’s export miracle turns negative. The tallest bar on the chart belongs to the narrowest book: +35.3pp from high-AI-content goods against -0.6pp from everything else Taiwan sells. Mexico and Korea are the same shape — AI contributing more than the whole of their export growth, headlines of +7.5 and +3.8 sitting on non-AI books shrinking at -2.1 and -1.1. In Korea, five firms took 43% of export earnings in Q1 2026, up from 27% two years earlier. America is the control case: AI is 36% of US export growth and the rest of the book still grows. What the other three have booked, though, is largely price, not production. Investment by AI firms has far outrun investment by semiconductor producers, and fab and memory capacity is fixed for eighteen to thirty-six months, so quantity cannot clear the market and price does the rationing — data centres now take roughly 70% of world memory output, DRAM contracts rose 93-98% quarter-on-quarter in Q1, and US high-AI-content export prices sit at 157 against 83 for everything else. The $700bn expected in 2026 therefore buys materially less silicon than it would have in 2023, and the invoice arrives in America: AI-related goods were 23% of imports last year, and residential electricity is rising at twice its normal pace. Concentration into a customer is survivable. Concentration into a price is not.
Market Intelligence Brief (MIB) Ver. 18.47
For professional investors only. Not investment advice.
© 2026 RecessionALERT.com

Comments are closed.