
MARKET INTELLIGENCE BRIEF (MIB)
Tuesday, August 4, 2026
Records everywhere: Dow tops 54,000 for the first time, S&P 500 hits 7,736.49. Brent collapses 6.08% to $78.68 as Bessent floats a Hormuz deal “today or tomorrow” — but June’s signed deal already failed on the same question. Tech rips 4.25%; Intel and SanDisk both +10.84%. AMD beats on everything and falls 8% after hours anyway. Bezos files to sell $4.07B of Amazon. JOLTS and factory orders both miss — nobody cared. Philadelphia Fed’s Paulson keeps a rate hike alive.
TABLE OF CONTENTS
A. EXECUTIVE SUMMARY
B. MARKET DATA
C. HIGH-IMPACT STORIES (5)
D. MODERATE-IMPACT STORIES (6)
E. ECONOMY WATCH (5)
F. EARNINGS WATCH (12)
G. WHAT’S NEXT
H. CHART OF THE DAY
A. EXECUTIVE SUMMARY -> TOP
Both headline averages set records — the Dow closed above 54,000 for the first time at 54,085.88 (+1.71%) and the S&P 500 took out its June high at 7,736.49 (+1.79%) — on a macro input rather than an earnings one: Brent’s 6.08% collapse to $78.68 as Washington signalled a Strait of Hormuz reopening within days. The bond market ratified the disinflation read, with the 10-year falling 6.8 bps to 4.616% and the 2-year 6.2 bps to 4.194%, a second consecutive session of stocks and bonds rallying together. But the construct rests on an unsigned agreement whose June 17 predecessor collapsed over the same routing question still unresolved, and Philadelphia Fed’s Paulson became the third official in three sessions to keep a hike in the distribution. Breadth narrowed rather than broadened: Technology’s 4.25% and two industrial sectors did nearly all the work while five advancing sectors managed under 0.6%.
• Brent -6.08% to $78.68 — breaks the $80 handle after Bessent said a Hormuz deal could land “today or tomorrow”; after the close the API reported a second consecutive crude build (+2.690M bbl against a 2.0M draw consensus)
• Technology +4.25%, Nasdaq 100 +3.32% — Intel and SanDisk both +10.84% and Dell +8.92% as the semiconductor complex reclaimed leadership after two sessions of lagging the index
• AMD fell roughly 8% after hours on a beat — revenue, earnings, margin and Q3 guidance all above consensus, but capital expenditure near triple estimates cut free cash flow about 40% sequentially
• Amazon -2.32% to $277.42, the worst mega-cap performer of a record session, after a Form 144 disclosed Bezos’s intent to sell 15 million shares (~$4.07B) under a November 2025 10b5-1 plan; the $3 trillion threshold lasted one session
• June JOLTS 7.359M (7.4M expected) and factory orders -0.3% (+0.2% expected) both missed and moved nothing — a second straight session of US macro going unpriced while crude sets the curve
• Paulson keeps a hike on the table, calling the 9-3 hold “not a close call” while estimating underlying inflation at just 2.4%-2.8%; the VIX rose 4.04% to 16.50 on a record day
1. The rally has one variable, and it is unsigned — Two consecutive sessions of equities and bonds rallying together look like a genuine easing of the inflation constraint, but nearly all of it traces to a Hormuz agreement Tehran has not confirmed and whose June 17 predecessor collapsed over the identical routing question. Brent has surrendered more than 11% in two sessions, meaning the war premium is fully out of the price: a signed deal adds little from here, while a repeat of June reprices violently from a level with no cushion. The API’s second consecutive build is the one leg of the story that owes nothing to diplomacy — Wednesday’s EIA print determines whether it holds.
2. Breadth improved for exactly one session — Three sectors produced almost the entire 1.79% while five advanced under 0.6% and Consumer Cyclical was flat at 0.00%, and the NYSE Composite’s 0.85% trailed the S&P by nearly a full point — a wider gap than Monday’s, on the day the record was set. The sell side read the same split, double-downgrading Apple and cutting Nike and Walmart while upgrading software and platforms. The counterweights are real: the Russell 2000 outperformed at +1.83% and the transports’ 2.58% finally resolved a three-session Dow Theory non-confirmation. But a record requiring Technology to add 4.25% is a record dependent on one theme, and AMD’s after-hours reaction tests that theme at Wednesday’s open.
3. US macro is accumulating unpriced — Across two sessions the economy delivered growth data of opposite sign — ISM manufacturing at multi-year highs with a 6.2% Q3 GDPNow on Monday, softening job openings and weak factory orders today — and the curve responded to neither, moving on crude both times. That backlog reprices at once when the Hormuz question resolves, and the two sides of the ledger point opposite ways. The configuration nobody is currently discounting is cooling labour demand alongside a committee that has removed cuts from its distribution and held 3.50%-3.75% for five consecutive meetings.
 — Leading economic indicators. Accurate market forecasts. Apply for membership at join.recessionalert.com
B. MARKET DATA -> TOP
Equities rallied sharply as a tech-and-semis-led advance drove the Nasdaq 100 up 3.32%, the S&P 500 1.79%, and the Dow 1.71% to fresh highs, while crude prices tumbled on easing Middle East tensions. Breadth was broad-but-uneven: seven of eleven sectors advanced, led by Technology (+4.25%) on Palantir’s blockbuster earnings beat and a broader semiconductor surge (Intel, SanDisk, Lam Research, Micron, AMD all up 7%+), even as Energy (-0.77%) reversed its status as the year’s top-performing sector. Amazon bucked the rally, falling 2.32% after Jeff Bezos disclosed plans to sell roughly $4.07 billion in shares. Despite the risk-on tone, VIX rose 4.04% and Treasury yields fell, signaling markets are still pricing geopolitical tail risk around the Strait of Hormuz even as the tape pushes higher.
CLOSING PRICES – Tuesday, August 4, 2026:
MAJOR INDICES
The rally was concentrated in growth: Nasdaq 100’s 3.32% gain outpaced the S&P’s 1.79% and the Dow’s 1.71%, while the broader NYSE Composite added just 0.85% — a sign gains were led by mega-cap tech rather than the full market. DJ Transportation’s 2.58% jump, likely tracking cheaper fuel, briefly outran the DJIA, though neither is close enough to a trend-confirmation signal yet.
| Index | Close | Change | %Move | Why It Moved |
|---|---|---|---|---|
| S&P 500 | 7,736.49 | +135.99 | +1.79% | Broad tech/semis-led rally on falling oil and Palantir’s earnings beat |
| Dow Jones | 54,085.88 | +907.47 | +1.71% | Blue-chips tracked broad risk-on tone and cheaper crude |
| DJ Transportation | 21,779.9 | +548.7 | +2.58% | Falling oil prices lowered carriers’ fuel-cost outlook |
| Nasdaq 100 | 29,733.16 | +956.36 | +3.32% | Semiconductor surge (INTC, SNDK, MU, AMD) plus Palantir’s blowout quarter |
| Russell 2000 | 3,036.33 | +54.42 | +1.83% | Broad risk-on participation across small-caps |
| NYSE Composite | 24,462.87 | +207.34 | +0.85% | Broadest gauge trailed cap-weighted peers, signaling mega-cap-led leadership |
VOLATILITY & TREASURIES
VIX jumped 4.04% even as equities rallied hard — an unusual pairing that reads as persistent geopolitical hedging rather than panic. Both the 10Y and 2Y yields fell roughly 6-7bps in tandem, a flight-to-duration bid inconsistent with a pure risk-on session. DXY was essentially flat, suggesting the dollar isn’t yet pricing the Strait of Hormuz risk the options and bond markets are.
| Instrument | Level | Change | Why It Moved |
|---|---|---|---|
| VIX | 16.50 | +0.64 (+4.04%) | Hedging demand persisted on Middle East tail risk despite the rally |
| 10-Year Treasury Yield | 4.616% | -6.8 bps | Flight-to-duration bid alongside falling oil prices |
| 2-Year Treasury Yield | 4.194% | -6.2 bps | Tracked the broader move lower across the curve |
| US Dollar Index (DXY) | 99.88 | -0.02 (-0.02%) | Essentially flat, no material driver |
COMMODITIES
Metals were quiet across the board — gold, silver, copper, and platinum all moved less than 0.2%, showing no safe-haven-versus-industrial-demand split today. Bitcoin’s 0.96% gain tracked the broader equity risk-on tone rather than decoupling into its own narrative, consistent with a session driven by growth-asset sentiment rather than crypto-specific catalysts.
| Asset | Price | Change | %Move | Why It Moved |
|---|---|---|---|---|
| Gold | $4,133.92/oz | -$0.28 | -0.01% | Quiet session, no clear catalyst |
| Silver | $59.765/oz | +$0.005 | +0.01% | Flat, tracking gold |
| Copper | $6.6330/lb | +$0.0015 | +0.02% | Flat, no material driver |
| Platinum | $1,749.25/oz | +$2.10 | +0.12% | Flat, no material driver |
| Bitcoin | $64,224.0 | +$608.0 | +0.96% | Tracked the broader equity risk-on tone |
ENERGY
Brent tumbled 6.08% on easing Middle East supply fears while WTI eased from Monday’s close alongside it — both benchmarks moved together, pointing to a global rather than regional easing. Natural gas sat out entirely (Henry Hub -0.11%), while Dutch TTF fell 3.96% in step with Brent, confirming the move is crude-specific de-escalation, not a broad energy-inflation trade. Falling oil alongside rallying equities is unambiguously a demand-friendly, non-stagflationary signal.
| Asset | Price | Change | %Move | Why It Moved |
|---|---|---|---|---|
| Crude Oil (WTI) | $75.31/bbl | +$0.12 | +0.16% | Eased alongside Brent on Middle East de-escalation optimism |
| Crude Oil (Brent) | $78.68/bbl | -$5.09 | -6.08% | Tumbled on easing Strait of Hormuz supply-disruption fears |
| Natural Gas (Henry Hub) | $2.688/MMBtu | -$0.003 | -0.11% | Muted, decoupled from crude’s move |
| Natural Gas (Dutch TTF) | $18.66/MMBtu | -$0.77 | -3.96% | Fell in step with Brent on global supply-fear easing |
S&P 500 SECTORS
Technology extended its dominance across every horizon — today’s leader (+4.25%) is also the week’s (+8.47%) and quarter’s (+12.11%) leader, a clean momentum trend. Energy inverted that pattern: today’s laggard (-0.77%) remains the year’s best performer (+30.38% YTD, +36.38% 12-month), a one-day pullback on falling crude rather than a trend break.
| Sector | 1-Day | 1-Week | 1-Month | 3-Month | 6-Month | YTD | 12-Month |
|---|---|---|---|---|---|---|---|
| Technology | +4.25% | +8.47% | +2.44% | +12.11% | +23.55% | +23.47% | +36.22% |
| Basic Materials | +2.72% | +2.86% | +0.74% | -1.04% | -0.86% | +11.35% | +37.21% |
| Industrials | +2.71% | +3.08% | -3.12% | +3.25% | +6.81% | +16.27% | +21.56% |
| Communication Services | +0.57% | +6.06% | +1.01% | -3.02% | -0.56% | +3.52% | +22.22% |
| Financial | +0.48% | +0.85% | +2.57% | +12.80% | +7.70% | +8.67% | +19.39% |
| Consumer Defensive | +0.37% | -2.06% | +1.07% | -0.22% | -0.72% | +8.27% | +7.58% |
| Healthcare | +0.03% | -2.96% | -1.57% | +9.88% | +3.05% | +4.62% | +24.17% |
| Consumer Cyclical | 0.00% | +7.08% | +2.14% | +0.59% | -2.91% | -1.12% | +9.21% |
| Real Estate | -0.17% | -2.05% | +1.32% | +3.59% | +9.46% | +11.33% | +10.20% |
| Utilities | -0.37% | -2.43% | -2.68% | -6.23% | +1.50% | +3.28% | +6.11% |
| Energy | -0.77% | +1.78% | +10.10% | -3.10% | +17.40% | +30.38% | +36.38% |
TOP MEGA-CAP MOVERS:
GAINERS
| Company | Ticker | Close | Change | Why It Moved |
|---|---|---|---|---|
| Palantir Technologies | PLTR | $162.66 | +29.45% | Q2 earnings beat — US commercial revenue +149% YoY, FY26 guidance raised to $8.15-8.16B |
| Sandisk Corp | SNDK | $1,427.62 | +10.84% | Rallied with the broader memory/semiconductor AI-capex theme |
| Intel Corp | INTC | $100.86 | +10.84% | Semiconductor sector strength on AI capex optimism |
| Space Exploration Technologies | SPCX | $125.33 | +9.43% | Momentum ahead of today’s after-the-close earnings report |
| Dell Technologies | DELL | $467.27 | +8.92% | AI server/hardware demand optimism |
DECLINERS
| Company | Ticker | Close | Change | Why It Moved |
|---|---|---|---|---|
| Amazon.com Inc | AMZN | $277.42 | -2.32% | Jeff Bezos disclosed a Form 144 filing to sell ~15M shares (~$4.07B) |
| UnitedHealth Group | UNH | $407.55 | -1.88% | Continued managed-care/reimbursement sector pressure |
| Thermo Fisher Scientific | TMO | $564.75 | -1.62% | Diagnostics segment guidance concerns |
— Institutional-grade intelligence for serious investors. Apply for membership at join.recessionalert.comC. HIGH-IMPACT STORIES -> TOP
UNCERTAIN
1. Bessent Says a Hormuz Deal Could Land “Today or Tomorrow” — but June’s Signed Agreement Already Collapsed on the Exact Question Still Unresolved
The core facts:Treasury Secretary Scott Bessent told CNBC on Tuesday that the United States and Iran could reach a deal “today or tomorrow” to reopen the Strait of Hormuz, describing the intended outcome as “freedom of movement” with no Iranian toll levied on transiting vessels. US and regional officials said they were “zeroing in” on an agreement, and Secretary of State Marco Rubio also characterised a deal as imminent; Qatar separately signalled progress on a short-term arrangement. The proposed mechanics have ships entering the Persian Gulf through Iranian waters and exiting via Oman. Tehran again denied that any direct US-Iran channel exists while confirming that Oman-mediated discussions on increasing transits are progressing. The strait has been blocked since February 28, 2026. Critically, this is the second attempt at the same outcome: the two sides signed a memorandum of understanding on June 17 that briefly restored traffic before collapsing over which route vessels could use, and a Reuters report indicates Iran still expects to control inbound traffic through its own territorial waters and to retain oversight of the outbound lane.
Why it matters:The June 17 precedent is the single most important fact in this story and it is the one the tape is not pricing. A signed memorandum between these same two parties, covering this same waterway, already failed — and it failed on precisely the routing question that remains open today. Bessent’s “freedom of movement” formulation and Iran’s expectation of maintaining oversight over both traffic lanes are not two descriptions of one arrangement; they are two incompatible positions, and the gap between them is the same gap that broke the last deal after traffic had already resumed. Yesterday this report noted that the market had priced a de-escalation neither principal had confirmed. Today the US side has escalated its confidence to a specific timeframe while Tehran has again denied the direct channel, which widens rather than narrows the discrepancy. The asymmetry for a US portfolio is now more pronounced than it was on Monday. Brent has given back more than 11% across two sessions and closed at $78.68, meaning essentially the entire war premium has been removed from the price on the strength of statements from one party. If a deal is signed and holds, the incremental gain from here is modest because the market has already paid for it. If the routing dispute reasserts itself as it did in June, the repricing is violent and starts from a level with no cushion in it. The constructive case is real: Bessent is a principal rather than a commentator, Rubio’s alignment suggests an interagency position rather than a trial balloon, and Qatari and Omani mediation has a working track record in Gulf maritime disputes. But six months of blockade have still not ended, and the market is now positioned as though they have.
What to watch:Whether any published agreement specifies whose territorial waters inbound vessels transit — that clause, not the announcement itself, is what determines whether this repeats June. Watch actual tanker transit counts through the strait rather than diplomatic statements, since traffic briefly resumed under the last deal too.
BULLISH
2. Brent Breaks $80 and Falls 6.08% as the War Premium Drains — Then the API Reports a Second Consecutive Crude Build
The core facts:Brent crude settled at $78.68 a barrel, down $5.09 or 6.08%, breaking decisively through the $80 handle on the Hormuz reporting and extending Monday’s 5% slide. WTI closed at $75.31. Dutch TTF fell 3.96% to $18.66 per MMBtu while Henry Hub was effectively unchanged at $2.688, down 0.11% — confirming this as a crude-and-European-gas risk unwind rather than a broad energy repricing. After the close, the American Petroleum Institute reported that US crude stocks rose 2.690 million barrels against a consensus 2.0 million-barrel draw, following a prior build of 3.296 million — a second consecutive build and a miss of roughly 4.7 million barrels against expectations. Energy was the worst-performing S&P sector at -0.77% and the only sector down more than 0.4%, while remaining the year’s best performer at +30.38% year-to-date. Brent rose more than 30% in July and topped $100 for the first time since May.
Why it matters:Monday’s move was a one-legged geopolitical unwind that this report flagged as dependent on unverified diplomacy. Today it acquired a second leg that owes nothing to Tehran. A 2.690 million-barrel build against a 2.0 million-barrel expected draw is a 4.7 million-barrel swing in the wrong direction for bulls, it is the second consecutive build, and it is a physical-inventory fact rather than a statement of intent. That matters because it means the disinflationary impulse now has a fundamentals anchor: even if the Hormuz talks fail tomorrow, US crude inventories are rising and the demand signal is soft. The bond market read it exactly this way, with the 10-year yield falling 6.8 basis points to 4.616% and the 2-year 6.2 basis points to 4.194% — a larger decline than Monday’s, on a day when equities set records and the dollar was steady. Bonds and stocks rallying together across two consecutive sessions is the signature of a genuine easing in the inflation constraint rather than a rotation. Two cautions belong alongside this. First, the API series is a private estimate and the EIA print on Wednesday is the number that settles it; the two have diverged before. Second, the sector arithmetic still cuts against the index — Energy is the largest year-to-date contributor in the S&P at +30.38% and it fell again, so the benefit of cheaper crude accrues to the other ten sectors at the direct expense of the one that has carried the market since January. The offsetting observation is that Energy’s decline was only 0.77% against Brent’s 6.08%, which is a far smaller beta than Monday’s and suggests equity holders are treating the move as a normalisation rather than a demand collapse.
What to watch:Wednesday’s EIA inventory report — a confirmation of the API build would establish a two-week inventory trend independent of the Hormuz outcome, while a draw would strip the fundamentals leg out of the story. Watch whether Brent holds below $80, the level it broke through today.
BULLISH
3. The Dow Cracks 54,000 for the First Time and the S&P Takes Out Its Record — but the Breadth That Made Monday Convincing Is Already Thinning
The core facts:The Dow rose 907.47 points, or 1.71%, to 54,085.88, its first close above 54,000. The S&P 500 gained 135.99 points, or 1.79%, to a record 7,736.49, surpassing the prior June record of 7,620.90. The Nasdaq 100 advanced 3.32% to 29,733.16, the Russell 2000 1.83% to 3,036.33 and the NYSE Composite 0.85% to 24,462.87. Eight of eleven S&P sectors finished green, but the distribution was extremely narrow: Technology led at +4.25%, Basic Materials rose 2.72% and Industrials 2.71%, while the remaining five advancing sectors managed between 0.03% and 0.57%. Communication Services rose just 0.57%, Financials 0.48%, Consumer Defensive 0.37%, Healthcare 0.03% and Consumer Cyclical was flat at 0.00%. The three decliners were Energy (-0.77%), Utilities (-0.37%) and Real Estate (-0.17%). Both Treasury yields fell, the 10-year 6.8 basis points to 4.616% and the 2-year 6.2 basis points to 4.194%.
Why it matters:Yesterday this report asked one specific question: whether the S&P 500 would take out its own record and confirm the Dow, having closed roughly 0.1% short of it. The answer arrived emphatically, and the Dow’s first-ever close above 54,000 alongside a Russell 2000 that outperformed the S&P is a configuration that ordinarily forecloses any argument about narrowness. The internals complicate that reading. Eight sectors advanced, but three of them delivered essentially all of the index’s work while five contributed almost nothing and one did not move at all. The NYSE Composite — the broadest gauge available and the one that ignores cap weighting — rose only 0.85%, less than half the S&P’s 1.79%, versus Monday when the same relationship was 0.61% against 1.48%. The gap between the cap-weighted index and the broad tape widened rather than narrowed on the day the record was set. That is the opposite of what Monday’s session did, and it means the breadth improvement this report credited yesterday lasted one session. The honest synthesis is that today was a genuine, high-quality advance built on a real macro input — cheaper crude and lower yields — with leadership that has narrowed back toward technology and its industrial supply chain. Small-cap outperformance and a falling curve are real evidence against the fragility case, and a record set with bonds rallying is a far better record than one set with yields backing up. But an index that needs Technology to add 4.25% while five sectors sit out is once again dependent on a single theme, and the day’s most consequential earnings reaction — AMD falling hard after the close on a beat — lands directly on that theme tomorrow morning.
What to watch:The spread between the NYSE Composite and the S&P 500 — a second consecutive session of the broad gauge trailing by roughly a full percentage point would confirm that leadership has re-concentrated. Watch whether Consumer Cyclical and Communication Services participate in any follow-through, since neither did today.
BULLISH
4. The Semiconductor Complex Reverses Hard — Intel and SanDisk Both Gain 10.84% and Technology Adds 4.25% After Two Sessions of Being Left Behind
The core facts:Technology was the day’s best sector at +4.25%, driving a 3.32% gain in the Nasdaq 100 to 29,733.16. Intel rose 10.84% to $100.86, closing above $100, and SanDisk rose 10.84% to $1,427.62 — the two largest mega-cap gainers of the session after Palantir. Dell added 8.92% to $467.27, and Micron, AMD and Lam Research also advanced sharply. Technology now shows a one-week gain of 8.47%, a three-month gain of 12.11% and a twelve-month gain of 36.22%. The move reverses a pattern this report documented across the two prior sessions, in which the Philadelphia Semiconductor Index fell 1.9% while the Nasdaq 100 rose 1.78%, and Micron fell 5.90% on a day its Korean memory peers went limit-up. After the close, AMD reported a beat on revenue, earnings and margin with Q3 guidance above consensus, and fell roughly 8% in extended trading.
Why it matters:For two sessions this report tracked a divergence in which the market paid for the buyers of AI capacity and sold the sellers of it, and treated that reordering as a possible structural shift in how the AI trade is expressed. Today the merchant suppliers took the lead back and did so violently — Intel and SanDisk each adding nearly 11%, on no company-specific catalyst identified in the tape, on the same session that a hyperscaler proxy was the index’s worst mega-cap performer. The most coherent explanation is the one this report flagged as the counter-argument on Monday: memory cost inflation is a rising-price problem rather than a falling-demand one, and rising input prices eventually accrue to suppliers’ revenue. Amazon’s disclosure that its capex increase was driven specifically by higher memory costs is the buyer-side confirmation of exactly that, and the market appears to have finally traded the implication rather than the headline. What makes this genuinely two-sided is the sequencing of what happened next. The complex rallied double digits into an AMD print that then beat on revenue, earnings and margin, guided Q3 above consensus, and still sold off roughly 8% after the close on a capital-expenditure line that came in near triple what analysts had modelled and cut free cash flow by roughly 40% sequentially. That is the same memory-and-capacity cost inflation arriving on the supplier’s own income statement, and it is the mechanism by which today’s bullish thesis becomes tomorrow’s margin problem. The rally is real and the input-cost logic behind it is sound; the first hard test of whether the suppliers actually capture the pricing arrived four hours later and did not go well.
What to watch:Whether AMD’s after-hours decline transmits to the broader complex on Wednesday, particularly to Intel and Micron, which rallied today without reporting. Watch SanDisk and Western Digital, both reporting Wednesday after the close, for whether NAND pricing is translating into margin or being absorbed by capacity spending.
BEARISH
5. Philadelphia Fed’s Paulson Keeps a Hike on the Table and Puts Underlying Inflation at 2.4%-2.8% — the Hold Vote “Was Not a Close Call”
The core facts:In a speech and companion essay both titled “Keeping an Open Mind,” Philadelphia Fed President Paulson said recent improvement in some inflation data is “welcome” and “a step in the right direction, but it is only one step,” and that she is keeping an open mind about where policy goes from here. She estimated underlying inflation currently running at 2.4% to 2.8%, characterised her vote with the majority at last week’s 9-3 hold as one that “was not a close call,” and signalled that a rate hike remains a viable possibility if inflation progress stalls. She laid out two plausible scenarios for how current policy is acting on inflation and said incoming data will determine which path holds. The July FOMC left the target range at 3.50%-3.75% for a fifth consecutive meeting on that 9-3 vote, with all three dissents seeking a hike. Prediction markets remain split between one further cut by year-end and a hike during 2026.
Why it matters:This is the third consecutive session in which a Federal Reserve official has publicly kept a hike in the distribution — Barkin on Friday arguing for reversing part of 2025’s cuts, Williams on Monday saying the Fed will raise if inflation does not ease, and Paulson today declining to rule it out. Three officials across three sessions is no longer a dissenting minority making noise; it is the committee’s centre of gravity being relocated in public, and the front end has no cut priced with any conviction as a result. The detail that deserves the most attention, however, is the one that cuts the other way. Paulson’s estimate of underlying inflation at 2.4% to 2.8% sits far below the 3.7% June headline PCE figure Williams cited on Monday, and it is within striking distance of target. An official who believes the underlying trend is 2.4% is describing an inflation problem that is substantially a composition and passthrough problem rather than a demand problem — which is precisely the reading that today’s 6.08% collapse in Brent supports. The uncomfortable synthesis for equity holders is that the hawkish framing and the dovish number point at the same conclusion from opposite directions: policy stays where it is. There is no cut in this speech, and the “not a close call” characterisation of a 9-3 vote forecloses the argument that the committee was nearly persuaded. Markets are currently discounting all of this because crude is falling and the curve is rallying on the inflation input rather than the policy input. That works while oil falls. It stops working the moment oil stabilises, at which point a funds rate at 3.50%-3.75% with no cut priced becomes the operative constraint on a market trading at record multiples.
What to watch:Whether other FOMC members adopt Paulson’s 2.4%-2.8% underlying-inflation framing in their own remarks — that would signal a committee consensus that the headline overstates the problem and is the most plausible route back to a cut. Watch the 2-year yield at 4.194% for any move back above 4.25%, which would mark the front end pricing the hike risk rather than the oil relief.
— Quantifying recession risk so you don’t have to guess. Apply for membership at join.recessionalert.comD. MODERATE-IMPACT STORIES -> TOP
UNCERTAIN
6. The VIX Rises 4% on a Record-Setting Session — Hedging Demand Survives Both New Highs and a Bond Rally
The core facts:The VIX rose 0.64 points, or 4.04%, to 16.50 on a session in which the S&P 500 gained 1.79% to a record close, the Dow crossed 54,000 for the first time and the Nasdaq 100 advanced 3.32%. Volatility rose simultaneously with a decline in both Treasury yields, the 10-year falling 6.8 basis points to 4.616% and the 2-year 6.2 basis points to 4.194%. On Monday, by contrast, the VIX fell 0.81% to 15.86 on a session with a smaller equity gain.
Why it matters:Implied volatility almost always falls on a 1.79% up day, because a rally consumes the demand for downside protection that the index price embeds. Today it rose, and it rose alongside a bid for duration. That combination means two of the three markets that price risk — options and Treasuries — moved defensively while equities set records, and the natural reading is that the equity advance was accompanied by, rather than a substitute for, buying insurance. Two candidate explanations are consistent with everything else on the tape. The first is the Hormuz tail: the entire crude decline rests on an agreement that has not been signed and whose predecessor collapsed after traffic had already resumed, so the cheapest way to hold a record-level equity position is to hedge the event that produced it. The second is idiosyncratic and expires quickly — Tuesday’s after-the-close slate carried SpaceX’s first-ever public earnings report and AMD’s, both of which the options market had priced for outsized moves, and both of which delivered them. The distinction matters for how long the signal persists. Event-driven volatility demand around a heavy earnings evening unwinds by Wednesday’s open. Geopolitical tail hedging does not unwind until the underlying question resolves, and if the VIX stays elevated once the earnings reactions have cleared, the market is telling you it does not fully believe the story it just rallied on. What is not in dispute is that a 16.50 VIX remains historically unremarkable in absolute terms; this is a directional signal about positioning, not a distress reading.
What to watch:Whether the VIX falls back below 16 on Wednesday once the SpaceX and AMD reactions have been absorbed — a failure to do so would isolate the Hormuz tail as the source of the bid. Watch for the VIX rising again on any further equity record, which would confirm a persistent hedging pattern rather than a one-session anomaly.
BULLISH
7. The Transports Surge 2.58% and Finally Outrun the Dow — a Three-Session Dow Theory Non-Confirmation Resolves on the Day the Dow Crosses 54,000
The core facts:The Dow Jones Transportation Average rose 548.7 points, or 2.58%, to 21,779.9, outpacing the Dow Industrials’ 1.71%, the S&P 500’s 1.79% and the Russell 2000’s 1.83%. Brent crude fell 6.08% on the session, a second consecutive decline. This report has flagged a Dow Theory non-confirmation across three prior sessions, most recently yesterday, when the Transportation Average rose only 0.91% against the Industrials’ 1.32% despite a 5.52% decline in WTI, and remained more than 6% below its ten-session high while the Industrials set a record.
Why it matters:Yesterday this report set up a natural experiment and reported that it had failed: the transport complex received an unambiguous, quantified windfall in its dominant variable cost and still underperformed every major average, which pointed at a demand-side constraint rather than a cost story. Today the experiment ran a second time and the result inverted. On a second consecutive crude decline the transports outperformed everything, adding 548.7 points and closing most of the gap to the ten-session high in a single session. The correct interpretation is that one session of cheaper fuel was not sufficient to change the earnings outlook — hedging programmes blunt the first move, and a single day’s price can reverse — but two consecutive declines, with a diplomatic path to a structurally lower oil price behind them, changed what the market believes the forward fuel curve looks like. That distinction is the whole story: transports do not trade the spot price, they trade the expected average price over the hedging horizon, and it took a second data point to move that expectation. The Dow Theory implication is favourable and it arrived on the most useful possible day. The Industrials set a record above 54,000 and the average whose job is to confirm that the physical economy is moving goods confirmed it by a wide margin. The caveat that keeps this moderate rather than high impact is that the confirmation is only as durable as the crude move underneath it, and that move is currently underwritten by an unsigned agreement.
What to watch:Whether the Transportation Average closes above its ten-session high, which would complete the resolution rather than merely narrow the gap. Watch whether the transports hold their gains on any session where crude stabilises or rebounds, which would separate a genuine demand signal from a pure fuel-cost trade.
UNCERTAIN
8. A Downgrade-Heavy Analyst Tape on a Record Day — Apple Takes a Double Cut While Palantir Draws Two Upgrades
The core facts:An unusually broad set of ratings changes landed, skewed toward downgrades. Apple was double-cut, by China Renaissance from Buy to Hold and by DZ Bank from Buy to Hold. JPMorgan cut Nike to Underweight from Neutral with a price target of $40 from $47, and the shares fell roughly 2%. DZ Bank cut Exxon Mobil from Buy to Hold; Oppenheimer cut Walmart to Perform from Outperform; Truist cut Intuit from Buy to Hold; Jefferies cut Cigna from Buy to Hold; BofA cut Duolingo to Underperform from Neutral; and Wolfe Research cut Rivian to Underperform with a $16 target on weakening fundamentals. Upgrades clustered in software and platforms: Palantir was raised to Buy at both Citi, with a target of $235 from $210, and Deutsche Bank; BofA raised Comcast to Buy with a target of $37 from $31; B. Riley raised Airbnb to Buy with a target of $170 from $140; Morgan Stanley raised Datadog to Overweight with a $180 target; and Citi raised Zoom to Buy with a target of $106 from $94.
Why it matters:Yesterday’s reshuffle was six upgrades concentrated in industrials, materials and electrical equipment, and this report read it as the sell side ratifying the day’s rotation. Today’s set inverts the ratio and, more usefully, splits cleanly along the same fault line the index itself displayed. Every downgrade of consequence lands on a name in the part of the market that did not participate — Apple, Nike and Walmart are consumer and mega-cap index anchors on a day Consumer Cyclical closed flat at 0.00% and Consumer Defensive managed 0.37%. Every upgrade lands in software and platforms, which is exactly where Technology’s 4.25% came from. The sell side is not fading the record; it is withdrawing from the two-thirds of the index that is being left behind, which is the same message the NYSE Composite’s 0.85% delivered from a different direction. Apple’s double-downgrade is the item that should not be passed over. Two independent houses exited the largest weight in the index on the session the Nasdaq 100 gained 3.32%, and neither cut was tied to an earnings event. That is a fundamental call rather than a reaction, and it sits awkwardly against an index at a record. The standard limitation applies with full force: ratings changes are lagging indicators presented as forward calls, and the Palantir upgrades in particular arrived after a 29.45% single-session move, which tells you where the stock is rather than where it is going. The DZ Bank downgrade of Exxon on the day Brent fell 6.08% is the most straightforwardly logical action in the set.
What to watch:Whether Apple underperforms the Nasdaq 100 again on Wednesday, which would suggest the double-downgrade reflects a broader institutional view rather than two isolated calls. Watch for further energy-sector downgrades following the Exxon cut, which would mark the sell side capitulating on the year’s best-performing sector.
UNCERTAIN
9. A Third Multi-State Tariff Suit Lands as Canada’s Negotiators Return to Washington With Two Weeks to the August 19 Deadline
The core facts:A third multi-state legal challenge to the Section 301 forced-labor tariffs was filed against the US Trade Representative, using USTR officials’ own public statements as evidence that the programme’s purpose was maintaining tariff revenue rather than remediating forced labor. It targets the 10% and 12.5% duties proposed on 60 trading partners following a single blanket three-month investigation covering more than 99% of US imports; Section 232 goods — steel, aluminium, copper, autos, auto parts and timber — are carved out entirely. The filing adds to the 25-state suit lodged August 3 in the Court of International Trade, which holds exclusive first-instance jurisdiction, and to private-plaintiff actions from Burlap and Barrel and Collective Horology seeking removal and refunds. Separately, Canada’s Trade Minister Dominic LeBlanc and chief trade negotiator Janice Charette travelled to Washington on Monday for meetings Tuesday and Wednesday — LeBlanc’s second trip in as many weeks — as an additional 50% duty on Canadian goods approaches under three Section 338 proclamations signed July 20 and effective August 19, with no exemption for USMCA-originating goods. Energy, potash, Section 232 goods, fish and critical minerals are carved out.
Why it matters:Three separate multi-state actions inside roughly forty-eight hours, in the one court with exclusive jurisdiction, is a materially different posture from a trade-association complaint, and the third filing adds an evidentiary theory the first two did not carry. Arguing from USTR’s own public statements that the forced-labor rationale was pretextual attacks the statutory authority rather than the rate, and it is the kind of claim that survives a motion to dismiss or ends the programme — there is little middle ground. What makes the coverage figure matter is its scale: a blanket three-month investigation spanning more than 99% of US imports is an unusual administrative record to defend, and importers have already embedded these duties in cost structures and pricing. The exposure runs in both directions, which is why this reads as uncertain rather than negative. Companies that absorbed the duties face refund upside if the challenges succeed and continued margin drag if they fail; companies that passed them through face the mirror image, and neither outcome sits in consensus estimates because the litigation timeline is unknown. The Canadian track is the part with a hard date and it is now inside three weeks. LeBlanc making a second Washington trip in two weeks, accompanied by the chief negotiator, is the clearest available signal that Ottawa believes the August 19 date is real and that the removal of the USMCA certificate-of-origin exemption is a change in regime rather than a rate adjustment. The market has largely stopped pricing tariff headlines; a fixed date and three live jurisdictional challenges are the conditions under which that habit becomes expensive.
What to watch:Whether the Court of International Trade grants a preliminary injunction in any of the three actions, which would suspend collection and force immediate re-estimation across import-heavy sectors. Watch August 19 as the hard date for the Canadian duties and for any USMCA carve-out emerging from this week’s Washington meetings.
UNCERTAIN
10. Job Openings and Factory Orders Both Miss and the Index Sets a Record Anyway — a Second Consecutive Session of US Macro Being Ignored
The core facts:June JOLTS job openings and June factory orders both came in below consensus this morning; Section E carries the readings and their composition in full. The market-relevant layer is that neither registered in any asset price. The S&P 500 closed at a record 7,736.49, up 1.79%, the Nasdaq 100 gained 3.32%, and the two Treasury yields most sensitive to labour demand fell 6.8 and 6.2 basis points — a decline the tape attributed to the 6.08% collapse in Brent rather than to softening job openings. This follows Monday, when an ISM manufacturing print at multi-year highs and an Atlanta Fed GDPNow nowcast of 6.2% for Q3 also failed to move yields, in that case in the opposite direction.
Why it matters:Across two consecutive sessions the US economy has produced growth data of opposite sign — a manufacturing survey at multi-year highs with a 6.2% growth nowcast on Monday, softening labour demand and weak factory orders on Tuesday — and the curve has responded to neither. Both times the oil price supplied the entire move. That is the single most important structural fact about the current tape: the market has effectively stopped trading US macro and is trading one Middle East variable, and every domestic data point is being filed away unpriced. The risk this creates is not directional but cumulative. When the Hormuz question resolves in either direction, the accumulated backlog reprices at once, and the two sides of that ledger currently point opposite ways — Monday’s nowcast argues for higher yields, today’s labour and orders data for lower. Whichever way it breaks, the move will be larger than the individual data would have produced had each been priced on the day. The combination that deserves specific attention is today’s softening labour demand sitting alongside Paulson’s refusal to rule out a hike. Weakening job openings with a central bank that has removed cuts from its distribution and a funds rate held at 3.50%-3.75% for five consecutive meetings is the stagflationary corner of the outcome space, and it is the one configuration that neither the equity record nor the bond rally is currently discounting. The honest counterweight is that a single month of JOLTS is a noisy and heavily revised series, and one soft factory orders print against a manufacturing survey at multi-year highs is a contradiction the data itself has not yet resolved.
What to watch:Whether the next labour-market release moves Treasury yields on a session when crude is stable — that is the only clean test of whether the market has genuinely stopped pricing US macro or has simply been overwhelmed by a larger input. Watch whether Fed speakers begin citing labour softening, which would reopen the cut debate that Paulson’s remarks closed today.
BEARISH
11. Bezos Files to Sell $4.07 Billion of Amazon and the $3 Trillion Milestone Lasts Exactly One Session
The core facts:Amazon fell 2.32% to $277.42, the largest mega-cap decliner of a record-setting session, after a Form 144 filing disclosed Jeff Bezos’s intent to sell 15 million common shares with an aggregate market value of roughly $4.07 billion based on Monday’s close. The sale is being executed through Morgan Stanley under a Rule 10b5-1 trading plan adopted on November 14, 2025, and the shares were acquired as founder stock in 1994. The filing landed the session immediately after Amazon crossed a $3 trillion market capitalisation for the first time and set an all-time high following its earnings report, a threshold the stock gave back today. The decline came on a day the Nasdaq 100 rose 3.32% and Technology gained 4.25%.
Why it matters:The 10b5-1 structure is the fact that should defuse this entirely, and it largely does not. A plan adopted in November 2025 encodes no view about Amazon at $284 in August 2026 — removing discretion from the timing is the whole purpose of the instrument, and Bezos has sold regularly through such plans for years while remaining among the company’s largest holders. Yet Amazon was the worst mega-cap performer on a session when its own sector added 4.25%, and it surrendered the $3 trillion threshold it had held for a single day. What the market is pricing is not a signal about the business; it is supply. A concentrated block of this size, disclosed the morning after an all-time high, is a mechanical overhang, and the tape treated it accordingly. The pattern worth noting is broader than the filing. This is now the third occasion in four sessions on which Amazon’s price has been set by something other than Amazon’s operating performance: last week’s capital-expenditure raise was driven by memory cost inflation rather than incremental compute, Monday’s advance came from sell-side target increases citing an estimated custom-silicon run rate rather than a disclosed one, and today’s decline is a calendar-driven sale adopted nine months ago. For a position that now represents roughly one dollar in every twenty of the index’s largest constituents, that is an uncomfortable amount of price formation happening outside the fundamentals. The counterweight is that mechanical supply is exactly the kind of pressure that clears once the block is placed, and nothing disclosed today alters the earnings trajectory that produced the $3 trillion valuation in the first place.
What to watch:Whether Amazon reclaims the $3 trillion threshold within the week — a failure to do so once the block clears would suggest the earnings-driven re-rating was thinner than it appeared. Watch for additional Form 144 filings, which would indicate the November 2025 plan has further tranches scheduled.
— Separating signal from noise since 2007. Apply for membership at join.recessionalert.comE. ECONOMY WATCH -> TOP
Labor and manufacturing data both missed today — JOLTS openings fell to 7.359M and factory orders dropped 0.3% (core -0.4%) — yet risk assets shrugged it off with the S&P near record highs on AI capex strength, a soft-data/resilient-markets divergence. The trade deficit narrowed to $73.3B, but on falling imports and exports alike, suggesting cooling global demand rather than genuine strength. Credit stress is building at the margin: EchoStar’s Hughes Satellite unit filed Chapter 11 with $1.5B in debt, its second unit to do so in weeks. Meanwhile 25 states sued to block Section 301 tariffs covering 99.4% of imports, adding fresh policy uncertainty.
JOLTS Job Openings Fall to 7.359 Million in June, Missing Estimates as Labor Market Cools (InvestingLive/BLS, August 4, 2026)
What they’re saying:Job openings fell to 7.359 million in June, down from a revised 7.537 million in May and below the 7.4 million consensus estimate. The decline was concentrated in healthcare (-147K), leisure and hospitality (-86K), wholesale trade (-74K), and business services (-71K), while federal government openings surged to their highest level since October 2024.
The context:The miss reinforces signs the labor market is losing momentum even as hires and quits held firmer, a mixed internal picture that still supports the case for a more accommodative Fed path. Treasury yields eased modestly on the print as traders leaned further into a dovish rate outlook.
What to watch:Friday’s (Aug 7) nonfarm payrolls report, expected to show 80K jobs added and the unemployment rate holding at 4.2%.
US Factory Orders Unexpectedly Fall 0.3% in June, Core Orders Miss Badly (Investing.com/Census Bureau, August 4, 2026)
What they’re saying:Factory orders fell 0.3% in June to $656.5 billion, missing the +0.2% consensus and extending May’s revised 1.1% decline. Core orders (ex-transportation) dropped 0.4%, dramatically missing expectations for a 0.4% gain.
The context:The soft print contrasts with July’s ISM Manufacturing PMI hitting its highest level since May 2022, underscoring a bifurcated industrial picture. Equities largely shrugged off the miss, with the S&P 500 trading near record highs on continued AI infrastructure capex.
What to watch:Wednesday’s (Aug 5) ISM Services PMI for confirmation of whether the June softness is isolated to manufacturing or broadening.
US Trade Deficit Narrows to $73.3 Billion in June as Imports and Exports Both Decline (Bloomberg/Census Bureau, August 4, 2026)
What they’re saying:The trade deficit narrowed 5.6% to $73.3 billion in June, roughly in line with the $73B consensus and down from $77.6B in May. Exports fell 0.9% to $314.7B and imports fell 1.8% to $388.0B, with the goods deficit narrowing $3.9B to $102.1B.
The context:The improvement was driven by falling trade volumes on both sides rather than export strength — crude oil exports alone fell $5.7B as prices dropped to $95.82/barrel — pointing to softer global demand rather than a genuine competitiveness gain.
What to watch:July trade data and any tariff-driven shifts in import volumes given the pending Section 301 litigation.
EchoStar’s Hughes Satellite Systems Files Chapter 11 With $1.5 Billion in Debt (Law360/GlobeNewswire, August 3, 2026)
What they’re saying:Hughes Satellite Systems Corporation and certain U.S. subsidiaries filed voluntary Chapter 11 petitions on August 2 in the Southern District of Texas, facing a $1.5 billion note maturity against just $102 million in cash. The filing arrived without a pre-negotiated restructuring plan.
The context:This marks the second Chapter 11 filing from the EchoStar family in weeks, following DISH DBS Corporation’s prepackaged bankruptcy on June 30 — a sign of continued balance-sheet stress across the group as satellite broadband faces intensifying competition from Starlink. EchoStar’s non-Hughes operations, including DISH TV, Sling TV, and Boost Mobile, are unaffected.
What to watch:Progress of the restructuring and whether further EchoStar-affiliated entities face similar liquidity pressure.
25 States Sue to Block Section 301 Tariffs Covering 99.4% of US Imports (CBS News/Boston Globe, August 3, 2026)
What they’re saying:A coalition of 25 states, led by New York, filed suit in the US Court of International Trade against new 10-12.5% tariffs imposed July 23 under Section 301, covering goods from 59 countries and the EU that together account for 99.4% of US imports. The states argue the “forced labor” justification is a pretext to revive tariffs the Supreme Court already struck down.
The context:The suit seeks to have the tariffs declared unlawful, halted, and refunded — an outcome that would remove a meaningful cost overhang for importers if successful, but leaves near-term policy direction unresolved and follows a pattern of legal challenges dogging the administration’s trade agenda.
What to watch:Court of International Trade scheduling and any interim injunction request; a ruling could materially reprice import-cost assumptions across consumer and industrial sectors.
— Know the probability before the market prices in the risk. Apply for membership at join.recessionalert.comF. EARNINGS WATCH -> TOP
YESTERDAY AFTER THE BELL (Markets Reacted Today)
BULLISH
12. Palantir Technologies (PLTR): +29.45% | US Commercial Revenue Up 149% Drives the Single Largest Mega-Cap Move of the Session
The Numbers:Released: AMC, Monday August 3. Total revenue of $1.935 billion against roughly $1.8 billion consensus, up 93% year-over-year and 19% sequentially. US commercial revenue of $764 million, up 149% year-over-year and 28% sequentially; US government revenue of $809 million, up 90%; international government $181 million, up 42%; international commercial $182 million, up 26%. Adjusted gross margin 86%, adjusted operating income $1.194 billion for a 62% adjusted operating margin, GAAP net income $1.062 billion for a 55% margin. FY26 revenue guidance raised to $8.15-$8.158 billion from $7.65-$7.66 billion, US commercial guidance raised to above $3.424 billion representing at least 134% growth, adjusted operating income guidance raised to $4.889-$4.897 billion and adjusted free cash flow to $4.5-$4.7 billion. Shares closed at $162.66.
The Problem/Win:The win is the commercial franchise reaching escape velocity. Palantir has spent years being valued as a government contractor with an interesting commercial option; at $764 million growing 149%, total commercial revenue of $945 million is now within $45 million of total government revenue of $990 million. The company is roughly one quarter away from a balanced revenue mix, and it got there by growing the commercial side rather than shrinking the government side, which grew 90% itself. A 62% adjusted operating margin on 93% revenue growth is the combination that justifies the multiple — most software businesses buy that growth rate with margin.
The Ripple:Palantir was the largest single contributor to the Nasdaq 100’s 3.32% advance and the day’s biggest mega-cap gainer by a wide margin. The print drew same-session upgrades to Buy from both Citi, which raised its target to $235 from $210, and Deutsche Bank. It also supplied the enterprise-software leg of a session in which Technology led all sectors at +4.25%, reinforcing the pattern this report has tracked of capital moving toward the applied-AI layer rather than only the silicon underneath it.
What It Means:The AI software layer is now demonstrating the monetisation that the infrastructure layer has been funding, and Palantir is the cleanest listed expression of it. The risk is entirely valuation and comparison base — 149% commercial growth cannot be annualised indefinitely, and a 29.45% single-session move prices a great deal of the next several quarters.
What to watch:Whether US commercial revenue holds above 100% year-over-year growth next quarter as the comparison base steepens — that is the single number the raised $3.424 billion full-year guidance depends on. Watch whether the two upgrades draw further sell-side revisions or mark the top of the ratings cycle.
BULLISH
13. Vertex Pharmaceuticals (VRTX): +1.75% | Revenue Beat and a Guidance Raise Outweigh a Fractional EPS Miss
The Numbers:Released: AMC, Monday August 3. Revenue of $3.33 billion against $3.22 billion consensus, up 12.4% year-over-year and beating by 3.43%. Adjusted EPS of $4.73 against $4.75 expected, a miss of 0.32%. TRIKAFTA/KAFTRIO contributed $2.50 billion and ALYFTREK $573.6 million as global reimbursement expanded to 25 countries. JOURNAVX, the non-opioid pain franchise, generated $50 million against $12 million a year earlier, up 70% sequentially with prescription growth of 45% and more than 535,000 prescriptions in the quarter. CASGEVY revenue rose 151% year-over-year and 78% sequentially to $76 million. Full-year 2026 revenue guidance was raised to $13.10-$13.20 billion from $12.95-$13.10 billion.
The Problem/Win:The win is that the diversification thesis is finally producing measurable revenue rather than milestones. Vertex has been a cystic fibrosis monopoly searching for a second act for a decade; JOURNAVX at $50 million growing 70% sequentially and CASGEVY at $76 million growing 78% sequentially are both small against a $3.33 billion quarter, but both are compounding at rates that make them material within eight quarters. The fractional EPS miss is noise — 0.32% against a $4.75 estimate is a rounding difference, and the guidance raise is the management signal that matters.
The Ripple:Healthcare was effectively flat at +0.03%, the second-weakest advancing sector on a day the S&P gained 1.79%, so Vertex’s 1.75% gain represented meaningful relative outperformance within a sector that did not participate in the rally. The JOURNAVX trajectory is the read-through with the widest reach: a non-opioid analgesic scaling past half a million prescriptions is a direct commercial validation of a category the entire pain-management complex has been unable to crack.
What It Means:Vertex is transitioning from a single-franchise business to a multi-product one on schedule and is raising guidance while doing it. The valuation still embeds the cystic fibrosis annuity, so the incremental franchises are largely unpriced — the risk is execution and reimbursement rather than science.
What to watch:JOURNAVX sequential growth next quarter — sustaining anything close to 70% would put the franchise on a path to $500 million annualised and materially change the sum-of-the-parts. Watch whether the raised $13.10-$13.20 billion range is lifted again at the third quarter, which would signal the new products are running ahead of internal plan.
TODAY BEFORE THE BELL (Markets Already Reacted)
BULLISH
14. Caterpillar (CAT): +5.60% | A Record $20.5 Billion Quarter and a 92% Backlog Surge on Data-Center Power Demand
The Numbers:Released: BMO. Revenue of $20.54 billion against $19.34 billion consensus, a 6.25% beat and up 24% from $16.6 billion a year earlier — the first quarter in company history above $20 billion. Adjusted EPS of $8.17 against $6.22 expected, a 31.42% beat and up from $4.72 a year ago. Backlog of $72.1 billion, up 92% year-over-year with all segments contributing and orders extending into 2030. The Power & Energy segment grew 17% to $8.2 billion, with power generation sales — predominantly data-center related — climbing 29%, and power generation up 72% on data-center demand specifically. Full-year revenue growth guidance was raised to the mid-to-high-teens percentage range from a prior low-double-digit target, and the tariff cost estimate was narrowed to roughly $2.2 billion from $2.2-$2.6 billion. Market cap $403.77 billion.
The Problem/Win:The win is the backlog, not the quarter. A 92% year-over-year increase to $72.1 billion with orders booking into 2030 converts Caterpillar from a late-cycle machinery business into something closer to a contracted infrastructure provider, and it removes the single biggest analytical objection to owning the name at this valuation — that data-center demand is a guided number rather than an order book. It is now an order book. The company is also resuming production of its 10-megawatt gas reciprocating engine platform, which is a capacity decision rather than a forecast.
The Ripple:Caterpillar was the largest point contributor to a Dow that gained 907.47 points and closed above 54,000 for the first time, and it underpinned Industrials’ 2.71% advance as the third-best sector. This report has repeatedly used industrial and electrical order books as the cleanest available confirmation that hyperscaler capital spending is landing in the physical economy rather than remaining a guided figure. Today supplied that confirmation at scale, and it arrived alongside yesterday’s Prysmian-Atkore transaction and the Eaton and Ingersoll-Rand upgrades in the same electrical-infrastructure complex.
What It Means:The AI capital-expenditure cycle now has a contracted, multi-year physical order book behind it, which materially lowers the probability that the capex narrative unwinds abruptly. The offsetting exposure is the $2.2 billion tariff cost, which is a live number given three multi-state legal challenges to the Section 301 duties now pending.
What to watch:Whether backlog growth holds above 50% year-over-year next quarter — deceleration there is the first place a hyperscaler capex slowdown would appear, well ahead of revenue. Watch the tariff cost estimate for revision if the Court of International Trade acts on the Section 301 challenges.
UNCERTAIN
15. Merck & Co (MRK): +0.18% | Revenue Guidance Raised and Profit Guidance Cut in the Same Release
The Numbers:Released: BMO. Revenue of $16.61 billion against $16.37 billion consensus, a 1.45% beat and up 5.1% year-over-year. Adjusted EPS of -$0.13 against -$0.27 expected, a 51.94% beat, while GAAP EPS came in at -$0.54 against -$0.37 expected, a 44.97% miss. KEYTRUDA and KEYTRUDA QLEX sales were $8.4 billion, up 5% and 4% ex-FX, including $463 million from the new subcutaneous formulation. Winrevair generated $588 million, up 75% year-over-year. Full-year 2026 revenue guidance was raised to $66.3-$67.3 billion from $65.8-$67.0 billion, while adjusted EPS guidance was cut to $2.66-$2.76 to absorb a one-time $5.7 billion charge, equal to $2.31 per share, related to the Terns Pharmaceuticals acquisition. Market cap $316.14 billion.
The Problem/Win:The win is the diversification away from Keytruda, which is the entire investment question for Merck. Winrevair at $588 million growing 75% and the subcutaneous Keytruda conversion at $463 million in its early quarters are the two products that determine whether the patent cliff is a step-down or a fall, and both are tracking well enough for management to raise revenue guidance. The problem is the $5.7 billion Terns charge, which is real cash spent on a pipeline asset that will not generate revenue for years and which mechanically converts a revenue beat into a profit guidance cut.
The Ripple:Merck finished up 0.18%, essentially flat, in a Healthcare sector that gained 0.03% and was the second-weakest advancing sector on the day. The Terns charge is the more significant sector signal: it is another large-cap pharma buying pipeline rather than building it, which is the same conclusion the market drew yesterday from the reported AstraZeneca-Bristol Myers merger talks. Two sessions, two confirmations that the sector’s incumbents believe organic growth will not close the patent gap.
What It Means:The underlying business is performing better than the headline EPS suggests, but Merck is paying substantial cash to acquire a future it cannot generate internally. The flat share price is the market declining to take a view until it can assess what $5.7 billion bought.
What to watch:Winrevair’s growth rate next quarter against today’s 75% — that franchise is the largest single non-Keytruda contributor to the raised revenue guidance. Watch management’s business-development commentary for whether Terns is the last acquisition of this size or the first of several.
UNCERTAIN
16. McDonald’s (MCD): +1.17% | US Comps Slip to 0.8% as the Under-$3 Menu Reaches Only Two-Thirds of the System
The Numbers:Released: BMO. Revenue of $7.10 billion against $7.13 billion consensus, a 0.42% miss but up 3.7% year-over-year. Non-GAAP diluted EPS of $3.38 against $3.32 expected, a 1.86% beat and up 6%. US same-store sales rose 0.8%, below expectations; global same-store sales rose 1.3%. Management attributed roughly two-thirds of the US traffic underperformance to value-menu execution: only 60% to 65% of the system has implemented the under-$3 menu, the loose $3 parameter allowed some franchisees to raise prices on items such as small fries, and a pullback on digital offers alienated loyal customers. The June FIFA campaign underdelivered, and too many simultaneous deployments overwhelmed restaurant operations, slowing service times and lowering satisfaction scores. Market cap $190.66 billion.
The Problem/Win:The problem is self-inflicted and management said so directly, insisting the company does not have a strategy problem. That framing is the most useful disclosure in the release: a value menu implemented in two-thirds of restaurants, with a price floor loose enough that some operators raised prices, is not a demand failure — it is a franchise-execution failure, and it is fixable in a way that a consumer pullback is not. The counter-reading is less comfortable. If the low-income consumer were healthy, a partially implemented value menu would not cost two-thirds of US traffic performance, and the reliance on discounting to hold comps at 0.8% is itself the signal.
The Ripple:Consumer Cyclical closed flat at 0.00%, the only sector to register no move on a day the S&P gained 1.79%, and Consumer Defensive managed just 0.37%. McDonald’s is the highest-frequency read on the US low-income consumer available in the large-cap complex, and 0.8% domestic comps landed on the same session that JOLTS job openings missed and JPMorgan cut Nike to Underweight. Three independent consumer signals pointing the same direction on one day is more informative than any of them alone.
What It Means:The share price rose 1.17% because the EPS beat and management framed the shortfall as executional. Investors are being asked to accept that the value proposition is a rollout problem rather than a consumer problem, and the next two quarters will settle which it is.
What to watch:Under-$3 menu system penetration moving from 60-65% toward full implementation — if comps do not improve as coverage rises, the executional explanation fails. Watch US traffic separately from comps, since price alone can hold the comp while traffic declines.
BULLISH
17. Pfizer (PFE): +1.52% | Non-COVID Revenue Up 18% Operationally and the Guidance Midpoint Raised $500 Million
The Numbers:Released: BMO. Revenue of $15.03 billion against $14.40 billion consensus, a 4.41% beat. Adjusted EPS of $0.77 against $0.68 expected, a 12.87% beat, while GAAP EPS came in at -$0.04 against a $0.49 estimate. Revenues from launched and acquired products grew 18% operationally. Full-year 2026 revenue guidance was raised by $500 million at the midpoint to $60.5-$62.5 billion, while adjusted EPS guidance was reaffirmed at $2.80-$3.00. The full-year expectation for COVID products — Comirnaty and Paxlovid — was cut to $4 billion from roughly $5 billion, with Comirnaty revenues declining 34% operationally on a lower favourable returns-provision adjustment and reduced US utilisation. Phase 2b results for the monthly obesity candidate berobenatide, from the $10 billion Metsera acquisition, suggest weight loss comparable to tirzepatide and potentially better than semaglutide. Market cap $144.82 billion.
The Problem/Win:The win is that the post-COVID base business is now growing fast enough to absorb a $1 billion downgrade to the COVID franchise and still support a $500 million guidance raise. Eighteen percent operational growth in launched and acquired products is the number that answers the question Pfizer has faced since 2023 — whether anything replaces the pandemic revenue. The GAAP loss reflects acquisition accounting rather than operations, and the reaffirmed adjusted EPS range confirms management does not view it as recurring.
The Ripple:Pfizer’s 1.52% gain was the strongest of the four large-cap pharma names reporting today, in a Healthcare sector that closed at +0.03%. The berobenatide data is the item with the widest sector reach: a monthly injectable delivering weight loss comparable to tirzepatide would introduce genuine dosing-frequency competition into a market currently split between two weekly incumbents, and it lands the session before Eli Lilly reports.
What It Means:Pfizer has bought its way into the obesity market at a $10 billion price and has early data suggesting it did not overpay. The stock is being valued on the COVID run-off; the guidance raise argues the base business is what should set the multiple.
What to watch:Eli Lilly’s report on Wednesday before the open for any commentary on monthly-dosing competition following the berobenatide data. Watch whether the $4 billion COVID guidance holds or is cut again, since it has now been reduced twice.
TODAY AFTER THE BELL (Markets React Tomorrow)
UNCERTAIN
18. Space Exploration Technologies (SPCX): -7% AH | Starlink Doubles to 12 Million Subscribers, Revenue Beats by Nearly $1 Billion, and the Stock Falls Anyway
The Numbers:Released: AMC — the company’s first earnings report as a listed company. Revenue of $7.81 billion against $6.83 billion consensus, a 14.46% beat and up 92% year-over-year. GAAP EPS of -$0.09 against -$0.23 expected, a 60.09% beat. Starlink reported 12 million subscribers, double a year earlier and up 17% from the first quarter, against 10.3 million across 164 countries as of March 31. The AI segment moved from a loss into positive adjusted EBITDA for the first time, helped by $14.1 billion in new AI contracts. Shares closed the regular session up 9.43% at $125.33 and fell roughly 7% after hours to about $117. Market cap $1,662.77 billion. The IPO lockup expires August 6; the company listed on June 12 at $135 and peaked at $225.64 on June 16.
The Problem/Win:Every operating metric beat and the stock fell 7%, which makes the sequencing the story rather than the numbers. Yesterday this report flagged that the options market was pricing a post-earnings swing of roughly $204 billion and that a disappointing print followed by the August 6 insider unlock would compress two sources of supply into seventy-two hours. The print was not disappointing — revenue beat by nearly a billion dollars, the loss narrowed by 60%, Starlink subscribers doubled and the AI segment turned EBITDA-positive. The stock fell regardless, which isolates the unlock as the operative variable rather than the fundamentals.
The Ripple:SpaceX was one of the five largest mega-cap gainers of the regular session at +9.43%, contributing to the day’s advance before giving it back after the close. The Starlink subscriber disclosure is the read-through with the longest reach — 12 million subscribers doubling year-over-year is the first audited scale figure the market has had for low-earth-orbit broadband, and it arrives while a satellite-broadband incumbent’s subsidiary sits in Chapter 11 after failing to repay $1.5 billion of bonds that matured August 1.
What It Means:The fundamentals are stronger than the debut price implied and the share price is being set by supply mechanics rather than by the business. That resolves in one direction or the other within days rather than quarters.
What to watch:August 6, when the IPO lockup expires — price action into and through that date is the cleanest available test of whether today’s after-hours decline was anticipatory supply or a verdict on the print. Watch whether the $14.1 billion AI contract backlog is broken out by counterparty in subsequent disclosure.
UNCERTAIN
19. Advanced Micro Devices (AMD): -8% AH | A Beat-and-Raise Undone by Capital Expenditure at Nearly Triple the Modelled Figure
The Numbers:Released: AMC. Record revenue of $11.536 billion against $11.31 billion consensus, a 2.00% beat and up 50% year-over-year. Adjusted EPS of $1.66 against $1.62 expected, a 2.71% beat. Data Center revenue of $6.7 billion, up 107% year-over-year and now 58% of company sales, driven by fifth-generation EPYC processors and Instinct MI350 Series GPUs. Q3 revenue guided to $13 billion plus or minus $300 million against $12.52 billion expected. CEO Lisa Su said Data Center revenue is expected to more than double year-over-year in 2027. Capital expenditure was $808 million against roughly $299 million modelled, and free cash flow fell to $1.56 billion from $2.57 billion in the first quarter as the company buys capacity ahead of the Helios rack ramp. Shares fell roughly 8% after hours, back below $480. Market cap $845.60 billion.
The Problem/Win:The problem is the cash-flow statement, not the income statement. AMD beat on revenue, earnings and margin, guided the next quarter roughly $480 million above consensus, and told the market data-center revenue would more than double again in 2027 — and the stock lost 8%. The reason is $808 million of capital expenditure against a $299 million model, which cut free cash flow by roughly 40% sequentially. Buying capacity ahead of the Helios ramp is defensible and arguably necessary, but it converts a capital-light merchant-silicon story into something that consumes cash to grow, and it does so at a moment when memory and capacity costs are rising across the industry.
The Ripple:The timing is what makes this consequential beyond AMD. The semiconductor complex rallied violently during the regular session — Intel and SanDisk each adding 10.84%, Technology leading all sectors at +4.25% — and then the sector’s most-watched AI reporter beat and sold off on cost. That is the same input-cost inflation that has been lifting memory suppliers arriving on a merchant supplier’s own accounts, and it directly tests the thesis behind today’s rally.
What It Means:Demand is not the question — 107% data-center growth and a raised outlook settle that. The question is what share of AI revenue the merchant suppliers keep after paying for the capacity to deliver it, and today’s answer was worse than expected.
What to watch:Whether the after-hours decline transmits to Intel, Micron and the broader complex at Wednesday’s open, which would mark today’s 10%-plus semiconductor rally as premature. Watch AMD’s capital-expenditure guidance for the second half — a repeat of the $808 million run rate would make the free-cash-flow compression structural rather than a single-quarter build.
BULLISH
20. Arista Networks (ANET): +11% AH | The First $3 Billion Quarter and Operating Margin Expanding to 49.9%
The Numbers:Released: AMC. Revenue of $3.036 billion against $2.83 billion consensus, a 7.26% beat, up 37.7% year-over-year and 12.1% sequentially — the company’s first quarter above $3 billion. Non-GAAP diluted EPS of $1.02 against $0.89 expected, a 15.14% beat. Product revenue of $2.61 billion drove the bulk of the result, with non-GAAP operating margin expanding to 49.9% from 48.8% a year earlier. Q3 revenue guided to approximately $3.30 billion with non-GAAP diluted EPS of $1.06-$1.08. Growth was broad-based across AI networking, data centers, campus and routing. The company introduced 1.6 Tbps AI fabric platforms, including liquid-cooled options for scale-up, scale-out and scale-across networks. Shares closed the regular session up 4.98% and rose roughly 11% after hours. Market cap $239.89 billion.
The Problem/Win:The win is margin expansion alongside 37.7% revenue growth, which is the exact inverse of what AMD reported an hour earlier. Arista grew faster than the merchant silicon vendors and expanded operating margin to 49.9% while doing it, because networking sits at a point in the AI stack where the customer pays for performance rather than for commodity capacity. Guiding Q3 to approximately $3.30 billion implies continued sequential acceleration rather than a plateau.
The Ripple:Arista and AMD reported within the same hour with opposite outcomes — Arista up 11% on expanding margin, AMD down 8% on capital expenditure — and the contrast is the most useful signal of the evening. It suggests the market is no longer paying uniformly for AI exposure but is discriminating by where in the stack a company can defend margin. That is a refinement of the buyers-versus-sellers divergence this report tracked last week, and it favours networking and interconnect over compute silicon.
What It Means:Arista is capturing AI infrastructure spend without the capital intensity that is currently penalising the chip vendors. That combination — 37.7% growth, 49.9% operating margin, no comparable capex build — is the strongest expression of the AI trade currently available in the large-cap complex.
What to watch:Whether operating margin holds near 49.9% as the 1.6 Tbps platforms ramp, since new product introductions typically compress margin before they expand it. Watch cloud-titan concentration in the revenue mix, which is the single largest structural risk to the guidance.
BULLISH
21. Amgen (AMGN): AH: n/a | Six Growth Drivers Up 26% Carry a Guidance Raise on Both Revenue and Earnings
The Numbers:Released: AMC. Revenue of $10.05 billion against $9.43 billion consensus, a 6.66% beat and up 10% year-over-year, with product sales up 9% on volume growth. Adjusted EPS of $6.29 against $5.62 expected, an 11.97% beat. The six key growth drivers — Repatha, EVENITY, TEZSPIRE, rare disease, innovative oncology and biosimilars — grew 26% year-over-year and generated nearly 70% of second-quarter product sales. Full-year 2026 guidance was raised on both lines, revenue to $37.1-$38.5 billion and non-GAAP EPS to $21.70-$23.10, with management citing growth drivers already running ahead of plan. Repatha growth is coming from both cardiologists and primary care physicians, particularly for high-risk diabetes patients. The MariTide obesity programme continues through Phase 3 across weight management, cardiovascular outcomes and heart failure. Shares closed the regular session up 3.03%; no after-hours figure was available at the time of writing. Market cap $210.50 billion.
The Problem/Win:The win is portfolio composition. Six franchises growing 26% and supplying nearly 70% of product sales means the legacy biologics that have historically defined Amgen no longer set the growth rate, and management raised both revenue and EPS guidance rather than trading one for the other — a distinction worth noting on the same day Merck raised revenue and cut profit. Repatha broadening from cardiology into primary care is the specific detail that matters, because primary-care prescribing is what converts a specialty drug into a volume franchise, and it is holding even after Merck’s oral PCSK9 approval.
The Ripple:Amgen’s 3.03% regular-session gain was among the strongest in a Healthcare sector that closed at +0.03%. MariTide is the sector-level variable: a monthly obesity injectable in Phase 3 alongside Pfizer’s berobenatide Phase 2b data released the same morning means two credible monthly-dosing challengers to the weekly incumbents surfaced within hours of each other, one day before Eli Lilly reports.
What It Means:Amgen is executing on the transition it has been promising, and raising both guidance lines is the cleanest form of management confidence available. The obesity programme is unpriced optionality rather than a near-term earnings contributor.
What to watch:Whether the six growth drivers hold above 20% growth next quarter, since the raised full-year guidance depends on them rather than on the legacy portfolio. Watch MariTide Phase 3 readout timing against the competitive monthly-dosing entrants that emerged today.
BULLISH
22. Gilead Sciences (GILD): -0.84% AH | Yeztugo Passes a $1 Billion Run Rate in Its First Full Year on the Market
The Numbers:Released: AMC. Revenue of $7.80 billion against $7.40 billion consensus, a 5.47% beat. Adjusted EPS of -$6.75 against -$7.26 expected, a 7.03% beat, while GAAP EPS of -$8.45 missed a -$7.67 estimate by 10.18%. HIV sales reached $5.7 billion, up 12% year-over-year and 13% sequentially, with Biktarvy at $3.8 billion, up 7% year-over-year and 12% sequentially. Yeztugo generated $232 million, up 40% sequentially and more than double a year earlier, passing a $1 billion annual run rate with strong patient retention; full-year Yeztugo guidance was raised to $1 billion. Base business sales rose 10% year-over-year to $7.6 billion, the company’s strongest second-quarter growth in three years. The FDA accepted a supplemental NDA for Yeztugo as a once-weekly oral HIV pre-exposure prophylaxis with a PDUFA target action date of February 2, 2027. Shares closed the regular session up 3.14% at $135.27 and eased 0.84% after hours to $134.11. Market cap $167.92 billion.
The Problem/Win:The win is Yeztugo reaching blockbuster scale in its first full year, which is fast even by the standards of a well-supported HIV launch. Forty percent sequential growth with strong retention indicates the prevention market is expanding rather than cannibalising Gilead’s existing franchise, and Biktarvy’s 12% sequential growth confirms that. The FDA’s acceptance of the once-weekly oral formulation is the more valuable item on a multi-year view — an oral option addresses the adherence population that injectables reach poorly.
The Ripple:Gilead’s 3.14% regular-session gain, alongside Amgen’s 3.03% and Vertex’s 1.75%, meant the large-cap biotech complex materially outperformed a Healthcare sector that finished at +0.03%. The divergence within healthcare is now well established: biotech with launch-stage products is being rewarded, while large-cap pharma facing patent cliffs is not.
What It Means:Gilead has converted a single approval into a billion-dollar franchise inside a year and has a line of sight to expanding it into oral dosing. The modest after-hours easing after a 3.14% regular-session gain reads as profit-taking rather than a verdict on the print.
What to watch:Yeztugo sequential growth next quarter against today’s 40% — sustaining even half that rate would put the franchise well above the raised $1 billion guidance. Watch the February 2, 2027 PDUFA date for the once-weekly oral formulation.
BULLISH
23. Booking Holdings (BKNG): +5% AH | Gross Bookings Beat a Deliberately Conservative Guide Set for Middle East Disruption
The Numbers:Released: AMC. Revenue of $7.35 billion against $7.19 billion consensus, a 2.23% beat. Adjusted EPS of $2.54 against $2.43 expected, a 4.44% beat. Gross bookings exceeded consensus, which analysts had modelled at approximately $49.42 billion against $46.70 billion in the year-ago quarter. Management had guided Q2 conservatively — room nights up 2-4% and gross bookings, revenue and adjusted EBITDA each up 4-6% — on the explicit assumption that the Middle East conflict’s impact would be more pronounced in the second quarter, following a first quarter in which gross bookings rose 15% to $53.8 billion on 338 million room nights. Shares rose more than 5% after hours. Market cap $150.54 billion.
The Problem/Win:The win is that the conflict discount management built into the guide did not materialise at the scale assumed. Booking told the market in April to expect the Middle East to bite hardest in Q2 and set the bar accordingly; beating it on gross bookings means either the disruption was narrower than feared or travel demand elsewhere absorbed it. Either reading is constructive, and the second is the more valuable one — it would indicate that global travel demand is resilient enough to route around a closed regional corridor.
The Ripple:The result lands directly on the day’s dominant macro theme. Booking is the largest listed proxy for discretionary international travel, and its beat arrived on the session Brent fell 6.08% on Hormuz reopening reporting and the Dow Jones Transportation Average gained 2.58%. Cheaper jet fuel and a beat on travel demand from the same session reinforce each other, and both point at the same forward variable — whether the strait actually reopens.
What It Means:Discretionary travel demand held up against a guide built for disruption, which is a better consumer signal than anything McDonald’s or Nike delivered today. The gap between the low-income consumer read and the international-travel read continues to widen.
What to watch:Q3 guidance on room nights, which will reveal whether management still assumes a Middle East drag now that a Hormuz reopening is being discussed as imminent. Watch whether the beat came from room-night volume or from average booking value, since only the former indicates genuine demand strength.
WEEK AHEAD PREVIEW:
Q2 2026 earnings season is roughly 61% complete, and Wednesday August 5 carries a dense large-cap slate spanning obesity, media, storage and healthcare services.
Eli Lilly (LLY) — BMO, Wednesday August 5 — consensus $6.01 EPS on $20.69 billion of revenue. The largest report of the week by market value at roughly $1.05 trillion, with options implying a post-earnings move of about 7.4%. Key focus: GLP-1 and obesity franchise demand, tirzepatide volumes, and full-year guidance — sharpened by Pfizer’s berobenatide Phase 2b data and Amgen’s MariTide Phase 3 progress, both of which surfaced today as monthly-dosing challengers to Lilly’s weekly incumbency.
Walt Disney (DIS) — BMO, Wednesday August 5 — consensus $1.86 EPS on $25.39 billion of revenue. Key focus: streaming profitability and subscriber economics, theme park attendance and per-capita spend, and the content pipeline. Parks are the cleanest discretionary-consumer read in the report, and it lands against a Consumer Cyclical sector that closed flat at 0.00% today.
Shopify (SHOP) — BMO, Wednesday August 5 — consensus $0.40 EPS on $3.45 billion of revenue. Key focus: gross merchandise volume growth, merchant additions, and monetisation of AI-powered commerce tools. The most direct listed read on small and mid-sized merchant health, which is where the Section 301 tariff costs land hardest.
Uber Technologies (UBER) — BMO, Wednesday August 5 — consensus $0.80 EPS on $14.24 billion of revenue, against $0.63 on $12.65 billion a year ago. Key focus: ride-hailing demand, delivery growth and the trajectory of segment profitability. Falling crude is a second-order tailwind through driver economics rather than a direct input.
CVS Health (CVS) — BMO, Wednesday August 5 — consensus $1.85 EPS on $100.03 billion of revenue. Key focus: healthcare services performance, insurance segment medical loss ratios, and pharmacy margins. Reports into continued managed-care pressure that pushed UnitedHealth down 1.88% today as one of the session’s largest mega-cap decliners.
Sandisk (SNDK) — AMC, Wednesday August 5 — consensus $34.80 EPS on $8.44 billion of revenue. Closed today at +10.84%, one of the session’s five largest mega-cap gainers. Key focus: NAND flash pricing, consumer storage demand and profitability. The most direct test of whether memory price inflation is reaching supplier margins or being absorbed by capacity spending — the precise question AMD’s capital-expenditure line failed tonight.
Western Digital (WDC) — AMC, Wednesday August 5 — consensus $3.31 EPS on $3.70 billion of revenue. Key focus: AI-driven storage demand, enterprise SSD shipments and margins. Reports the same evening as Sandisk, giving two independent reads on the storage pricing cycle within hours.
AppLovin (APP) — AMC, Wednesday August 5 — consensus $3.76 EPS on $1.94 billion of revenue, with revenue expected to grow roughly 54.6% year-over-year. Key focus: the e-commerce advertising ramp beyond mobile gaming, following a 12%-plus single-day decline on July 13 when industry data suggested e-commerce ad growth was slowing. Q1 delivered $1.84 billion of revenue, $1.21 billion of net income and an 85% EBITDA margin before the e-commerce expansion contributed materially.
Reporters for Thursday August 6 and Friday August 7 were not visible in the current earnings calendar view and will be carried in tomorrow’s report.
— US market commentary trusted by family offices and institutions. Apply for membership at join.recessionalert.comG. WHAT’S NEXT -> TOP
UPCOMING RELEASES:
| Date | Event | Why It Matters |
|---|---|---|
| Wed, Aug 5 | ISM Services PMI (prior 54.0) | The direct test of whether June’s factory-orders softness is confined to manufacturing or broadening into the two-thirds of the economy that services represent. A print holding above 54 alongside July’s multi-year-high manufacturing survey would isolate the weak orders data as noise; a slip toward 50 turns a bifurcated industrial picture into a genuine demand problem. |
| Wed, Aug 5 | ADP Employment Change (expected 70K) | The first labour read since June JOLTS openings fell to 7.359 million and missed consensus. With the FOMC having removed cuts from its distribution, a soft ADP would sharpen the stagflationary configuration — cooling labour demand against a funds rate held at 3.50%-3.75% for five consecutive meetings — that neither the equity record nor the bond rally is discounting. |
| Wed, Aug 5 | Treasury Quarterly Refunding Announcement | Sets coupon auction sizes for the quarter and is the supply-side input to a long end that has rallied two sessions on the oil price rather than on fundamentals. Any increase in duration issuance would push against the 10-year’s 6.8 bp decline to 4.616% and test how much of that move was disinflation versus flight to duration. |
| Thu, Aug 6 | Initial Jobless Claims (prior 197K) | Claims near 197K remain historically tight and stand in direct contradiction to falling job openings. A move higher would confirm the JOLTS signal and be the first genuine crack in the labour market; continued strength keeps the “openings normalisation, not deterioration” reading intact ahead of Friday’s payrolls. |
| Thu, Aug 6 | Nonfarm Productivity QoQ Prel. (expected 0.6%) and Unit Labour Costs QoQ Prel. (expected 2.1%) | Unit labour costs are the cleanest available read on domestically generated inflation and speak directly to Paulson’s estimate of underlying inflation at 2.4%-2.8%. A print at or below 2.1% supports the case that the inflation problem is composition and passthrough rather than demand; an upside surprise strengthens the three officials who have now kept a hike on the table in as many sessions. |
| Fri, Aug 7 | Non Farm Payrolls (expected 80K) and Unemployment Rate (expected 4.2%) | The week’s dominant event and the first release with enough weight to break the market’s habit of trading only the oil price. With no cut priced and three Fed officials refusing to rule out a hike, a soft payroll number forces the committee to choose between its inflation framing and a labour market that is visibly cooling. |
| Fri, Aug 7 | Average Hourly Earnings MoM (expected 0.3%) | The wage component the hawks on the committee are watching most closely. At 0.3% the annualised pace sits above the level consistent with 2% inflation, which is precisely the evidence that keeps a hike in the distribution even as crude collapses and headline pressure eases. |
| Fri, Aug 7 | Consumer Inflation Expectations | Expectations are the transmission channel through which a 6.08% single-session drop in Brent either becomes disinflation or does not. A decline would validate the market’s read that cheaper energy relieves the inflation constraint; stickiness would show that six months of blockade have embedded expectations the oil price alone cannot dislodge. |
KEY QUESTIONS:
1. If a Hormuz agreement is signed this week, does it specify whose territorial waters inbound vessels transit — and if it does not, how much of an 11% two-session decline in Brent survives the first routing dispute?
2. Does AMD’s after-hours decline on a clean beat transmit to Intel, Micron and the rest of a complex that rallied double digits today without reporting — or was the capex line an AMD-specific problem rather than the industry’s?
3. Two sessions of US data have moved yields not at all. When Friday’s payrolls arrive, does the curve finally trade domestic macro — and which way does the accumulated backlog break, given Monday’s 6.2% growth nowcast and today’s softening labour demand point in opposite directions?
— US market commentary trusted by family offices and institutions. Apply for membership at join.recessionalert.comH. CHART OF THE DAY -> TOP
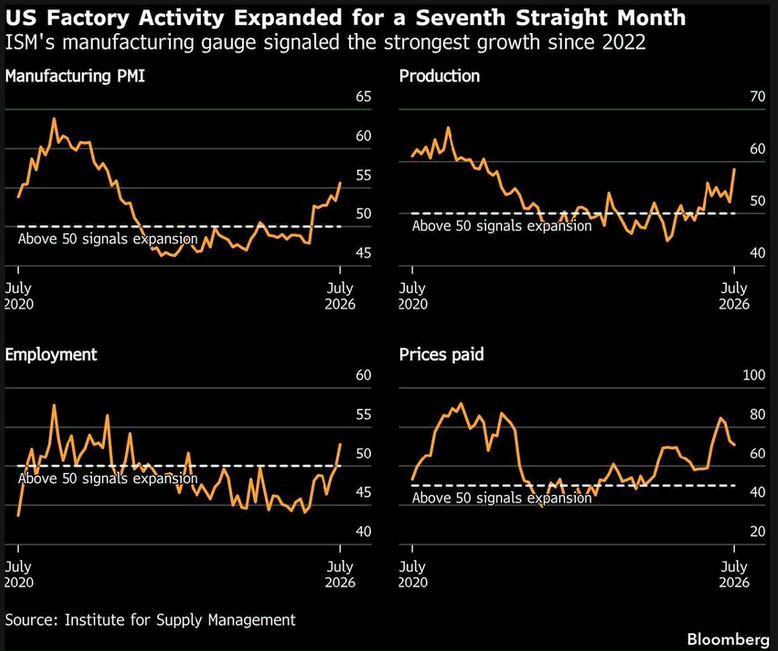
Manufacturing employment crossed 50 in July, after 33 months below it — the only one of these four series that changed state rather than merely extended a move. Orders were never the constraint: New Orders added 0.7. What broke loose was the queue behind it. Backlog jumped 4.5 points to 55.0 while customers’ inventories, “too low” for 22 straight months, left nothing to ship from stock — every unit demanded had to be built. Production answered, and only then did hiring follow, because manufacturers do not hire on orders; orders can be met with overtime, with a shift extension, with drawing the queue down. They hire when the backlog outlasts what existing headcount can absorb, and 60% of panelists now say their companies are hiring. But the same congestion that created the job is booked twice. Supplier Deliveries, 58.9 and slowing for an eighth month, enters the composite as a positive — strip it and the other four sub-indices average 54.8 — then lands again in the price index, where raw materials have risen 22 consecutive months. That is cost-push meeting a labor market that just started absorbing again, in the most rate-sensitive, inventory-financed sector in the economy, in front of a Fed that held 9–3 with all three dissents for hikes and September priced near 57%. The queue that finally created the job is the same queue that argues for the hike that ends it.
Market Intelligence Brief (MIB) Ver. 18.47
For professional investors only. Not investment advice.
© 2026 RecessionALERT.com

Comments are closed.