
MIB WEEKLY DIGEST
Week of Jul 20–24, 2026
Brent topped $100 for the first time in two months and closed the week up 11.39% after Houthi missiles struck two Saudi tankers, before a China-brokered diplomatic feeler pulled it back Friday. The larger repricing was in AI: Alphabet (−7.13%), Tesla (−14.52%) and then Intel (−7.89% despite its best growth in fifteen years) were all punished for capital spending, while Apple (+3.53%) and IBM (+3.65%) were bid for having none. Section 301 duties of 10–12.5% took effect Friday on 99.4% of US imports. Polymarket’s 2026 hike odds jumped 21 points to 72% heading into Wednesday’s FOMC.
TABLE OF CONTENTS
A. WEEK AT A GLANCE
B. WEEK IN MARKETS
C. WEEK’S TOP STORIES (6)
D. WEEK IN THE ECONOMY (5)
E. WEEK IN EARNINGS (3)
F. NEXT WEEK SETUP
G. CHART OF THE WEEK
A. WEEK AT A GLANCE -> TOP
The S&P 500 lost only 0.61% on the week, which is the least interesting number in this report. Beneath it the Nasdaq 100 fell 1.62% across four consecutive sessions while the NYSE Composite rose 0.73% to close Friday at its weekly high — a 2.35-point spread that measures exactly how narrowly the damage was aimed. The single dominant driver was a repricing of AI capital intensity, with Alphabet, Tesla and finally Intel each sold on spending rather than results, while a second front opened in the Red Sea carried Brent above $100 and pushed the 2-year yield up 15.4 bps. Both shocks were cost-push, both landed days before an FOMC, and the rates market answered by moving 2026 hike odds from 51% to 72%.
• Biggest single-day move: Thursday’s 1.87% Nasdaq 100 drop, as Alphabet (−7.13%) and Tesla (−14.52%) both sold off on raised capex despite beating on revenue.
• Biggest weekly winner and loser: Dell +10.39% on AI-server demand it sells into; Tesla −17.81% on AI capex it must fund — the same trade from both ends.
• Standout single-stock reversal: Intel beat by 100% on EPS with its best growth in fifteen years, rose 12–13% after hours, then closed the next session down 7.89% — a 20-point swing on the capex line alone.
• Standout commodity move: Brent +11.39% to $98.17 after closing above $100 Thursday, with Dutch TTF +11.98% while Henry Hub finished red at −1.10% — a 13-point transatlantic gas split.
• Biggest econ print: Initial jobless claims at 187,000, the lowest since 1969, against a ~212,000 consensus — removing the labour-market case for Fed patience.
• Biggest policy event: Section 301 forced-labor duties of 10–12.5% took effect Friday across 60 economies covering 99.4% of US imports — and were sued over within hours.
1. The market repriced capital intensity, not AI demand — Intel’s data-centre revenue grew 59% and Alphabet’s cloud accelerated to 82% in the quarters that got sold, while Apple and IBM were bid the same session for owning no build at all; the discount rate on AI spending changed, the demand estimate did not.
2. Two unrelated shocks pushed rates the same way — a Red Sea supply disruption and a tariff floor across 99.4% of imports are entirely separate events, but both are cost-push and both landed days before an FOMC, which is why the 2-year outpaced the 10-year every session Monday to Thursday and hike odds rose 21 points on no demand data whatsoever.
3. Concentrated damage is not the same as contained damage — eight of eleven sectors closed green, the NYSE Composite finished at its weekly high and the VIX ended lower despite two sessions of >1% losses, yet the two red sectors each contained one of the week’s five worst mega-caps; breadth held because the selling was precisely targeted, which tells you the mechanism is still live rather than exhausted.
4. Which statute applies has become a pricing variable — Section 301 duties are investable where the struck-down IEEPA versions were not, and twelve state attorneys general froze a federally cleared $111 billion merger until 2027; in both cases the substantive question was already settled and the outcome turned on legal instrument and forum, which shortens corporate planning horizons independently of anything markets did.
 — Leading economic indicators. Accurate market forecasts. Apply for membership at join.recessionalert.com
B. WEEK IN MARKETS -> TOP
Two cost-push shocks defined the week and one repricing dominated it. Houthi missiles struck two Saudi tankers Thursday, carrying Brent above $100 for the first time in two months, and Section 301 duties landed Friday on 99.4% of US imports — both arriving days before an FOMC. The equity story ran the other way: Alphabet, Tesla and finally Intel were each sold for raising capital spending, sending the Nasdaq 100 down 1.62% across four consecutive losing sessions from Tuesday’s peak. The week’s sharpest divergence sits between those two facts. While the Nasdaq 100 bled, the NYSE Composite finished the week up 0.73% at its own weekly high and eight of eleven sectors closed green. The damage was concentrated by design, not contained by luck.
FRIDAY CLOSE & WEEK-ON-WEEK CHANGE — Fri, Jul 24, 2026:
MAJOR INDICES
The cleanest tell of the week is a 2.35-point gap between the NYSE Composite (+0.73%) and the Nasdaq 100 (−1.62%) — the broad tape closed Friday at its weekly high while mega-cap growth fell four sessions straight from Tuesday’s 29,155 peak. No formal history signal crossed threshold: the Dow-Transports split ran only 0.71 points and the S&P’s edge over the Nasdaq 100 stopped at 1.01, just short. Read together, that is a capex-driven rotation inside the market, not a market-wide de-risking.
| Index | Fri Close | WoW Change | WoW % | Why It Moved (Week) |
|---|---|---|---|---|
| S&P 500 | 7,411.96 | −45.72 | −0.61% | Tuesday’s memory-led +0.89% was fully surrendered by Thursday’s −1.21% capex shock. Energy and defence strength offset the growth damage, leaving a small net loss on a violent week. |
| Dow Jones | 51,946.51 | −199.91 | −0.38% | Held up best of the three headline indices because it carries the least AI-capex exposure; Friday’s +0.45% recovery on falling crude and rate-sensitive strength trimmed most of Thursday’s 507-point loss. |
| DJ Transportation | 22,476.20 | −247.70 | −1.09% | Fuel cost did the damage: transports fell Monday and again Friday even as crude retreated, unable to convert Union Pacific’s record quarter into sector strength while jet and diesel inputs repriced upward. |
| Nasdaq 100 | 28,128.34 | −464.32 | −1.62% | The week’s worst index, and entirely self-inflicted: four straight declines from Tuesday’s peak as Alphabet, Tesla and Intel were each sold on capital-spending guidance rather than on results. |
| Russell 2000 | 2,932.03 | −28.92 | −0.98% | Gave back Tuesday’s +1.43% across the back half as the 2-year yield climbed 15.4 bps — small caps carry the most floating-rate debt and repriced with the front end, not with the capex story. |
| NYSE Composite | 23,990.88 | +173.91 | +0.73% | The only major index green on the week, and it closed Friday at its weekly high — the breadth-weighted gauge never participated in the mega-cap damage, rising on three of five sessions. |
VOLATILITY & TREASURIES
The VIX finished the week lower at 18.57 despite two sessions of >1% index losses — volatility never priced a systemic event because the selling never became one. Yields tell the more important story: the 2-year added 15.4 bps against the 10-year’s 13.0, compressing 2s10s from 36.8 to 34.4 bps in a front-end-led flattening that ran Monday through Thursday without pause. That is inflation repricing, not recession fear, and its catalyst was crude rather than any data print or Fed speech.
| Instrument | Fri Level | WoW Change | Why It Moved (Week) |
|---|---|---|---|
| VIX | 18.57 | −0.17 (−0.91%) | Collapsed 8.58% Tuesday on the memory rally, then spiked 12.38% Thursday on the Alphabet-Tesla shock — a full round trip that netted to a small decline, confirming the options market never treated the week as systemic. |
| 10-Year Treasury Yield | 4.681% | +13.0 bps | Rose on four of five sessions, touching 4.696% Thursday — its highest since January 2025 — as Brent’s move above $100 forced an inflation-risk repricing. Friday’s crude reversal clawed back only 2.2 bps. |
| 2-Year Treasury Yield | 4.337% | +15.4 bps | Outpaced the long end all week as the July hike moved from tail risk to live possibility, compounded Thursday by initial claims at their lowest level since 1969 removing the labour-market case for patience. |
| US Dollar Index (DXY) | 101.49 | +0.72 (+0.71%) | Firmed on rate differentials rather than safe-haven demand — the gain accrued Monday and Thursday alongside rising yields, and the dollar closed flat on Friday’s equity decline. |
COMMODITIES
Silver’s +4.04% against gold’s +0.82% is a five-to-one ratio that no safe-haven story explains — and platinum finished red at −0.29%, so the precious complex did not move as a bloc. The tell came Thursday: gold fell 2.42% on the single session when Houthi missiles hit Saudi tankers, because rising yields overwhelmed the geopolitical bid entirely. Bitcoin’s +0.07% is the week’s most eloquent number, round-tripping from $66,435 Tuesday to close within $47 of where it started.
| Asset | Fri Price | WoW Change | WoW % | Why It Moved (Week) |
|---|---|---|---|---|
| Gold | $4,056.12/oz | $+33.12 | +0.82% | Ran to $4,140 by Wednesday on pre-FOMC positioning and Mideast escalation, then surrendered most of it Thursday when the yield surge dulled its appeal on the very day the conflict escalated furthest. |
| Silver | $58.493/oz | $+2.273 | +4.04% | The week’s standout metal, outpacing gold five to one on a combination of the monetary bid and industrial demand that copper only partly shared. |
| Copper | $6.3375/lb | $+0.0675 | +1.08% | Recovered a Tuesday spike to $6.55 before fading, ending modestly higher — a muted industrial signal that neither confirmed nor contradicted the firming activity surveys. |
| Platinum | $1,598.85/oz | $−4.65 | −0.29% | The only metal red on the week, giving back a Tuesday run to $1,664 in a 3.02% Thursday collapse — the clearest evidence the precious bid was rate-driven rather than fear-driven. |
| Bitcoin | $64,258.00 | $+47.00 | +0.07% | Traded as a high-beta Nasdaq proxy throughout — up with Tuesday’s chip rally, down with Thursday’s capex shock and Friday’s semiconductor rout — and finished the round trip flat. |
ENERGY
Dutch TTF’s +11.98% edged out Brent’s +11.39% while Henry Hub finished red at −1.10% — a 13-point transatlantic gas split, and European gas rose 2.36% on Friday, the session crude fell 2.50%. Two benchmarks near-matched on the week share no driver at all. The Brent-WTI spread widened from $6.49 Monday to $8.26 Thursday before compressing to $7.74, confirming the risk premium loaded into seaborne barrels first and bled out of them first. Crude rose while equities fell all week until Friday reversed both.
| Asset | Fri Price | WoW Change | WoW % | Why It Moved (Week) |
|---|---|---|---|---|
| Crude Oil (WTI) | $90.43/bbl | $+7.96 | +9.65% | Four consecutive advances built the move — a Tuesday tanker strike, an eleventh night of US strikes Wednesday, then a 6.37% Thursday surge on the Saudi tanker attacks — before Friday’s diplomatic report took back 1.91%. |
| Crude Oil (Brent) | $98.17/bbl | $+10.04 | +11.39% | Closed above $100 Thursday for the first time in two months as the Red Sea route was attacked, opening a second chokepoint alongside Hormuz; the Friday retreat left it still $10 above where the week began. |
| Natural Gas (Henry Hub) | $2.884/MMBtu | $−0.032 | −1.10% | Sat out the entire crude escalation on ample domestic supply, falling on three of five sessions — US gas is insulated from Gulf chokepoint risk in a way no other energy benchmark is. |
| Natural Gas (Dutch TTF) | $21.13/MMBtu | $+2.26 | +11.98% | The week’s best-performing energy benchmark, driven by European supply tightness rather than the Gulf — it rose 4.72% Wednesday and again on Friday as crude fell, decoupling completely. |
S&P 500 SECTORS — WEEKLY ROTATION
Energy is textbook regime leadership — first on the week at +3.49% and also first on 1M, 6M, YTD and 12M — and it was broad, not single-name: Exxon’s +6.50% ranks only fifth among weekly gainers. The bottom of the table is the opposite. Communication Services (−5.82%) and Consumer Cyclical (−5.43%) each contain one of the week’s five worst mega-caps, Meta at −7.87% and Tesla at −17.81%, and both sectors are negative on every horizon from one week to six months. Strip those two names and the losses shrink materially; strip them from the index and eight of eleven sectors closed green.
| Sector | 1-Week | 1-Month | 3-Month | 6-Month | YTD | 12-Month |
|---|---|---|---|---|---|---|
| Energy | +3.49% | +11.27% | +2.24% | +22.85% | +32.59% | +37.06% |
| Basic Materials | +2.23% | −0.69% | −7.79% | −6.18% | +7.68% | +25.45% |
| Utilities | +1.71% | +0.82% | −2.34% | +5.76% | +7.57% | +11.62% |
| Industrials | +0.60% | −3.69% | −1.34% | +4.07% | +13.04% | +15.27% |
| Real Estate | +0.53% | +3.41% | +5.33% | +10.64% | +13.35% | +8.45% |
| Healthcare | +0.26% | +4.58% | +9.58% | +1.98% | +5.15% | +19.28% |
| Technology | +0.06% | −2.20% | +8.75% | +16.94% | +16.68% | +27.07% |
| Financial | +0.03% | +4.56% | +9.50% | +5.71% | +6.00% | +12.36% |
| Consumer Defensive | −1.57% | −1.60% | −1.93% | +0.81% | +6.54% | +4.26% |
| Consumer Cyclical | −5.43% | −3.22% | −7.22% | −12.06% | −9.56% | −5.44% |
| Communication Services | −5.82% | −3.02% | −7.59% | −5.93% | −5.43% | +11.39% |
TOP WEEKLY MOVERS:
Both leaderboards are one trade viewed from opposite ends. Every gainer sells hardware, services or barrels into someone else’s capital budget; four of the five decliners either fund an AI build directly or are being asked to justify one. The horizon data underneath sharpens it: Dell’s +273% half-year and Micron’s +724% year are momentum continuations, while Oracle’s −27% month and −52.65% year make it a structural breakdown, not a wobble — and Palo Alto, still +75.78% YTD, is the only decliner giving back a genuine winner. Note what the sector table cannot show: Micron finished the week up 8.48% and fell 6.99% on Friday.
TOP 5 WEEKLY GAINERS
| Ticker | Week | YTD | Year | Why It Moved |
|---|---|---|---|---|
| DELL | +10.39% | +247.55% | +240.86% | Rose 9.32% Wednesday after Super Micro reported record AI-server orders and lifted its gross-margin outlook, validating enterprise AI-hardware demand across the supply chain. Evercore ISI raised its target to $500 and JPMorgan to $550, both citing the $51.3 billion AI backlog across 5,000-plus active AI customers; Citi added an upside 90-day catalyst watch. Dell sells the build rather than funding it — the distinction the market rewarded all week. |
| RTX | +9.96% | +16.03% | +37.09% | Jumped 7.33% Thursday on a beat-and-raise across all three segments: sales $24.7 billion, 8% above the Street, adjusted EPS $1.89 versus $1.66 expected, and a record $289 billion backlog. Missile restocking by governments depleted by the Ukraine and Middle East conflicts drove Raytheon segment bookings of $19.9 billion, a 2.42 book-to-bill. Full-year guidance was raised across sales, EPS and free cash flow. |
| MU | +8.48% | +222.68% | +724.26% | Surged 12% Tuesday after Morgan Stanley forecast rising memory prices on sustained AI demand, corroborated by strong South Korean export data, then added more Thursday as hyperscaler capex guidance was read as a direct high-bandwidth-memory demand signal. Gave back 6.99% Friday when a KOSPI selloff drove SK Hynix down 6% in Seoul — a net weekly gain that conceals a violent round trip. |
| TMO | +6.72% | −1.93% | +19.63% | Gained 8.71% Thursday, the day’s best mega-cap performer, on Q2 revenue of $11.99 billion against a $11.68 billion consensus, 90 basis points of adjusted operating-margin expansion and raised full-year guidance to $47.4–48.1 billion. Demand strength was broad across pharma, biotech, academic, government and industrial end markets. Baird lifted its target to $652. Still negative year to date — a counter-trend recovery, not a momentum run. |
| XOM | +6.50% | +30.41% | +41.66% | No company-specific catalyst — a pure commodity-beta move as Brent gained 11.39% on the week and closed above $100 Thursday. The stock ran six consecutive sessions for an 8.57% advance while the S&P fell, before easing 0.04% Friday alongside crude’s reversal. Q2 results are due July 31. |
TOP 5 WEEKLY DECLINERS
| Ticker | Week | YTD | Year | Why It Moved |
|---|---|---|---|---|
| TSLA | −17.81% | −30.39% | +2.53% | Fell 14.52% Thursday, its worst session in roughly a year, after Q2 non-GAAP EPS of $0.33 missed the $0.54 estimate despite record revenue of $28.24 billion. Operating margin collapsed to 1.4% and free cash flow turned negative $1.09 billion, while Musk called 2026 a “massive capex year” with spending above $25 billion on AI, robotaxi and Optimus — nearly triple 2025’s $8.53 billion. |
| PANW | −9.73% | +75.78% | +60.96% | No single catalyst — a high-multiple software name giving back part of an outsized run, with the decline beginning Monday and running through the week. The company agreed to acquire Embrace Mobile on July 21 to extend its observability platform, and Argus raised its target to $425 from $320, neither of which arrested the slide. CEO Nikesh Arora’s public comments on the OpenAI sandbox breach put the name in the AI-risk conversation without a corresponding bid. |
| ORCL | −9.03% | −41.00% | −52.65% | Hit from both ends. Monday brought a Project Jupiter data-centre setback threatening its August 15 power-infrastructure timeline; Thursday it fell 4.61% on cash-burn scrutiny — $55.7 billion trailing capex against negative $23.7 billion free cash flow — even as reports emerged of a roughly $20 billion Meta cloud agreement. A $7 billion, ten-year Defense Department software award failed to hold the stock, which is now down more than 50% since June 2. |
| AXP | −8.21% | −11.83% | +5.81% | Dropped 4.30% Friday on a Q2 print that beat EPS at $4.53 versus $4.40 but missed revenue at $19.64 billion. Card-member spending grew 9% FX-adjusted, the strongest quarterly pace in three years, yet management raised full-year revenue growth guidance to 10% while leaving the $17.30–17.90 EPS range untouched — implying the incremental revenue arrives at lower margin through rewards and acquisition costs. |
| META | −7.87% | −9.83% | −16.73% | Closed Friday at $595.19, a seventh consecutive losing session, with capital-allocation anxiety the stated driver ahead of its July 29 report. Needham’s Laura Martin reiterated a Hold on Friday, flagging that spending spread across LLAMA, Quest, Orion, Ray-Ban smart glasses and Reality Labs is diluting shareholder value — the same open-ended-capex objection that hit Alphabet and Intel, applied pre-emptively before Meta has even reported. |
— Institutional-grade intelligence for serious investors. Apply for membership at join.recessionalert.comC. WEEK’S TOP STORIES -> TOP
Six stories, three threads. A physical-supply thread runs alone at #1, escalating daily until diplomacy interrupted it. A capital-discipline thread spans #2, #4 and #6 — the same question asked of hyperscalers, of memory suppliers and of the largest IPO ever priced. A legal-instrument thread joins #3 and #5, where the statute chosen, not the ruling reached, determined whether a cost or a merger survives. Threads two and three are in tension: one shortens corporate planning horizons through valuation, the other through law, and both landed in the same five sessions.
UNCERTAIN
1. A Second Chokepoint Opens: Houthi Missiles Hit Saudi Tankers, Brent Clears $100 — Then a China-Brokered Feeler Takes $2.45 Back
The core facts:The escalation compounded daily. Monday the Houthis declared a maritime embargo against Saudi Arabia in response to a strike on Sanaa airport, while the IRGC set two tankers ablaze off Oman and declared Hormuz “completely closed”; the national average gasoline price crossed $4.003. Tuesday a products tanker was struck near Hormuz. Wednesday brought an eleventh consecutive night of US strikes on Iran plus a drone attack that halted loadings at the Caspian Pipeline Consortium’s Black Sea terminal, affecting roughly 1.58 million bbl/day of Kazakh crude. Thursday Houthi missiles struck the Saudi tankers Encelia and Layla in the Red Sea, closing Brent at $100.62 (+6.96%) — the route Riyadh uses precisely to bypass Hormuz. Friday reports that Pakistan, at China’s initiative, was pursuing a framework to restart US-Iran talks sent Brent down 2.50% to $98.17, though Trump simultaneously weighed a “massive attack.” Brent finished the week +11.39%, WTI +9.65%.
Why it matters:The week converted a one-chokepoint problem into a two-chokepoint problem, which is a different risk entirely: Saudi Arabia routes 4–5 million bbl/day through Bab al-Mandeb specifically as the Hormuz workaround, and Goldman Sachs estimates that volume would be difficult to reroute. The market receipts are unambiguous — Energy led all sectors at +3.49% and leads on 1M, 6M, YTD and 12M; Exxon gained 6.50% to make the weekly gainers table; the Brent-WTI spread widened from $6.49 to $8.26 before compressing, confirming the premium loaded into seaborne barrels first. The uncomfortable detail is the gap between paper and physical. Futures fell Friday on a diplomatic report while Barclays noted physical cargoes changing hands near $110, inventories signalling a 6–8 million bbl/day deficit, and Kpler counting a single tanker crossing Hormuz on Thursday, the fewest since May 7. The entire retracement rests on a third-party initiative that has not yet produced a meeting.
What to watch:Kpler’s daily Hormuz transit count — a sustained recovery above single digits would validate the futures market’s de-escalation pricing, while continued collapse confirms the physical-deficit thesis. Whether Brent holds below $100 into Wednesday’s FOMC is the level at which the energy-inflation channel re-enters the policy debate outright.
BEARISH
2. Capital Intensity Becomes the Only Question That Matters: Alphabet, Tesla and Intel Punished for Spending — Apple and IBM Bid for Not
The core facts:Goldman Sachs set the frame Wednesday, flagging roughly $489 billion of AI-related debt issued in 2026 against 2025’s full-year $322 billion, about 40% of it from hyperscalers. Thursday delivered the verdict. Alphabet beat, with cloud revenue up 82% to $24.8 billion, and fell 7.13% after raising full-year capex guidance to $195–205 billion from $180–190 billion. Tesla posted record revenue of $28.24 billion and fell 14.52% — its worst session in a year — on a 1.4% operating margin, negative $1.09 billion free cash flow and Musk’s “massive capex year” above $25 billion. Both reported negative Q2 free cash flow. Friday extended the logic to a foundry: Intel delivered its strongest growth in fifteen years, jumped 12–13% after hours, then closed down 7.89% once the market absorbed 2026 capex above $20 billion with 2027 higher and tooling up 40%. The mirror trade ran simultaneously — Apple +3.53% toward a record, IBM +3.65%, both on asset-light models.
Why it matters:This is a change in the discount rate applied to AI capital spending, not a change in AI demand — Intel’s data-centre and AI revenue grew 59% in the quarter that got sold, and Alphabet’s cloud accelerated from 63% to 82%. That distinction is decisive for positioning, because it compresses multiples across the capex-heavy complex while leaving asset-light beneficiaries intact, which is precisely what the tape delivered. The receipts sit in the market tables: the Nasdaq 100 fell 1.62% on the week while the NYSE Composite rose 0.73%; Communication Services (−5.82%) and Consumer Cyclical (−5.43%) were the only sectors down more than 1.6%; Tesla (−17.81%), Oracle (−9.03%) and Meta (−7.87%) filled three of five weekly-decliner slots while Meta had not even reported. Note the asymmetry in that last fact: the market is now pricing the objection pre-emptively.
What to watch:Microsoft and Meta on Wednesday July 29 and Apple on Thursday July 30. Whether hyperscaler capex guidance draws the same punishment determines if this is a durable regime change in how AI spending is valued or a three-session overshoot — and Apple’s own capital-expenditure commentary would remove the very characteristic driving its bid.
BEARISH
3. A Tariff Floor Under 99.4% of US Imports — and This One Is Built to Survive Court
The core facts:The week began with escalation and ended with architecture. Tuesday Trump invoked Section 338 of the Tariff Act of 1930 — unused for decades — for an additional 50% on Canadian wine, hockey sticks, cement, vehicles and dairy, with no USMCA carve-out, effective August 19. That same day USTR Jamieson Greer previewed duties covering “about 99% of our trade” as the stopgap 10% global levy neared expiry. Friday at 12:01am ET the replacement landed: Section 301 forced-labor duties of 10% on compliant partners (Canada, Mexico, the EU, the UK, India) and 12.5% on the rest (China, Japan, Taiwan, Brazil, Australia), covering 60 economies and 99.4% of US imports, with in-transit goods exempt until July 28. Hours later the Liberty Justice Center sued on behalf of two small importers, challenging USTR’s theory that the mere absence of a foreign import prohibition is an “unreasonable” practice. Trump separately opened a Section 301 investigation into the EU over its €890 million Alphabet fine.
Why it matters:The mechanism matters more than the rate, which barely changed. Section 301 survived the 2018–2022 China litigation; the IEEPA tariffs it replaces were struck down in February, leaving Treasury paying out roughly $70 billion of $166 billion in eligible refunds. That converts a contestable, potentially recoverable levy into a durable cost input corporate planners must underwrite in 2027 budgets. US importers pay, so the incidence lands on domestic gross margins in import-reliant retail, autos and consumer hardware. The muted tape — the Dow rose 0.45% on the effective date — is itself informative: with near-universal coverage there is no clean equity short to express it, so it surfaces in margin guidance over subsequent quarters rather than on announcement day. The same-day lawsuit is the counterweight; if courts treat “absence of a foreign law” as materially different from documented IP theft, the refund ambiguity returns, which is worse for planning than a high but certain rate.
What to watch:Second-half gross-margin guidance from import-heavy retailers and consumer-hardware names for the first quantified pass-through estimates, and any motion for preliminary injunction at the Court of International Trade — an early injunction would suspend collection across all 60 economies at once.
UNCERTAIN
4. Memory Round-Trips an Entire Bull Thesis in Four Sessions, and a Seoul Print Does the Damage
The core facts:Tuesday, Micron surged 12% and SanDisk 14% after Morgan Stanley forecast rising memory prices on sustained AI demand, reinforced by strong South Korean AI-linked export data; the PHLX Semiconductor Index posted its best session in over a month at +5.2–5.4%, driving the Nasdaq 100 up 1.93% and lifting 9 of 11 sectors. Thursday, Micron rose again toward $1,000 — one of the few mega-cap gainers on the day Alphabet and Tesla cratered — as investors read raised hyperscaler capex as a direct demand signal for HBM3e, DRAM and NAND, with Nvidia’s Vera Rubin platform requiring HBM4 qualification and TrendForce forecasting a NAND shortage through 2026. Friday reversed it: an overnight KOSPI selloff drove SK Hynix down 6% in Seoul, and SanDisk fell 10.79% to become the day’s worst mega-cap decliner while Micron dropped 6.99% and a DRAM-focused ETF fell 7%. No US fundamental changed and neither company altered guidance. Micron still finished the week +8.48%, third among weekly gainers.
Why it matters:Memory has been the consensus “safe” way to own AI capex — you collect the spending without funding it, which is exactly the characteristic the market rewarded elsewhere this week. Four sessions demonstrated that the position is neither safe nor uncorrelated. A bullish thesis built on Morgan Stanley’s pricing call and Korean export data was unwound by a Korean equity move, which is the same input arriving with the opposite sign. The structural point is that US memory now trades as a high-beta expression of a Korea-anchored supply chain, so domestic portfolios carry overnight gap risk priced in Seoul before US markets open. That the week’s two largest single-session memory moves ran in opposite directions on identical fundamentals says conviction is far thinner than the demand narrative implies.
What to watch:Whether SK Hynix stabilises on the next Seoul session — continued decline converts a sympathy move into a genuine repricing of memory pricing assumptions rather than a positioning flush. Any SK Hynix HBM4 qualification update would reset the supply-chain read directly.
BEARISH
5. Twelve State Attorneys General Freeze a Federally Cleared $111 Billion Merger Until 2027
The core facts:Monday, US District Judge Araceli Martínez-Olguín granted a 14-day temporary restraining order barring Paramount Skydance from closing its acquisition of Warner Bros. Discovery, siding with a twelve-state coalition led by California AG Rob Bonta that sued July 13 alleging a Section 7 Clayton Act violation in uniting two of Hollywood’s five remaining major studios; the court found compelling evidence of substantial share in wide-release theatrical distribution. Paramount Skydance fell 1.1% and Warner Bros. Discovery 1.7%. By Friday afternoon the parties had filed an eleven-page joint stipulation agreeing not to close until five days after trial concludes or June 1, 2027, whichever is earlier. Trial is set for mid-2027. The transaction had already cleared US federal regulators and European authorities, and the DOJ declined to challenge it.
Why it matters:This is a structural repricing of deal risk, not a media story. The operative precedent is that federal antitrust clearance no longer terminates merger risk — state AGs have demonstrated they can independently impose a multi-year delay, which is frequently equivalent to a block once financing costs, employee attrition and business-plan drift are counted. For a market that has spent eighteen months underwriting an accommodative federal posture, with the DOJ suing to block just one deal since January 2025, this reintroduces a veto point that arbitrage spreads and large-cap M&A pipelines have not been discounting. Note how it rhymes with the tariff story: in both cases the substantive question was settled and the outcome still turned on which legal instrument and which forum applied.
What to watch:Whether merger-arbitrage spreads widen on other large pending deals with concentrated state-level exposure, and whether additional state coalitions file against transactions the federal agencies have already cleared — the Union Pacific–Norfolk Southern transcontinental merger is the nearest large test.
BEARISH
6. The Largest IPO in History Slips Below Its Offer Price, and the First Independent Analyst Marks It Lower Still
The core facts:SpaceX fell across three of the week’s five sessions — 3.33% Monday after a scrubbed Starship test, then 6.70% Wednesday to $115.26, extending a decline that had erased nearly all gains since its June 12 debut. The company priced 555 million shares at $135, the largest IPO ever completed by market value, and peaked near $202 on its third trading day; it now sits roughly 36% below that peak and below the offer price, with employee and early-investor lockups approaching expiry and no public earnings report yet filed. Friday, HSBC published the first tier-one Street coverage: Hold, $115 target, about 15% below the deal price.
Why it matters:The first major bank to publish on the largest IPO ever priced it below the deal, and did so with a Hold rather than a Sell — valuation discomfort without a thesis against the business. Because SPCX now anchors the post-IPO risk appetite that a substantial 2026 listing pipeline depends on, a below-offer initiation from a bank outside the underwriting syndicate carries disproportionate weight in how issuers and sponsors price subsequent deals. It also belongs to the same week-long argument as the capital-intensity repricing: a pre-profit, capital-hungry business valued entirely on future build-out is precisely the profile the market spent five sessions marking down, and here the marking came from a research desk rather than an earnings call. Jersey Mike’s filed Monday for a $7.94 billion listing into exactly this window.
What to watch:Whether syndicate banks initiate above or below HSBC when their research quiet periods expire, and whether SPCX holds $135 — a sustained break would mark the post-IPO cohort’s first major broken deal and reprice the pipeline behind it.
— Separating signal from noise since 2007. Apply for membership at join.recessionalert.comD. WEEK IN THE ECONOMY -> TOP
Fed-cut bets were re-priced — violently, and by an oil tanker rather than a data print. Polymarket’s 2026 hike contract jumped 21 points to 72% while ≥1-cut odds fell to 15.1%, and the curve confirmed it: the 2-year added 15.4 bps against the 10-year’s 13.0, a front-end-led flattening that ran Monday through Thursday. What removed the Fed’s escape routes was the data agreeing. Initial claims at 187,000 — the lowest since 1969 — killed the labour-market case for patience, and Friday’s flash composite PMI at an eight-month high of 53.6 killed the growth case, leaving a committee facing cost-push inflation from crude and a fresh 99.4%-coverage tariff floor with no soft data to hide behind. Wednesday’s FOMC decision and Warsh’s press conference, with no dot plot due, will resolve whether that pricing was prescient or a tantrum.
POLYMARKET ODDS — WEEK-ON-WEEK SHIFT:
| Market | Last Friday | This Friday | Δ |
|---|---|---|---|
| US Recession by end-2026 | 12% | 11% | −1 pp |
| Fed rate hike in 2026 | 51% | 72% | +21 pp |
| Fed rate cuts ≥1 in 2026 | 22% | 15.1% | −6.9 pp |
BEARISH
1. Hike Odds Go From Tail Risk to Live Possibility in Five Sessions (CME / Kalshi / Polymarket, Tue–Fri, Jul 21–24)
What they’re saying:Tuesday, CME FedWatch showed 83.4% odds of a hold at the 3.50–3.75% range on July 28–29 but roughly 47% odds of an outright hike sometime in 2026, with 2026 cut expectations collapsed to zero, following hawkish pre-blackout remarks from Cleveland’s Hammack, Dallas’s Logan and Vice Chair Jefferson. Wednesday, Deutsche Bank projected two further 25bp hikes before year-end and BofA three (September, October, December); a $16 billion 20-year auction drew a 2.46 bid-to-cover against a 2.58 ten-auction average, pushing the 20-year to 5.16%. Thursday, July hike odds reached 46.5% on CME and 36% on Kalshi, and the 10-year touched 4.7% intraday before settling at 4.696%, its highest since January 2025. Friday, fixed income held roughly one-in-three odds of a July hike while FactSet-polled economists still forecast a hold; Renaissance Macro’s Neil Dutta argued Governor Waller’s remarks show the Fed “is laying the groundwork for a hike as soon as the July FOMC meeting.” The ECB held at 2.25% Thursday with Lagarde flagging oil-driven upside risk to euro-zone inflation.
The context:The tradable feature is the gap between market pricing and economist consensus — a third of the rates market is positioned for an outcome professional forecasters still call unlikely, so a hold reprices dovishly and a hike reprices violently. What makes this repricing unusual is its source: it was driven by a supply-side oil shock rather than demand-side overheating, which puts Chair Warsh’s stated aversion to forward guidance under its first genuine geopolitical stress test, with no dot plot due to resolve the split. The market receipts run right through the tables above — the 2-year outpaced the 10-year every session Monday to Thursday, Polymarket’s hike contract added 21 points while cut odds shed 6.9, and mortgage rates rose a third straight week to 6.58% purely on the long end repricing hawkishly. Recession odds fell to 11%, so this is not a growth scare: the market is pricing tighter policy into a firm economy.
What to watch:The FOMC decision at 2:00pm and Warsh’s press conference at 2:30pm on Wednesday, July 29. With no Summary of Economic Projections, the statement language on inflation risks carries the entire signal.
UNCERTAIN
2. Initial Claims Fall to 187,000 — the Lowest Since 1969 (US Department of Labor, Thu Jul 23)
What they’re saying:Initial jobless claims fell 22,000 to 187,000 for the week ended July 18, the largest decline in three months, against a consensus of roughly 212,000–215,000 and the lowest reading since 1969. Continuing claims also beat, falling to 1.796 million versus 1.807 million expected. The 10-year yield rose more than a basis point on the release, extending Wednesday’s oil-driven climb, and the 2-year touched 4.36% intraday, its highest since late 2024. The print sits against a softer weekly signal from earlier in the week: ADP’s NER Pulse showed private employers adding an average of just 16,500 jobs per week for the four weeks ending July 4, down from 19,800 and a fourth consecutive week of deceleration.
The context:A near-sixty-year low in claims is unambiguously good news for households and unambiguously unhelpful for anyone hoping the Fed looks past the oil shock. A weak claims print would have supplied the growth alibi for patience; this one removes it, and the market read it that way within minutes. The tension worth holding is that claims measure separations while ADP measures hiring, and the two are pointing in opposite directions — almost nobody is being fired, but fewer people are being hired each week. That is a low-hiring, low-firing equilibrium, which produces a tight headline number without the wage acceleration that would normally accompany it. For the Fed it is the worst configuration to argue against a hike, because the visible indicator is the strong one.
What to watch:Tuesday July 28’s weekly ADP employment change (prior 16.5K) for whether the hiring deceleration extends to a fifth week, and next month’s non-farm payrolls for confirmation that tightness is broadening beyond initial claims.
UNCERTAIN
3. Flash Composite PMI Jumps to an Eight-Month High of 53.6 — but Factory Output Hits a Four-Month Low (S&P Global, Fri Jul 24)
What they’re saying:The S&P Global flash US Composite PMI rose to 53.6 in July from 51.9 in June, well ahead of the 52.2 consensus and the strongest reading in eight months. Services led at 53.6 against 51.5 expected, while manufacturing held roughly flat at 53.8 versus 54.3 expected and 53.9 prior. S&P Global said the survey is consistent with GDP growing at a 2.0% annualised rate in Q3, against the 1.2% pace its data signalled for Q2. The Manufacturing Output Index, however, fell to 53.6 from 56.2, a four-month low. Earlier in the week the Conference Board’s Leading Economic Index slipped 0.2% in June to 99.1 on weak consumer expectations and building permits, even as the Board raised its full-year 2026 GDP forecast to 1.9% from 1.8%, citing AI-related business investment; the Chicago Fed National Activity Index improved to −0.02 from a revised −0.19 but stayed below trend.
The context:A composite print more than a point above consensus is a genuine upside surprise and argues against the soft-patch narrative that dominated Q2. But the internals are not clean: the acceleration is entirely services-driven while the goods economy loses momentum, which is the same split the LEI showed — permits and consumer expectations weak, AI capex carrying the growth forecast. For policy the timing is what matters. An economy re-accelerating into a fresh tariff round removes the growth argument for waiting, and it landed on the final session before the blackout ended. Note also that the survey’s strength is concentrated in exactly the part of the economy least exposed to a 10–12.5% import duty, which means the composite may be flattering the underlying picture heading into pass-through.
What to watch:Durable goods orders for June on Monday, July 27 — consensus looks for +0.9% ex-transport against +1.3% prior, with the headline series coming off a −4.5% print. A second weak factory reading would confirm the manufacturing divergence the output index is flagging.
BEARISH
4. Builders Cut the Median New-Home Price Below $400,000 as Mortgage Rates Rise a Third Straight Week (Census Bureau / Freddie Mac, Thu–Fri Jul 23–24)
What they’re saying:New single-family home sales ran at a seasonally adjusted annual rate of 628,000 in June, above the 610,000 consensus and 1.6% above May — but 5.6% below June 2025’s 665,000 pace. The median sales price fell to $398,300, down 3.3% from May’s $412,000 and 2.7% below a year ago; inventory eased to 485,000 units with months of supply at 9.3, down only marginally from 9.4. Separately, Freddie Mac’s 30-year fixed rate rose to 6.58% from 6.55%, a third consecutive weekly increase leaving it near its high for the year, with the 15-year at 5.96%. Mid-week, MBA data showed purchase applications up 6% for the week ended July 17 even as the conforming 30-year rate climbed to 6.69%, which chief economist Mike Fratantoni attributed to growing inventory rather than affordability.
The context:The consensus beat is the least informative part of the release. Months of supply at 9.3 is roughly double the level historically considered balanced, and builders are clearing that inventory by cutting price — a median below $400,000 for the first time this cycle is margin compression, not demand recovery. The direction of rates matters more than their level here, and the direction is being set by the repricing in the box above: mortgage rates are climbing because the long end is repricing hawkishly into the FOMC, not because growth expectations improved. That makes it a pure tightening of household financial conditions arriving precisely as builders discount, eroding whatever affordability the price cuts bought. Falling new-home prices are disinflationary for shelter with a long lag, which is cold comfort to a committee deciding this Wednesday.
What to watch:S&P/Case-Shiller and FHFA house price indices for May on Tuesday, July 28 — Case-Shiller’s prior year-over-year print was 1.1%, and a move toward zero would confirm price weakness has spread from new builds into the existing-home market. MBA applications land Wednesday, hours before the Fed decision.
UNCERTAIN
5. Corporate Bankruptcies Hit a 16-Year High While Credit Spreads Refuse to Move (S&P Global, Mon Jul 20)
What they’re saying:Large-company Chapter 11 filings reached 372 in the first half of 2026, the highest first-half total in sixteen years and the fourth consecutive annual increase. Industrials led with 50 filings, followed by consumer discretionary at 35 and healthcare at 26. Small-business filings jumped 50% year over year to 1,663. Credit spreads and bond markets have stayed calm throughout — a divergence from prior bankruptcy waves, when rising filings typically coincided with spread widening.
The context:Investors are treating this distress as idiosyncratic and sector-specific rather than systemic, and the sector composition supports that reading — industrials and consumer discretionary are precisely where tariff costs and high financing rates bite first, not where a broad credit cycle turns. The reason it belongs in this week’s macro picture is the interaction with everything above: filings are running at a sixteen-year high before a 10–12.5% duty landed on 99.4% of imports and before the front end priced a hike, and the two sectors leading the filings are the two whose input costs the tariff most directly raises. Recession odds fell to 11% on Polymarket this week, so the market plainly does not see a cycle turning — but the calm in spreads is an assumption being tested rather than a conclusion already reached, and the 50% jump in small-business filings is the part of the distress that never shows up in an index.
What to watch:High-yield credit spreads for any sign of contagion, and the Q3 filing pace in industrials and consumer discretionary once the first quarter of Section 301 duties has been paid.
— Know the probability before the market prices in the risk. Apply for membership at join.recessionalert.comE. WEEK IN EARNINGS -> TOP
TOP EARNINGS OF THE WEEK
UNCERTAIN
1. Intel (INTC): −7.89% Friday | A 100% EPS Surprise and a 20-Point Round Trip on One Line of the Cash Flow Statement
The Numbers:Released AMC July 23. Revenue $16.13B versus $14.42B expected, up 25% year over year — the strongest growth in more than fifteen years and $1.8B above management’s own guidance midpoint. Non-GAAP EPS $0.42 against $0.21 expected; operating income $1.796B versus $1.58B. Non-GAAP gross margin 41.8%, 280 bps above forecast against a 39% target. Data Center and AI revenue +59% to $6.3B; Intel Foundry +31% to $5.8B. Q3 guidance raised to $15.8–16.8B revenue versus $15.10B consensus, EPS $0.38. Capital spending for 2026 lifted above $20B from roughly $15B, with 2027 to rise meaningfully and tooling up 40% versus 2025.
The Problem/Win:The operating detail underneath the headline is what makes the reaction remarkable. 18A process yields climbed to approximately 85% from 65% the prior quarter, output exceeded internal targets by about 25% and rose more than 50% sequentially, and the company recognised its first commercial external 18A customer — a major cloud service provider, unnamed. CEO Lip-Bu Tan cited growing confidence in 14A ahead of risk production in 2027. Every operating metric a foundry turnaround is measured on improved simultaneously. The market instead solved for one variable: spending above $20B, rising again in 2027, against still-limited disclosed external demand. Shares jumped 12–13% within minutes of the print and closed the following session at $92.32, a swing of roughly 20 percentage points on entirely unchanged fundamentals.
The Ripple:The reversal organised Friday’s entire session. A gauge of semiconductor firms fell 4.4%, Technology was the only S&P sector down more than 1% at −1.46%, and the damage crossed sub-sectors that share nothing but capital intensity: Applied Materials −4.72% and Lam Research −4.56% in equipment, SanDisk −10.79% and Micron −6.99% in memory. Technology nonetheless finished the week at +0.06%, and eight of eleven sectors closed green — the contagion was real but sealed inside the complex.
What It Means:Intel’s turnaround thesis is intact on the operating numbers; the financing of that turnaround has been repriced. The yield data is the strongest evidence in years that the process roadmap is working, and it bought the stock nothing, because the market is now discounting AI-linked capital expenditure at a materially higher rate than the revenue it produces.
What to watch:Announcements of named external 18A or 14A foundry customers — the single disclosure that converts the capex raise from an unfunded commitment into a contracted one, and the only thing likely to reverse the multiple.
BEARISH
2. Tesla (TSLA): −17.81% on the week | Record Revenue, a 1.4% Operating Margin, and a Tripling of Capex
The Numbers:Released AMC July 22. Revenue $28.24B, up 25.5% year over year and a record, beating estimates. Non-GAAP EPS $0.33 against a $0.54 consensus, a 38.9% miss. Operating margin fell to 1.4%. Free cash flow turned negative $1.09B. Q2 deliveries had already been reported at a record 480,126 units, up 25% and more than 74,000 above consensus, with prediction markets pricing a 74% probability of an EPS beat into the print. Musk guided 2026 capital spending above $25B for AI, robotaxi and Optimus — nearly triple 2025’s $8.53B.
The Problem/Win:Record deliveries and record revenue converting to a 1.4% operating margin is the entire story, and it is an arithmetic problem rather than a demand problem. The 25% delivery growth that was supposed to be the bull case arrived alongside margin compression severe enough to leave almost nothing at the operating line, and then the capex guidance told investors the drag extends for years rather than quarters. Negative free cash flow at a company generating $28B of quarterly revenue is the datapoint that reframes the AI and robotics pivot from optionality into obligation. The delivery beat, reported weeks earlier, had already been banked into the price — there was no cushion left when the margin line landed.
The Ripple:The 14.52% Thursday decline was Tesla’s worst single session in roughly a year and the largest single contributor to the Nasdaq 100’s 1.87% underperformance against the Dow that day. Consumer Cyclical closed −4.55% Thursday and −5.43% on the week, second-worst of eleven sectors, and is now negative on every horizon out to six months (−12.06%). Tesla’s −17.81% made it the week’s worst mega-cap decliner by a margin of more than eight points.
What It Means:The market is pricing the AI and robotics pivot as a multi-year cash drag before it is a profit driver, and it is now doing so with a number attached: $25B a year against a business generating negative free cash flow. Near-term margin recovery, not robotaxi timing, is the debate that determines the equity from here.
What to watch:Q3 commentary on capex pacing — specifically whether the $25B is front- or back-loaded — and any restatement of the Optimus and robotaxi production timeline that would put a revenue date against the spending.
BULLISH
3. RTX (RTX): +9.96% on the week | A Beat-and-Raise Across All Three Segments and a Record $289 Billion Backlog
The Numbers:Released BMO July 23. Sales $24.7B, up 14% year over year and 16% organically, an 8.2% surprise. Adjusted EPS $1.89 against $1.66 expected, a 13.9% surprise and up 21.1% year over year. Segment detail: Raytheon +18% to $8.3B, Pratt & Whitney +16% to $8.89B, Collins Aerospace +8% to $8.21B. Free cash flow $2.9B. Total backlog a record $289B, split $170B commercial and $119B defense. Full-year guidance raised across all three headline measures: sales to $95.0–96.0B, EPS to $7.10–7.25, free cash flow to $8.50–8.75B.
The Problem/Win:Raytheon segment bookings of $19.9B produced a book-to-bill of 2.42 — the company sold nearly two and a half dollars of future work for every dollar recognised — lifting that segment’s own backlog to $86B with international demand now 48% of it, up four points year over year. Margins expanded 100 bps in the same segment, so the growth is not being bought. Demand was broad rather than programme-specific: Patriot, Standard Missile and AMRAAM restocking on the defence side, commercial aerospace aftermarket up 25% and military engine demand on the other. Governments are rebuilding missile inventories depleted by the Ukraine and Middle East conflicts, and that is a multi-year replenishment cycle rather than a quarter.
The Ripple:Lockheed Martin gained 10.54% the same session on its own record $230.4B backlog and raised guidance, including a $35B multi-year THAAD award — two of the day’s largest mega-cap gains coming from the same sector on the same thesis is what separates a sector cycle from two good quarters. Industrials closed +1.52% Thursday against an S&P down 1.21%, and finished the week green at +0.60%. RTX ranked second among all weekly mega-cap gainers.
What It Means:A record backlog with a 2.42 book-to-bill and expanding margins is the cleanest visibility available in this market, and it was earned in the same week that capital-intensive AI names were punished for spending against uncontracted demand. Defence backlog is contracted demand with a government counterparty — the precise inverse of the risk the market repriced elsewhere, which is why both trades worked simultaneously.
What to watch:Continued international order flow, now approaching half of Raytheon’s backlog, and whether Pratt & Whitney’s commercial aftermarket strength persists into Q3 — the aftermarket is the higher-margin half of the commercial story.
WEEK AHEAD PREVIEW:
Q2 2026 earnings season moves into its heaviest stretch next week, with roughly 10% of the S&P 500 reported so far and three of the four largest hyperscalers due within 48 hours of the July 28-29 FOMC decision.
Welltower (WELL) — AMC, Monday July 27 — Consensus FFO $1.55, implying 21.1% year-over-year growth; the company has beaten FFO estimates in each of the last four quarters. Key focus: senior housing occupancy, which reached roughly 89% in Q1 on a 370 bps improvement, same-store NOI against blended guidance of 12.25%-16.00%, and whether management raises full-year normalised FFO guidance again while holding the payout ratio under 50%.
Microsoft (MSFT) — Wednesday July 29 — The single most consequential print of the week after this session’s repricing of AI capital spending. Key focus: fiscal 2027 capex guidance and Azure constant-currency growth. With Intel down 7.89% and Alphabet down 7.13% earlier in the week on capex disclosures, the market has established that an open-ended spending plan will be punished regardless of the revenue attached to it.
Meta Platforms (META) — Wednesday July 29 — Reports the same day as Microsoft, into a seventh consecutive losing session. Key focus: 2026 and preliminary 2027 capital expenditure guidance, AI infrastructure commitments including the reported Oracle cloud agreement, and whether management frames spending against a defined return horizon rather than an open-ended build.
Apple (AAPL) — Thursday July 30 — +3.53% today to $333.02, near a record, with Morgan Stanley lifting its target to $364 on July 23. Key focus: whether Apple’s asset-light approach to AI holds — the entire basis of this week’s bid — plus iPhone unit trends and any commentary on Section 301 tariff exposure across its import-reliant hardware supply chain.
Amazon (AMZN) — Wednesday or Thursday, July 29-30 (exact day not confirmed) — Completes the hyperscaler sequence. Key focus: AWS growth reacceleration and the capex line, which faces the same scrutiny now being applied across the complex.
The FOMC decision on Wednesday July 29 lands between the Microsoft/Meta and Apple reports, compressing policy risk and mega-cap earnings risk into a single 48-hour window.
— US market commentary trusted by family offices and institutions. Apply for membership at join.recessionalert.comF. NEXT WEEK SETUP -> TOP
UPCOMING RELEASES:
| Date | Event | Why It Matters |
|---|---|---|
| Mon, Jul 27 | Durable Goods Orders MoM (Jun, prior −4.5%) — HIGH | The first read on whether the goods economy is cracking as the flash PMI’s manufacturing output index suggested; coming off a −4.5% print. |
| Mon, Jul 27 | Durable Goods Ex Transport MoM (Jun, expected 0.9%, prior 1.3%) | The cleaner core signal, stripping out lumpy aircraft orders — a miss would confirm manufacturing divergence from services. |
| Mon, Jul 27 | Durable Goods Ex Defense MoM (Jun, prior −4.6%) | Isolates civilian demand from the defence order surge visible in this week’s RTX and Lockheed backlogs. |
| Mon, Jul 27 | Dallas Fed Manufacturing Index (Jul, prior 0) | Regional factory read from an energy-heavy district, useful for whether high crude is helping or hurting the industrial base. |
| Tue, Jul 28 | ADP Employment Change Weekly (prior 16.5K) | Whether the hiring deceleration extends to a fifth straight week, against claims at a 1969 low. |
| Tue, Jul 28 | Goods Trade Balance Adv (Jun, prior −$105.9B) | The last pre-tariff baseline before Section 301 duties begin distorting import volumes and pricing. |
| Tue, Jul 28 | Retail Inventories Ex Autos MoM Adv (Jun, prior 0.3%) | A build would suggest retailers front-ran the tariff deadline; a draw suggests they did not and margins absorb the cost. |
| Tue, Jul 28 | Wholesale Inventories MoM Adv (Jun, prior 0.1%) | Same read one step up the chain, and a direct input to Q3 GDP tracking. |
| Tue, Jul 28 | CB Consumer Confidence (Jul, prior 91.2) | The first sentiment read capturing both $4 gasoline and the tariff announcement; consumer expectations already dragged the LEI lower. |
| Tue, Jul 28 | API Crude Oil Stock Change (Jul 25, prior 2.603M) | Whether a second consecutive build validates the paper market’s de-escalation pricing or the physical deficit thesis wins. |
| Wed, Jul 29 | Fed Interest Rate Decision (expected 3.75%, prior 3.75%) — HIGH | The week’s defining event. A third of the rates market is positioned for a hike economists still call unlikely — a hold reprices dovishly, a hike reprices violently. |
| Wed, Jul 29 | Fed Press Conference (2:30 PM) — HIGH | With no dot plot due, Warsh’s statement language on inflation risk carries the entire forward signal. |
| Wed, Jul 29 | MBA 30-Year Mortgage Rate (Jul 25, prior 6.69%) | Released hours before the decision; a fourth consecutive increase would confirm household financial conditions tightening ahead of the Fed. |
| Wed, Jul 29 | EIA Crude Oil Stocks Change (Jul 25, prior 2.011M) | The official confirmation of the API print, and the cleanest available evidence of whether Hormuz disruption is reaching US inventories. |
| Wed, Jul 29 | EIA Gasoline Stocks Change (Jul 25, prior 0.765M) | Pump prices crossed $4 this week; gasoline stocks determine whether that pass-through continues into August CPI. |
WHAT TO WATCH NEXT WEEK:
1. Does Wednesday’s FOMC validate a rates market that moved 21 points on an oil tanker? Polymarket’s hike contract went from 51% to 72% on a supply shock, not on demand data, and economists polled by FactSet still expect a hold. With no dot plot and a Chair who has said he will give less forward guidance, the statement’s inflation-risk language is the only resolution available — and it arrives with positioning lopsided in one direction.
2. Do Microsoft and Meta get the Intel treatment, or was the capex punishment a three-session overshoot? Three companies were sold this week for raising capital spending, two of them on genuinely strong quarters. Meta has already fallen seven consecutive sessions without reporting anything. If Wednesday’s prints draw the same reaction, this is a durable change in how AI spending is valued; if a credible return horizon earns a pass, the week reads as an overreaction and Apple’s asset-light premium compresses.
3. Which oil market is right — the paper one or the physical one? Futures fell 2.50% Friday on a Pakistan-brokered diplomatic feeler that has produced no meeting, while physical cargoes reportedly changed hands near $110 and Kpler counted a single tanker crossing Hormuz on Thursday. Tuesday’s API and Wednesday’s EIA inventory prints are the first hard evidence either way, and they land on FOMC day.
4. Does the breadth that held all week survive a hawkish surprise? The NYSE Composite rose 0.73% while the Nasdaq 100 fell 1.62%, and eight of eleven sectors closed green — the damage was concentrated, not systemic. But the small-cap Russell fell 0.98% as the 2-year added 15.4 bps, and floating-rate borrowers are the first casualty of a genuine hike. A tightening surprise would test whether the rotation is rotation or merely a slower exit.
5. When does the tariff floor start showing up in guidance rather than in headlines? Section 301 duties now cover 99.4% of imports and US importers pay them, so the incidence lands on domestic gross margins. Tuesday’s advance goods trade balance and retail inventories are the last clean pre-tariff baseline, and Apple’s Thursday call is the first mega-cap opportunity to quantify exposure on an import-reliant hardware supply chain.
— US market commentary trusted by family offices and institutions. Apply for membership at join.recessionalert.comG. CHART OF THE WEEK -> TOP
WHY THIS CHARTFour of the week’s five charts describe the AI capital cycle; this one was published the day before the market started punishing it, and named the exact mechanism — obligations that are binding today but recognised later — that Alphabet, Tesla and Intel were each sold for over the following three sessions. The other candidates measure the boom’s size or its consequences; only this one told you where the leverage was hiding before the repricing began, and its named example, Oracle, went on to finish the week down 9.03% as one of the five worst mega-caps.
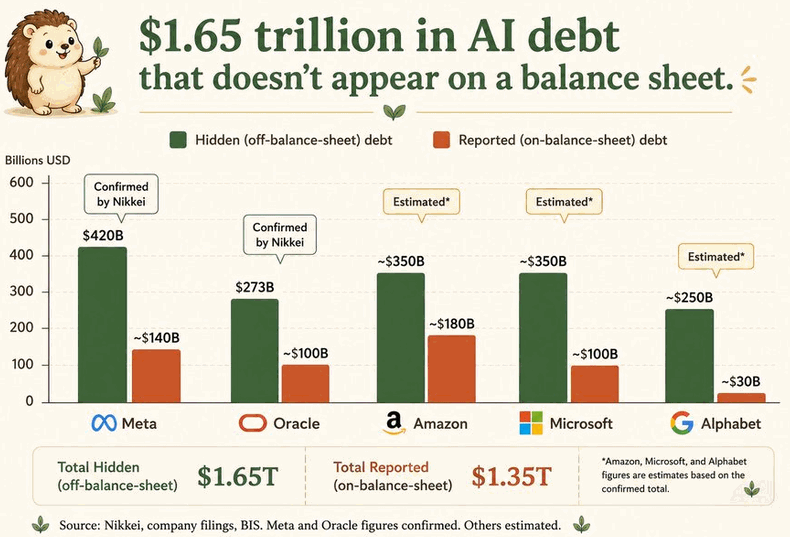
ORIGINAL CHART ANALYSIS — FROM TUESDAY’S MIBNothing on the green side of this chart is hidden — it is scheduled. Every dollar sits in a footnote, non-cancellable and binding today; what has been deferred is the recognition, not the obligation. Under lease accounting the liability books at commencement, when the lessor hands over the asset, so a fifteen-year lease on a data centre still under construction sits in disclosure as not yet commenced, and GPU orders stay executory until delivery. Morgan Stanley counts more than $800B of these pre-operational leases industry-wide; the trigger is a construction milestone, not a market event. But the paper runs five to twenty years against silicon with an 18-to-36-month competitive life, and you cannot refinance out of a non-cancellable lease when the chip generation turns — leverage is computed on the term of the debt, never the half-life of what it financed. Oracle carries that mismatch concentrated into one credit: ~$273B off the books, more than thirty times its level four years ago, resting on essentially one private, pre-profit counterparty, with S&P already holding it at the lowest investment-grade rung. And the terminal holder sits outside the tech complex entirely: placed privately, the paper lands in insurance general accounts and pension allocations — equity risk on a chip cycle, wearing the coupon of an annuity. Alphabet reports tomorrow: read the commencement note, not the debt line. This debt will not appear when risk rises — it appears when the concrete cures.
MIB Weekly Digest Ver. 1.74
For professional investors only. Not investment advice.
© 2026 RecessionALERT.com

Comments are closed.