
MARKET INTELLIGENCE BRIEF (MIB)
Friday, July 24, 2026
Section 301 forced-labor tariffs of 10-12.5% hit 60 economies covering 99.4% of US imports — a durable levy replacing the struck-down IEEPA regime. An AI capex scare gutted chips: Intel -7.89% after a blowout quarter, SanDisk -10.79%, Micron -6.99%. Apple +3.53% and IBM +3.65% won the rotation. Crude reversed hard, Brent -2.50% to $98, on a China-brokered Iran overture. July PMI hit an eight-month high of 53.6. A third of the rates market now prices a Wednesday hike.
TABLE OF CONTENTS
A. EXECUTIVE SUMMARY
B. MARKET DATA
C. HIGH-IMPACT STORIES (5)
D. MODERATE-IMPACT STORIES (7)
E. ECONOMY WATCH (5)
F. EARNINGS WATCH (5)
G. WHAT’S NEXT
H. CHART OF THE DAY
A. EXECUTIVE SUMMARY -> TOP
Equities split along a single fault line: the Dow gained 0.45% and the S&P 500 closed flat at +0.05% while the Nasdaq 100 fell 1.15%, as a 4.4% semiconductor collapse met a 2.50% drop in Brent to $98.17 on a China-brokered push to restart US-Iran talks — and a new 10-12.5% tariff floor across 99.4% of US imports drew no tape reaction at all. The rotation is a repricing of AI capital intensity, not AI demand — Intel was sold 7.89% on a blowout quarter because it lifted 2026 capex above $20 billion — while asset-light Apple rose 3.53% and IBM 3.65%. Beneath the tech damage the tape was constructive: seven of eleven sectors closed green, VIX eased to 18.57, and both the 2Y and 10Y slipped roughly 2 bps, reading cheaper crude as disinflationary, not as growth damage. Real Estate led at +2.08% while Utilities closed red — a rate-relief story only half-believed, better read as capital seeking a defensive home outside semis.
• Section 301 forced-labor duties of 10% and 12.5% took effect at 12:01am ET across 60 economies covering 99.4% of US imports, replacing the expired Section 122 stopgap; the Liberty Justice Center sued to strike them down hours later.
• Semiconductors fell 4.4% — Intel -7.89%, SanDisk -10.79%, Micron -6.99%, with Technology -1.46% the only sector down more than 1%; a 6% SK Hynix drop in Seoul transmitted straight into US memory names.
• Brent fell 2.50% to $98.17 and WTI 1.91% to $90.43 on a China-initiated Pakistani channel to restart US-Iran talks, but both still finished the week up 8-10% and Trump signalled he is close to deciding on a “massive attack.”
• Flash composite PMI jumped to an eight-month high of 53.6 versus 52.2 expected, consistent with 2.0% Q3 growth, while new-home median prices fell 3.3% to $398,300 and mortgage rates rose a third straight week to 6.58%; the rates market now prices roughly one-in-three odds of a Wednesday hike.
• Earnings: Intel’s beat included 59% year-over-year data-centre and AI revenue growth and the stock was sold anyway; Verizon, American Express and NextEra Energy reported before the bell.
• Paramount Skydance agreed to freeze its $111 billion Warner Bros. Discovery takeover until June 2027 after twelve state attorneys general sued — federal and EU clearance no longer terminate deal risk.
1. Capital intensity is now the discount factor applied to AI — hyperscalers failed the test Thursday, a foundry failed it Friday, and the verdict is identical: beating revenue no longer earns a pass if the spending behind it looks open-ended. This is a multiple compression across capex-heavy semis and hyperscalers, not a change in AI demand, which is why Apple and IBM caught the rotation on the same tape. Microsoft and Meta on Wednesday and Apple on Thursday determine whether this is a regime change or a two-session overshoot.
2. The tariff regime traded contestability for durability — Section 301 has survived judicial review where the IEEPA levy did not, converting a potentially refundable charge into a cost input that has to be underwritten in 2027 budgets. US importers pay it, so the incidence lands on domestic gross margins in import-reliant retail, autos and consumer hardware, and will surface in guidance rather than on the tape. Friday’s separate 301 threat against the EU over its Alphabet fine shows the statute is now a general-purpose retaliation tool, linking every future Brussels enforcement action to US trade policy.
3. Wednesday’s FOMC inherits a stagflationary brief with the market and the forecasters split — the PMI beat removes the growth alibi for patience, the new tariff floor adds cost-push, and housing keeps deteriorating, yet economists still expect a hold against roughly one-third of the rates market positioned for a hike. That asymmetry means a hold reprices dovishly and a hike reprices violently. The fragile input is crude: today’s decline is what let bonds read the session as disinflationary, but physical cargoes are reported near $110 against paper at $98 with Hormuz transit collapsed to a single tanker, and a physical-led reversal would remove that support with no diplomatic offset.
 — Leading economic indicators. Accurate market forecasts. Apply for membership at join.recessionalert.com
B. MARKET DATA -> TOP
Two shocks pulled in opposite directions and the tape split down the middle: crude collapsed on reports that Pakistan, backed by China, is brokering renewed US-Iran talks, while a Seoul-led memory rout and Intel’s capital-spending guidance turned AI investment from a growth story into a cost problem. The result was blue-chip strength against a narrow but violent growth selloff — the Dow higher, the Nasdaq 100 down more than 1%, and the S&P 500 pinned within four points of unchanged. The defining divergence was Intel: a 25% revenue beat that had the stock up double digits after Thursday’s bell reversed into a 7.89% loss once management lifted 2026 capex to $20 billion. Investors are no longer paying for AI revenue growth that arrives with a capital bill attached.
CLOSING PRICES – Friday, July 24, 2026:
MAJOR INDICES
The Dow’s 235-point gain against a 1.15% Nasdaq 100 decline is the widest blue-chip/growth split of the month — capital rotating out of AI capex exposure, not leaving equities. The NYSE Composite outpacing the S&P 500 confirms breadth beneath the mega-cap tech damage. Dow Theory bull confirmation holds for a fourth session, with both industrials and transports inside 2% of their 10-session highs. Over that same window the S&P has outperformed the Nasdaq 100 by 3.5 points — a broadening rotation now in its second session.
| Index | Close | Change | %Move | Why It Moved |
|---|---|---|---|---|
| S&P 500 | 7,411.96 | +3.66 | +0.05% | Offsetting forces cancelled out — energy-driven blue-chip strength against a semiconductor rout. |
| Dow Jones | 51,946.51 | +234.86 | +0.45% | Falling crude and rotation into low-capex, value-oriented mega-caps; IBM and Home Depot led. |
| DJ Transportation | 22,476.20 | -102.40 | -0.45% | Declined even as fuel input costs fell, leaving transports at odds with the Dow’s advance. |
| Nasdaq 100 | 28,128.34 | -326.47 | -1.15% | Semiconductor complex sold off hard on AI capital-spending concerns; a chip gauge fell 4.4%. |
| Russell 2000 | 2,932.03 | -8.13 | -0.28% | Small caps closed lower, diverging from the Dow’s advance despite the drop in energy costs. |
| NYSE Composite | 23,990.88 | +116.61 | +0.49% | Broad-market gauge outperformed the S&P 500, reflecting gains outside the mega-cap tech complex. |
VOLATILITY & TREASURIES
VIX slipping to 18.57 while the Nasdaq 100 shed more than 1% is the session’s cleanest tell: this was rotation, not fear. Both the 2Y and 10Y eased roughly 2 bps, leaving the 2s10s spread unchanged at 34 bps — bonds read the crude collapse as disinflationary rather than as growth damage. The dollar’s flat close removes any safe-haven interpretation.
| Instrument | Level | Change | Why It Moved |
|---|---|---|---|
| VIX | 18.57 | -0.13 (-0.70%) | Eased despite the Nasdaq decline — the selloff was concentrated in one sector, not a broad risk event. |
| 10-Year Treasury Yield | 4.681% | -2.2 bps | Slipped as the reversal in crude eased near-term inflation pressure. |
| 2-Year Treasury Yield | 4.337% | -2.3 bps | Fell alongside the 10Y, leaving the 2s10s spread essentially unchanged at 34 bps. |
| US Dollar Index (DXY) | 101.49 | +0.04 (+0.04%) | Effectively flat; no safe-haven demand emerged despite the technology selloff. |
COMMODITIES
Silver’s 0.76% gain outpacing gold’s 0.15% while copper slipped fractionally splits the metals complex along the precious/industrial axis — safe-haven bid present, growth signal absent. Platinum’s 0.62% decline breaks from the other precious metals entirely. Bitcoin’s 1.42% drop tracked the Nasdaq rather than the broad tape, reinforcing that crypto still trades as a leveraged proxy for the same AI-growth complex now under pressure.
| Asset | Price | Change | %Move | Why It Moved |
|---|---|---|---|---|
| Gold | $4,056.12/oz | $+5.92 | +0.15% | Modest gain; held its bid as Treasury yields eased. |
| Silver | $58.493/oz | $+0.438 | +0.76% | Outpaced gold, leading the precious complex higher on the move lower in yields. |
| Copper | $6.3375/lb | $-0.0060 | -0.09% | Little changed; industrial demand signals stayed neutral through the session. |
| Platinum | $1,598.85/oz | $-9.95 | -0.62% | Declined, splitting from gold and silver despite the softer yield backdrop. |
| Bitcoin | $64,258.00 | $-926.00 | -1.42% | Fell with the Nasdaq 100, trading as a high-beta proxy for the AI-growth complex. |
ENERGY
Brent’s 2.50% drop outrunning WTI’s 1.91% compressed the transatlantic spread to $7.74 from $8.26 — the de-escalation premium bleeding out of the seaborne barrel first, exactly reversing how it was priced in. Crude falling while the Dow rallied is the constructive configuration: lower input costs, not weaker demand. Dutch TTF rising 2.36% against that backdrop confirms Europe’s gas problem is structural rather than tied to the Gulf headline.
| Asset | Price | Change | %Move | Why It Moved |
|---|---|---|---|---|
| Crude Oil (WTI) | $90.43/bbl | $-1.76 | -1.91% | Dropped on reports that Pakistan, with Chinese backing, is seeking to restart US-Iran talks. |
| Crude Oil (Brent) | $98.17/bbl | $-2.52 | -2.50% | Fell further than WTI as the geopolitical risk premium unwound from seaborne barrels first. |
| Natural Gas (Henry Hub) | $2.884/MMBtu | $-0.032 | -1.10% | Eased modestly, largely unmoved by the crude story. |
| Natural Gas (Dutch TTF) | $21.13/MMBtu | $+0.49 | +2.36% | Rose on European supply dynamics, decoupling entirely from the crude selloff. |
S&P 500 SECTORS
Real Estate’s 2.08% jump led on falling yields, yet Utilities closed red — a rate story only half-believed. Technology’s 1.46% loss is a single-session capex shock rather than a trend break: the sector still holds +8.75% over three months and +16.94% over six. The genuine structural laggard is Consumer Cyclical, down 12.06% over six months and 9.56% year-to-date, unhelped by today’s marginal tick higher.
| Sector | 1-Day | 1-Week | 1-Month | 3-Month | 6-Month | YTD | 12-Month |
|---|---|---|---|---|---|---|---|
| Real Estate | +2.08% | +0.53% | +3.41% | +5.33% | +10.64% | +13.35% | +8.45% |
| Consumer Defensive | +0.99% | -1.57% | -1.60% | -1.93% | +0.81% | +6.54% | +4.26% |
| Financial | +0.83% | +0.03% | +4.56% | +9.50% | +5.71% | +6.00% | +12.36% |
| Communication Services | +0.45% | -5.82% | -3.02% | -7.59% | -5.93% | -5.43% | +11.39% |
| Healthcare | +0.42% | +0.26% | +4.58% | +9.58% | +1.98% | +5.15% | +19.28% |
| Basic Materials | +0.26% | +2.23% | -0.69% | -7.79% | -6.18% | +7.68% | +25.45% |
| Consumer Cyclical | +0.15% | -5.43% | -3.22% | -7.22% | -12.06% | -9.56% | -5.44% |
| Energy | -0.04% | +3.49% | +11.27% | +2.24% | +22.85% | +32.59% | +37.06% |
| Industrials | -0.21% | +0.60% | -3.69% | -1.34% | +4.07% | +13.04% | +15.27% |
| Utilities | -0.21% | +1.71% | +0.82% | -2.34% | +5.76% | +7.57% | +11.62% |
| Technology | -1.46% | +0.06% | -2.20% | +8.75% | +16.94% | +16.68% | +27.07% |
TOP MEGA-CAP MOVERS:
GAINERS
| Company | Ticker | Close | Change | Why It Moved |
|---|---|---|---|---|
| International Business Machines Corp | IBM | $214.19 | +3.65% | Continued its post-Q2 advance (reported July 22, revenue $17.16B, adjusted EPS $2.93); a low-capex software model drew buyers as AI spending fears spread. |
| Apple Inc | AAPL | $333.02 | +3.53% | Neared a record high as investors sought AI exposure without heavy capital spending; Morgan Stanley raised its target to $364 ahead of July 30 results. |
| Home Depot Inc | HD | $332.98 | +2.55% | Rose with the rate-sensitive complex as Treasury yields eased across the curve. |
| Mastercard Incorporated | MA | $539.66 | +1.77% | Advanced with Financials, the third-best sector on the day at +0.83%. |
| Netflix Inc | NFLX | $70.09 | +1.74% | Gained as Communication Services stabilised (+0.45%) following the sector’s 5.82% weekly decline. |
DECLINERS
| Company | Ticker | Close | Change | Why It Moved |
|---|---|---|---|---|
| Sandisk Corp | SNDK | $1,436.56 | -10.79% | Led the decliners as an overnight KOSPI memory selloff in Seoul hit US NAND and DRAM names; the DRAM ETF fell 7%. |
| Intel Corp | INTC | $92.32 | -7.89% | Reversed a double-digit after-hours pop from Thursday’s beat after management lifted 2026 capex to $20B from roughly $15B; external foundry demand remains limited. |
| Micron Technology Inc | MU | $920.95 | -6.99% | Fell in sympathy with SK Hynix, which dropped 6% in Seoul, despite no change to its own fundamentals. |
| Applied Materials Inc | AMAT | $536.25 | -4.72% | Chip-equipment names sold off as investors began scrutinising rather than rewarding AI capital spending. |
| Lam Research Corp | LRCX | $305.21 | -4.56% | Declined with the broader semiconductor equipment complex; a chip gauge fell 4.4% on the session. |
— Institutional-grade intelligence for serious investors. Apply for membership at join.recessionalert.comC. HIGH-IMPACT STORIES -> TOP
UNCERTAIN
1. Section 301 Forced-Labor Tariffs Take Effect on 60 Economies, Converting a Refundable Levy Into a Durable Cost Input
The core facts:Additional duties of 10% or 12.5% took effect at 12:01am ET Friday under Section 301 of the Trade Act of 1974, imposed by USTR on covered products from 60 investigated economies and tiered by each economy’s forced-labor compliance. Tier-one partners — Canada, the EU, the UK and Mexico — face 10%, alongside India, Indonesia, Malaysia, Bangladesh and others; economies that failed to adopt import prohibitions, including China, Japan, Australia and Brazil, face 12.5%. The action replaces the Section 122 stopgap that expired at the same moment, itself the successor to the IEEPA tariffs struck down by the Supreme Court in February. Markets diverged rather than sold off: the Dow closed +0.45%, the S&P 500 +0.05%, and the Nasdaq 100 -1.15% on an unrelated semiconductor rout.
Why it matters:The mechanism change matters far more than the headline rate. Section 301 has survived prior court challenges — the 2018-2022 China action was upheld — whereas the IEEPA tariffs it replaces were struck down and left importers with refund claims. That converts a contestable, potentially refundable levy into a durable cost input that corporate planners must now underwrite in 2027 budgets rather than treat as a contingent liability. US importers, not foreign exporters, pay these duties, so the incidence lands on domestic gross margins across import-reliant retail, autos and consumer hardware. The muted tape reaction is itself informative: with roughly 99.4% of US imports now covered, this is a broad-based cost shock with no obvious equity short to express it, which tends to surface in margin guidance over subsequent quarters rather than on the announcement day.
What to watch:Second-half gross-margin guidance from import-heavy retailers and consumer-hardware names for the first quantified pass-through estimates, and the Court of International Trade docket, which holds exclusive first-instance jurisdiction over the legal challenge now filed against the action.
UNCERTAIN
2. Crude Reverses Hard as Pakistan Pursues a China-Backed Path Back to US-Iran Talks — Then Trump Signals a “Massive Attack”
The core facts:Brent fell 2.50% to $98.17/bbl and WTI 1.91% to $90.43/bbl, reversing part of Thursday’s surge above $100, after reports that Pakistan is pursuing a framework — initiated by China — to restart stalled US-Iran negotiations. The transatlantic spread compressed to $7.74 from $8.26, indicating the de-escalation premium bled out of seaborne barrels first, exactly reversing how it had been priced in. Downside was capped late in the session by reports that President Trump met with senior advisers Friday to weigh intensified military action, saying he is close to deciding on a “massive attack” and that the US will hold Iran responsible for Houthi strikes on the Saudi tankers Encelia and Layla. CENTCOM completed a twelfth successive round of strikes on Iran overnight. Both benchmarks still finished the week sharply higher — WTI roughly +8%, Brent roughly +10%.
Why it matters:This is a partial unwind of a large geopolitical premium, not a resolution, and the cross-asset signature confirms how markets are reading it. Crude falling while the Dow rallied 0.45% is the constructive configuration — lower input costs rather than weaker demand — and the bond market agreed, with both the 2Y and 10Y easing roughly 2 bps and the 2s10s spread unchanged at 34 bps. That is a disinflationary read, not a growth scare. VIX slipped to 18.57 despite the Nasdaq’s decline, and the dollar closed flat, removing any safe-haven interpretation. The asymmetry is the problem: the entire retracement rests on a third-party diplomatic initiative that has not produced a negotiation, while the escalation path remains live and now spans two chokepoints.
What to watch:Whether the Pakistan-brokered framework produces an actual scheduled meeting rather than reported willingness, and whether Brent holds below $100 into the July 28-29 FOMC — the level at which the energy-inflation channel re-enters the policy debate.
BEARISH
3. AI Capital Spending Flips From Virtue to Liability as a Chip Gauge Falls 4.4% on an Otherwise Green Tape
The core facts:A gauge of semiconductor firms sank 4.4% while the Dow rose 0.45% and seven of eleven S&P sectors closed green. Technology was the only sector to fall more than 1%, at -1.46%, dragging the Nasdaq 100 down 1.15% to 28,128.34. The damage spread across memory, logic and chip equipment: SanDisk -10.79%, Intel -7.89%, Micron -6.99% and Applied Materials -4.72%. The trigger was the market’s reading of Intel’s decision to lift 2026 capital spending above $20 billion with 2027 higher still and tooling up 40% versus 2025 — a plan disclosed alongside a genuine blowout quarter. Crucially, VIX fell 0.70% to 18.57 and equal-weight breadth was positive, confirming a single-sector shock rather than a broad risk event.
Why it matters:The market has now applied the same test to a foundry that it applied to hyperscalers on Thursday, and the verdict is consistent: beating revenue estimates no longer earns a pass if the capital intensity behind that revenue looks open-ended. That is a change in the discount rate applied to AI infrastructure spending, not a change in AI demand — Intel’s data-centre and AI revenue grew 59% year over year in the quarter that got sold. For portfolio construction the distinction is decisive: if the repricing is about capital intensity rather than end demand, it should compress multiples across the capex-heavy semiconductor and hyperscaler complex while leaving asset-light AI beneficiaries intact, which is precisely the rotation the tape delivered as Apple rose 3.53% and IBM 3.65% on the same session.
What to watch:Microsoft and Meta on Wednesday July 29 and Apple on Thursday July 30 — whether hyperscaler capex guidance draws the same punishment will confirm whether this is a durable regime change in how AI spending is valued or a two-session overshoot.
BEARISH
4. Paramount Skydance Agrees to Freeze Its $111 Billion Warner Bros. Discovery Takeover Until June 2027
The core facts:In an eleven-page joint stipulation filed Friday afternoon in federal court, Paramount Skydance agreed not to close its acquisition of Warner Bros. Discovery until five days after a trial concludes or June 1, 2027, whichever is earlier. The concession follows an antitrust suit brought by twelve Democratic state attorneys general led by California’s Rob Bonta, alleging the transaction violates Section 7 of the Clayton Act, and a temporary restraining order granted on July 20 in which the court found the states had presented compelling evidence that the combined firm would hold substantial share in wide-release theatrical distribution. Trial is set for mid-2027. The deal had already secured approval from federal regulators and from European authorities, and the DOJ declined to challenge it.
Why it matters:A federally cleared, EU-cleared transaction of this size being frozen for nearly a year by state attorneys general is a structural repricing of deal risk, not a media-sector story. The operative precedent is that federal antitrust clearance no longer terminates merger risk — state AGs have demonstrated they can independently impose a multi-year delay, which is often economically equivalent to a block once financing costs, employee attrition and business-plan drift are counted. For a market that has been underwriting an accommodative federal antitrust posture, with the DOJ suing to block just one deal since January 2025, this reintroduces a veto point that arbitrage spreads and large-cap M&A pipelines have not been discounting.
What to watch:Whether merger-arbitrage spreads widen on other large pending deals with concentrated state-level exposure, and whether additional state coalitions file against transactions the federal agencies have already cleared.
BEARISH
5. Trump Opens a Section 301 Investigation Into the EU Over Big Tech Fines, Threatening a “Substantial” Tariff
The core facts:President Trump said Friday his administration will open a Section 301 investigation into European Union trade practices, targeting the bloc’s antitrust penalties against US technology companies and stating that “the penalties will be entirely reversed and, we anticipate, a substantial TARIFF to be placed on them at the earliest possible moment.” The trigger was the EU’s fine against Alphabet — €890 million, roughly $1 billion — announced Thursday for allegedly favouring its own services in search and app distribution. Trump accused the bloc of “robbing” American companies and also cited prior European penalties against Apple, Meta and Amazon. The threat lands on the same day the administration’s separate Section 301 forced-labor duties took effect on the EU at 10%.
Why it matters:Section 301 is now being used as a general-purpose retaliation instrument rather than a narrow remedy, and today supplied proof that it works: the forced-labor action took effect on schedule and survived where the IEEPA tariffs did not. Applying the same statute to European regulatory enforcement effectively links EU competition policy to US trade policy, meaning every future Brussels fine against a US technology company carries an implied tariff response on European goods. For portfolios that is a two-sided exposure — European exporters to the US face a new tail risk, while the large-cap US technology names being defended face the prospect of their regulatory disputes escalating into trade disputes with retaliation risk of their own.
What to watch:Formal initiation of the investigation in the Federal Register, which starts the statutory clock and defines product scope, and whether Brussels signals any willingness to suspend or reduce the Alphabet penalty.
— Quantifying recession risk so you don’t have to guess. Apply for membership at join.recessionalert.comD. MODERATE-IMPACT STORIES -> TOP
BULLISH
6. Apple Climbs 3.53% Toward a Record as the Market Pays Up for AI Exposure Without the Capital Bill
The core facts:Apple rose 3.53% to $333.02, approaching a record high and ranking second among mega-cap gainers, on a session when the semiconductor complex fell 4.4%. The stock trades above every major moving average heading into results on Thursday July 30. Morgan Stanley analyst Erik Woodring raised his price target to $364 from $360 on July 23. IBM posted a similar move, gaining 3.65% to $214.19 as its low-capex software model drew buyers, while Home Depot added 2.55% on easing yields.
Why it matters:Apple’s advance is the clean mirror image of the semiconductor selloff and the most precise available measure of what the market is actually repricing. Both trades express a single view: participation in AI end-demand is still rewarded, but the balance-sheet commitment required to produce it is now penalised. That the two moves occurred in the same session, in the same sector complex, and in opposite directions tells you this is discrimination within the AI trade rather than a wholesale exit from it — a materially more constructive interpretation than the Nasdaq’s 1.15% decline suggests in isolation.
What to watch:Apple’s own capital-expenditure commentary on the July 30 call — any signal that it intends to fund AI infrastructure directly would remove the very characteristic driving this bid.
BEARISH
7. A Seoul Memory Rout Transmits Straight Into US NAND and DRAM Names, Reversing Thursday’s Winners
The core facts:An overnight selloff on the KOSPI drove SK Hynix down 6% in Seoul, triggering a sympathy move across US memory names. SanDisk fell 10.79% to $1,436.56, the day’s worst mega-cap decliner, Micron dropped 6.99% to $920.95, and a DRAM-focused ETF fell 7%. No US-specific fundamental catalyst accompanied the move, and neither company altered guidance. The reversal is sharp: Micron had risen 3-4% toward $1,000 on Thursday as investors framed hyperscaler capex guidance as a direct demand signal for high-bandwidth memory.
Why it matters:Memory names round-tripped a bullish thesis in a single session on a foreign equity move rather than any change in memory fundamentals, which says the AI-beneficiary trade is being held with far less conviction than the demand narrative implies. It also exposes a positioning vulnerability: US memory has become a high-beta expression of a Korea-anchored supply chain, so US portfolios carry an overnight gap risk priced in Seoul before domestic markets open. For anyone owning memory as the “safe” way to own AI capex, the two sessions together are a warning that the position is neither safe nor uncorrelated.
What to watch:Whether SK Hynix stabilises on the next Seoul session — a continued decline would convert a sympathy move into a genuine repricing of memory pricing assumptions rather than a positioning flush.
BULLISH
8. Real Estate Leads Every Sector at +2.08% on Easing Yields — but Utilities Close Red, Contradicting the Rate Story
The core facts:Real Estate gained 2.08%, the best-performing S&P 500 sector, as both the 2Y and 10Y Treasury yields eased roughly 2 bps to 4.337% and 4.681% respectively, leaving the 2s10s spread unchanged at 34 bps. Utilities, the other classic rate-sensitive defensive, closed down 0.21%. Financials added 0.83%. Real Estate is now +13.35% year to date and +10.64% over six months. Home Depot’s 2.55% gain came from the same rate-relief impulse.
Why it matters:If falling yields were genuinely driving the session, Utilities and Real Estate should have moved together — they did not, and that divergence narrows the interpretation. Real Estate’s six-month and year-to-date performance suggests the sector is being bought on its own rerating rather than as a duration proxy, while Utilities have been absorbing the AI power-demand narrative that makes them behave increasingly like a growth-linked capex sector rather than a bond substitute. A 2 bp move is in any case too small to justify a 2.08% sector gain on rates alone, which points to rotation out of the semiconductor complex seeking a defensive home with positive carry.
What to watch:Whether Utilities and Real Estate re-converge on the next material move in the 10Y — sustained divergence would confirm Utilities have decoupled from the rate-sensitive complex entirely.
UNCERTAIN
9. Liberty Justice Center Sues to Strike Down the New Section 301 Tariffs Hours After They Took Effect
The core facts:The Liberty Justice Center filed a legal challenge Friday against the Section 301 forced-labor duties, acting for two US small businesses — Burlap & Barrel, a New York single-origin spice retailer, and Collective Horology, a California watch distributor. The suit targets USTR’s assertion that the mere absence of a foreign import prohibition constitutes an “unreasonable” trade practice under the statute, a novel legal theory that trade counsel had widely expected to draw challenge. The Court of International Trade holds exclusive first-instance jurisdiction. USTR’s exclusion-petition process remains a parallel administrative route; the 2018-2022 China Section 301 litigation ultimately produced hundreds of product-specific exclusions along that path.
Why it matters:This is the counterweight to the durability argument that makes today’s tariff action investable. The market’s working assumption is that Section 301 survives judicial review because the China action did — but that action rested on documented findings of intellectual-property theft, whereas this one rests on the absence of a foreign law. If the courts treat that distinction as material, the same refund-claim uncertainty that plagued the struck-down IEEPA tariffs returns, and importers face another period in which they cannot tell whether duties paid are a permanent cost or a recoverable asset. That ambiguity is worse for corporate planning than a high but certain rate.
What to watch:Any motion for preliminary injunction and how quickly the Court of International Trade schedules it — an early injunction would suspend collection and reopen the refund question across all 60 economies.
BEARISH
10. Barclays Holds $100 Brent Forecast but Warns Risks Are Skewed Higher on a Twin Hormuz and Bab el-Mandeb Blockade
The core facts:Barclays held its 2026 Brent forecast at $100/bbl while warning that risks are firmly skewed to the upside, describing the Hormuz closure as the worst supply disruption on record and noting that inventory trends signal a 6-8 million bbl/day deficit, with US stocks within reach of their lowest levels since 2020. Kpler ship-tracking data showed just one tanker crossing Hormuz on Thursday, the fewest since May 7. The Houthis declared their naval blockade of Saudi Arabia on Monday, closing the pipeline workaround Riyadh had used to bypass Hormuz, and Goldman Sachs estimates roughly 4 million bbl/day routed through Bab el-Mandeb would be difficult to reroute. Some physical cargoes are reported changing hands near $110.
Why it matters:The gap between the physical and paper markets is the actionable detail. Futures fell 2.50% on a diplomatic report while physical cargoes trade above $110 and Hormuz transit collapses to a single tanker — the paper market is pricing a negotiation that the physical market cannot yet source barrels around. That configuration historically resolves toward the physical, not the paper. It also sets the risk asymmetry into next week’s FOMC: today’s crude decline is what let the bond market read the session as disinflationary, and a reversal driven by physical tightness rather than headlines would remove that support with no diplomatic offset.
What to watch:Kpler’s daily Hormuz transit count — a sustained recovery above single digits would validate the futures market’s de-escalation pricing, while continued collapse would confirm the physical deficit thesis.
UNCERTAIN
11. HSBC Initiates SpaceX at Hold With a $115 Target, Below the Largest IPO in History’s Offer Price
The core facts:HSBC initiated coverage of the newly public SpaceX (SPCX) at Hold with a $115 price target — the first tier-one Street coverage of the company. SpaceX went public on June 12 at $135 per share on 555 million shares, the largest IPO ever completed, and rallied roughly 23% within two weeks of its debut. The $115 target sits about 15% below the offer price. Other notable Friday calls included Cleveland-Cliffs upgraded to Neutral from Underperform at BNP Paribas with an $11.50 target, Tenable cut to Neutral from Buy at UBS at $37, and Sunoco initiated Outperform at Mizuho at $83.
Why it matters:The first major bank to publish on the largest IPO ever priced it below the deal, and did so with a Hold rather than a Sell — a combination that signals valuation discomfort without a thesis against the business. Because SPCX now anchors the post-IPO risk appetite that a substantial 2026 listing pipeline depends on, a below-offer initiation from a bank not in the underwriting syndicate carries disproportionate weight in how issuers and sponsors price subsequent deals. For institutional holders sitting on the post-debut rally, it is the first independent mark against a price set entirely by primary-market demand.
What to watch:Whether syndicate banks initiate above or below HSBC when their research quiet periods expire, and whether SPCX holds its $135 offer price — a sustained break below it would mark the post-IPO cohort’s first major broken deal.
UNCERTAIN
12. Dutch TTF Gas Rises 2.36% While Crude Collapses, Confirming Europe’s Supply Problem Is Structural
The core facts:Dutch TTF natural gas rose 2.36% to $21.13/MMBtu on the same session that Brent fell 2.50% and Henry Hub eased 1.10% to $2.884/MMBtu. The divergence is complete — European gas gained while every other major energy benchmark declined on the same de-escalation headline that drove the crude reversal.
Why it matters:European gas did not participate in the Gulf de-escalation trade, which means its tightness is not sourced from the Middle East risk premium and will not resolve if that premium unwinds further. The TTF-to-Henry-Hub ratio at roughly 7.3x is the operative number: it keeps US LNG export economics highly attractive regardless of the crude tape and sustains a structural cost disadvantage for European industrial producers relative to US competitors in chemicals, fertilisers and metals. That is a persistent margin differential rather than a headline-driven one, and it argues for treating European industrial cost exposure as a standing position risk rather than a geopolitical trade.
What to watch:European storage injection rates through the remainder of the summer refill season — a shortfall against the seasonal path would confirm the structural read and extend the US LNG arbitrage into winter.
— Separating signal from noise since 2007. Apply for membership at join.recessionalert.comE. ECONOMY WATCH -> TOP
The week closes on a split-screen economy: July’s flash composite PMI jumped to 53.6, an eight-month high consistent with 2.0% annualised Q3 growth, while the rate-sensitive hard data kept deteriorating — new home median prices fell 3.3% to $398,300, sales ran 5.6% below June 2025, and mortgage rates rose a third straight week to 6.58%. Overlaying both is a new tariff floor: Section 301 forced-labor duties of 10-12.5% took effect Friday across 60 trading partners covering 99.4% of US imports, backfilling the blanket tariff the Supreme Court struck down. Firming activity surveys, softening housing and a fresh cost-push shock hand Wednesday’s FOMC a stagflationary brief, with fixed income assigning roughly a one-third chance of a hike.
Flash Composite PMI Hits Eight-Month High of 53.6 as Services Beat, But Factory Output Slips to Four-Month Low (S&P Global, July 24, 2026)
What they’re saying:The S&P Global flash US Composite PMI rose to 53.6 in July from 51.9 in June, well ahead of the 52.2 consensus and the strongest reading in eight months. Services led the beat at 53.6 against 51.5 expected, while manufacturing held roughly flat at 53.8 versus 54.3 expected and 53.9 prior. S&P Global said the survey is broadly consistent with GDP growing at a 2.0% annualised rate in Q3, against the 1.2% pace its data signalled for Q2.
The context:A composite print more than a point above consensus is a genuine upside surprise and argues against the soft-patch narrative that dominated Q2, when the Atlanta Fed’s GDPNow tracker sat at 1.7%. The internals are less clean than the headline: the Manufacturing Output Index fell to 53.6 from 56.2, a four-month low, meaning the acceleration is entirely services-driven while the goods economy loses momentum. For a Fed already leaning hawkish, an economy re-accelerating into a fresh tariff round removes the growth argument for patience.
What to watch:Durable goods orders for June on Monday, July 27 — consensus looks for +0.9% ex-transport against +1.3% prior, and the headline series is coming off a -4.5% print. A second weak factory reading would confirm the manufacturing divergence the PMI output index is flagging.
New Home Sales Beat at 628K but Median Price Drops 3.3% and Supply Stays at 9.3 Months (US Census Bureau, July 24, 2026)
What they’re saying:New single-family home sales ran at a seasonally adjusted annual rate of 628,000 in June, above the 610,000 consensus and 1.6% above May’s 618,000. The year-over-year comparison is far weaker: sales sit 5.6% below June 2025’s 665,000 pace. The median sales price fell to $398,300, down 3.3% from May’s $412,000 and 2.7% below a year ago, while inventory eased to 485,000 units and months of supply ticked down to 9.3 from 9.4.
The context:The consensus beat is the least informative part of this release. Months of supply at 9.3 remains roughly double the six-month level historically considered balanced, and builders are clearing that inventory by cutting prices — a median below $400,000 for the first time in this cycle is margin compression, not demand recovery. Falling new-home prices are disinflationary for shelter costs with a long lag, but they also signal that the rate-sensitive part of the economy is still contracting even as the PMI surveys firm.
What to watch:S&P/Case-Shiller and FHFA house price indices for May, both due Tuesday, July 28. Case-Shiller’s prior YoY print was 1.1%; a move toward zero would confirm that price weakness has spread from new builds into the existing-home market.
Mortgage Rates Rise a Third Straight Week to 6.58%, Holding Near the Annual High (Freddie Mac, July 23, 2026)
What they’re saying:The average 30-year fixed mortgage rate rose to 6.58% in Freddie Mac’s weekly survey from 6.55%, extending gains for a third consecutive week and leaving the rate near its high for the year. The 15-year fixed rate rose to 5.96% from 5.93%. Rates remain modestly below the 6.74% level of a year ago.
The context:The direction matters more than the level. Mortgage rates are climbing because the long end is repricing hawkishly into next week’s FOMC, not because growth expectations improved — which makes this a pure tightening of financial conditions for the household sector. It lands directly on the housing data above: builders are already discounting into 9.3 months of supply, and a third straight week of higher financing costs erodes whatever affordability those price cuts bought.
What to watch:MBA mortgage applications and the MBA 30-year rate on Wednesday, July 29, released hours before the Fed decision. Purchase applications (prior index 165.8) turning down would show the rate move already biting demand.
Section 301 Forced-Labor Tariffs of 10-12.5% Take Effect on 60 Trading Partners, Covering 99.4% of US Imports (Reuters / Fortune / CNBC, July 24, 2026)
What they’re saying:New duties of 10% and 12.5% on goods from 60 trading partners took effect at 12:01am EDT Friday, imposed under Section 301 of the Trade Act of 1974 on the grounds of lax enforcement of forced-labor bans. Partners that have enacted or pledged forced-labor bans — including Canada, Mexico, India and the United Kingdom — are assessed at 10%; the remainder, including Taiwan and the European Union, pay 12.5%. The measures cover 99.4% of US imports, and goods already in transit are exempt until 12:01am EDT on Tuesday, July 28.
The context:This is a backfill, not an escalation in headline rate — the temporary 10% global tariff expired at the same moment the new duties began, after Congress let it lapse and the Supreme Court struck down the IEEPA-based version in February. The significance is durability: Section 301 has survived prior court challenges, so a tariff floor across effectively all US imports now rests on far firmer legal ground than the regime it replaces. That converts what markets had been treating as a contestable, refundable levy — Treasury has already paid out roughly $70 billion of $166 billion in eligible IEEPA refunds — into a persistent cost-push input landing the week the Fed debates a hike.
What to watch:The advance goods trade balance for June on Tuesday, July 28 (prior -$105.9B), and retaliation announcements from the EU and China over the coming week. Import price pass-through will not appear in CPI until the September data at the earliest.
Bond Market Prices a One-in-Three Chance of a July 29 Hike as Economists Still Forecast a Hold (Renaissance Macro / FactSet / CNBC, July 23-24, 2026)
What they’re saying:Fixed income markets assign roughly a one-third probability that the FOMC raises rates at the July 28-29 meeting, while economists polled by FactSet still expect the target range held at 3.50-3.75%. Renaissance Macro’s Neil Dutta argued that Governor Waller’s recent remarks show the Fed “is laying the groundwork for a hike as soon as the July FOMC meeting,” and noted Chair Kevin Warsh “has come out swinging with a short statement and he did not submit a forecast.” Prediction markets repriced a July hike from 3% to 28% over seven days.
The context:The gap between market pricing and economist consensus is the tradable feature here — a third of the rates market is positioned for an outcome the professional forecasting community still calls unlikely, which means a hold repriced dovishly and a hike repriced violently. The hawkish case rests on PCE inflation near 4.1% and Brent above $100 rather than on demand strength, and Warsh’s stated intent to give less forward guidance removes the usual pre-meeting signalling that would resolve the split. Today’s PMI beat, by removing the growth alibi for patience, narrows the case for waiting further.
What to watch:The FOMC decision at 2:00pm and Warsh’s press conference at 2:30pm on Wednesday, July 29. With no dot plot due, the statement language on inflation risks carries the entire signal.
— Know the probability before the market prices in the risk. Apply for membership at join.recessionalert.comF. EARNINGS WATCH -> TOP
YESTERDAY AFTER THE BELL (Markets Reacted Today)
UNCERTAIN
13. Intel Corp (INTC): -7.89% | Best Growth in Fifteen Years, Erased by a Capex Number
The Numbers:Released: AMC July 23. Revenue $16.13B versus $14.42B expected, up 25% year over year — Intel’s strongest growth in more than fifteen years and $1.8B above its own guidance midpoint. Non-GAAP EPS $0.42 versus $0.21 expected; operating income $1.796B versus $1.58B. Non-GAAP gross margin 41.8%, 280 bps above forecast. Data Center and AI revenue rose 59% to $6.3B; Foundry rose 31% to $5.8B. Q3 guidance: revenue $15.8-16.8B, EPS $0.38. 2026 capital spending raised above $20B with 2027 to rise meaningfully; tooling up 40% versus 2025.
The Problem/Win:Shares jumped 12-13% within minutes of the post-close print, then surrendered the entire gain and closed the following session down 7.89% at $92.32 — a swing of roughly 20 percentage points on unchanged fundamentals. The sole variable was the capex line. Management framed the raise as evidence that 18A customer commitments are firming, with 18A output exceeding internal targets by about 25% in the quarter and up more than 50% sequentially, and CEO Lip-Bu Tan citing growing confidence in 14A ahead of risk production in 2027. The market instead read spending above $20B, rising again in 2027, against still-limited external foundry demand.
The Ripple:Intel’s reversal became the session’s organising event for the entire sector. A gauge of semiconductor firms fell 4.4%, Technology was the only S&P sector down more than 1% at -1.46%, and Applied Materials dropped 4.72% as chip-equipment names were sold on the same logic. The Nasdaq 100 fell 1.15% while the Dow rose 0.45%.
What It Means:The market is now discounting AI-linked capital expenditure at a materially higher rate than the revenue it produces, and will punish that spending even when attached to a genuine operational inflection. Intel’s turnaround thesis is intact on the operating numbers; it is the financing of that turnaround that has been repriced.
What to watch:Announcements of named external 18A or 14A foundry customers — the single disclosure that would convert the capex raise from an unfunded commitment into a contracted one.
BULLISH
14. Newmont Corp (NEM): +1.3% pre-mkt | Record Free Cash Flow on a $4,414 Realised Gold Price
The Numbers:Released: AMC July 23. Revenue $6.12B, up 15% year over year. Adjusted EPS $2.10 versus $1.99 consensus; GAAP EPS $2.06 against $1.85 a year earlier. Attributable gold production 1.29 million ounces. Record quarterly free cash flow of $2.2B. Average realised gold price $4,414/oz versus $3,320 a year earlier. FY2026 guidance reaffirmed at 5.26 million ounces with all-in sustaining costs guided to $1,680/oz. Quarterly dividend held at $0.26, a forward yield near 1.1%.
The Problem/Win:The realised price did the work — a 33% year-over-year increase against all-in sustaining costs guided to $1,680/oz produces roughly $2,700 of margin per ounce, which is what converted a 15% revenue gain into record free cash flow. Management chose to reaffirm rather than raise production guidance and held the dividend flat despite the cash generation, a conservative posture that keeps optionality with the balance sheet rather than committing it to shareholders at a cyclical high in the gold price.
The Ripple:The print landed into a supportive tape for the metal, with gold rising 0.15% to $4,056.12/oz and silver outperforming at +0.76% as Treasury yields eased roughly 2 bps across the curve — a reversal from the prior session, when gold fell 2.42% on the yield surge.
What It Means:At these realised prices Newmont is a cash-return story rather than a growth story, and the decision to hold both production guidance and the dividend flat signals management is not underwriting $4,400 gold as a durable base case.
What to watch:Whether all-in sustaining costs track toward the $1,680/oz guide or drift higher — cost inflation is the only mechanism that meaningfully compresses margin at current gold prices.
TODAY BEFORE THE BELL (Markets Already Reacted)
BULLISH
15. Verizon Communications (VZ): +5.84% | Best Consumer Q2 in Five Years Triggers a Second Straight Guidance Raise
The Numbers:Released: BMO. Adjusted EPS $1.30 versus $1.28 expected. Revenue $34.25B versus $35.16B expected, a 2.59% miss. GAAP EPS $0.92 versus $1.23 expected. Postpaid phone net additions 184,000 against consensus of 106,000, the best consumer Q2 in five years; broadband net additions 348,000; churn 84 bps. Guidance raised for a second consecutive quarter: mobility and broadband service revenue growth to 2.5-3%, adjusted EPS growth to 6-7%. Full-year postpaid phone net adds still expected in the upper half of the 750,000 to 1 million range. $1B of stock repurchased in the quarter, with the buyback target lifted to $4.5B.
The Problem/Win:Subscribers, not revenue, drove the 5.84% move. Beating postpaid phone net adds by 74% against consensus while holding churn at 84 bps demonstrates the company is taking share without buying it through promotional intensity — the distinction that separates durable subscriber growth from rented growth in US wireless. Management characterised the company as being in its strongest operating position in years. The headline revenue miss and the GAAP shortfall were set aside because the subscriber line is what forecasts forward service revenue.
The Ripple:The result supported Communication Services, which added 0.45% and stabilised after a 5.82% weekly decline, with Netflix gaining 1.74%. Verizon’s share gains come at the direct expense of competitors in a mature, essentially zero-sum US postpaid market.
What It Means:Two consecutive guidance raises with disciplined churn re-establishes Verizon as a defensive holding with a credible growth component, an unusual profile in a session where capital intensity was being punished elsewhere.
What to watch:Competitor postpaid net adds in coming reports — if rivals show corresponding losses, Verizon’s gains are genuine share capture; if the market grew, the achievement is smaller than it appears.
UNCERTAIN
16. American Express (AXP): -4.30% | Strongest Card Spending in Three Years, Sold Anyway
The Numbers:Released: BMO. EPS $4.53 versus $4.40 expected, up 11% from $4.08 a year earlier. Revenue $19.64B versus $19.70B expected, a 0.30% miss. Billed business rose 9% to $455.8B; card member spending grew 9% FX-adjusted, the strongest quarterly pace in three years, with airline travel, travel and entertainment, and luxury retail all strong. Full-year 2026 revenue growth guidance raised to 10% from a prior 9-10% range, while the EPS outlook was maintained at $17.30-$17.90.
The Problem/Win:The combination that produced a 4.30% decline was a narrow revenue miss alongside a revenue guidance raise that was not accompanied by an EPS guidance raise. Holding the $17.30-$17.90 EPS range while lifting revenue growth to 10% implies the incremental revenue arrives at lower incremental margin — most plausibly through higher rewards costs and customer-acquisition spend required to sustain a 9% spending pace. For a franchise valued on affluent-consumer spending power, delivering the strongest volume growth in three years without flowing it to the bottom line reframes the quarter as expensive growth.
The Ripple:The decline ran directly against its sector — Financials rose 0.83%, the third-best sector on the day, and Mastercard advanced 1.77%. That divergence identifies the move as company-specific rather than a read on consumer credit conditions broadly.
What It Means:The affluent US consumer is spending at the fastest rate in three years, which is a genuinely constructive macro datapoint; the equity nonetheless de-rated because the cost of capturing that spending is rising faster than the spending itself.
What to watch:Rewards expense as a percentage of billed business in the next report — the metric that determines whether this quarter’s margin compression is a one-off investment or a structural cost of defending the premium card franchise.
UNCERTAIN
17. NextEra Energy (NEE): -0.01% | Backlog Hits 35.1 GW as Large-Load Demand Forecast Jumps to 8 GW
The Numbers:Released: BMO. Adjusted EPS $1.15 versus $1.11 expected, up 9.5% from $1.05 a year earlier. GAAP EPS $1.50 versus $0.98 a year earlier. Revenue $7.53B versus $8.11B expected, a 7.08% miss. Added 3.6 GW to the renewables and storage backlog in the quarter — roughly 2.0 GW battery storage, 0.9 GW solar and 0.7 GW wind — bringing the Energy Resources backlog to approximately 35.1 GW. Large-load demand expectation raised to 8 GW by 2032 from 6 GW previously. FY2026 EPS outlook maintained at $3.92-$4.02, with long-term annual EPS growth reaffirmed at 8%-plus through 2032 and 2035.
The Problem/Win:The 7% revenue miss against a 9.5% adjusted EPS gain shows earnings growth is coming from margin and asset mix rather than volume, which the market treated as neither a positive nor a negative — the stock finished dead flat at -0.01%. The substantive disclosure was the large-load demand upgrade from 6 GW to 8 GW by 2032, a one-third increase in expected data-centre, AI and reshoring load. Management nonetheless left full-year guidance untouched, keeping the demand upgrade a backlog story rather than an earnings story.
The Ripple:Utilities closed down 0.21% even as Real Estate led all sectors at +2.08% on the same easing yields — a divergence that suggests utilities are increasingly traded on AI power-demand exposure rather than as a bond proxy, and NextEra’s flat close on a raised demand forecast fits that reading.
What It Means:NextEra is accumulating the clearest contracted evidence available that AI power demand is real and growing, on the same day the market punished the capital spending required to serve it — a tension that will define how the AI-infrastructure complex is valued from here.
What to watch:Backlog conversion into revenue over the next two quarters — a 35.1 GW backlog only creates value if it converts on schedule and at contracted returns.
TODAY AFTER THE BELL (Markets React Tomorrow)
No major earnings after the bell from companies with >$100B market cap.
WEEK AHEAD PREVIEW:
Q2 2026 earnings season moves into its heaviest stretch next week, with roughly 10% of the S&P 500 reported so far and three of the four largest hyperscalers due within 48 hours of the July 28-29 FOMC decision.
Welltower (WELL) — AMC, Monday July 27 — Consensus FFO $1.55, implying 21.1% year-over-year growth; the company has beaten FFO estimates in each of the last four quarters. Key focus: senior housing occupancy, which reached roughly 89% in Q1 on a 370 bps improvement, same-store NOI against blended guidance of 12.25%-16.00%, and whether management raises full-year normalised FFO guidance again while holding the payout ratio under 50%.
Microsoft (MSFT) — Wednesday July 29 — The single most consequential print of the week after this session’s repricing of AI capital spending. Key focus: fiscal 2027 capex guidance and Azure constant-currency growth. With Intel down 7.89% and Alphabet down 7.13% earlier in the week on capex disclosures, the market has established that an open-ended spending plan will be punished regardless of the revenue attached to it.
Meta Platforms (META) — Wednesday July 29 — Reports the same day as Microsoft, into a seventh consecutive losing session. Key focus: 2026 and preliminary 2027 capital expenditure guidance, AI infrastructure commitments including the reported Oracle cloud agreement, and whether management frames spending against a defined return horizon rather than an open-ended build.
Apple (AAPL) — Thursday July 30 — +3.53% today to $333.02, near a record, with Morgan Stanley lifting its target to $364 on July 23. Key focus: whether Apple’s asset-light approach to AI holds — the entire basis of this week’s bid — plus iPhone unit trends and any commentary on Section 301 tariff exposure across its import-reliant hardware supply chain.
Amazon (AMZN) — Wednesday or Thursday, July 29-30 (exact day not confirmed) — Completes the hyperscaler sequence. Key focus: AWS growth reacceleration and the capex line, which faces the same scrutiny now being applied across the complex.
The FOMC decision on Wednesday July 29 lands between the Microsoft/Meta and Apple reports, compressing policy risk and mega-cap earnings risk into a single 48-hour window.
— US market commentary trusted by family offices and institutions. Apply for membership at join.recessionalert.comG. WHAT’S NEXT -> TOP
UPCOMING RELEASES:
| Date | Event | Why It Matters |
|---|---|---|
| Mon, Jul 27 | Durable Goods Orders, June (prior -4.5%); ex-transport expected +0.9% vs +1.3% prior; ex-defense prior -4.6% | The first hard-data test of the manufacturing divergence flagged by Friday’s PMI, where the output index fell to a four-month low even as the composite hit an eight-month high. A second weak factory reading would confirm the goods economy is losing momentum while services carry the expansion. |
| Mon, Jul 27 | Dallas Fed Manufacturing Index, July (prior 0) | A same-day regional cross-check on factory conditions, and the first survey capturing sentiment after the Section 301 duties took effect. A move below zero would align the regional picture with the softening national output index. |
| Tue, Jul 28 | Advance Goods Trade Balance, June (prior -$105.9B) | The last clean read on import volumes before the new tariff floor distorts the series, and a direct input into Q2 GDP. Front-running ahead of the duties would show as a wider deficit, borrowing from third-quarter imports. |
| Tue, Jul 28 | ADP Weekly Employment Change (prior +16.5K) | The only labour reading before the Fed decides, and the highest-frequency evidence available on whether hiring is holding up alongside the services acceleration. A soft print would restore part of the growth argument for patience the PMI beat removed. |
| Tue, Jul 28 | Advance Retail and Wholesale Inventories, June (prior +0.3% / +0.1%) | Inventory builds ahead of the tariff start date would signal importers stockpiling to delay the cost impact, which pushes margin pressure into later quarters rather than removing it. |
| Tue, Jul 28 | API Crude Oil Stock Change, week to Jul 25 (prior +2.603M) | The private precursor to Wednesday’s EIA data and the first inventory evidence on whether the reported 6-8 million bbl/day deficit is showing up in US stocks, which Barclays notes are near their lowest since 2020. |
| Tue, Jul 28 | CB Consumer Confidence, July (prior 91.2) | Tests whether the household sector shares the optimism in the services PMI while mortgage rates climb to 6.58% and tariff headlines dominate. The expectations sub-index is the more forward-looking component for consumer spending into the second half. |
| Tue, Jul 28 | S&P/Case-Shiller and FHFA House Price Indices, May (Case-Shiller prior +1.1% YoY) | Determines whether the 3.3% drop in new-home median prices has spread into the existing-home market. A move toward zero would confirm broad shelter disinflation — a genuine offset to the tariff cost-push the Fed is weighing the following day. |
| Tue, Jul 28 | Goods-in-transit tariff exemption expires, 12:01am ET | Cargoes already on the water lose their exemption, so the 10-12.5% duties begin applying to the full import flow. This is the point at which the cost shock starts accruing to importer margins rather than sitting in a shipping window. |
| Wed, Jul 29 | FOMC Interest Rate Decision, 2:00pm ET (expected 3.50-3.75% hold) | The week’s dominant event. Roughly one-third of the rates market is positioned for a hike that economists still call unlikely, so a hold reprices dovishly and a hike reprices violently across the curve, the dollar and rate-sensitive equity sectors. |
| Wed, Jul 29 | Fed Chair Press Conference, 2:30pm ET | With no dot plot due and Chair Warsh signalling less forward guidance, the statement language on inflation risks and the press conference carry the entire policy signal. Any characterisation of tariff pass-through as transitory or persistent is the key tell. |
| Wed, Jul 29 | MBA Mortgage Applications and 30-Year Rate (prior 6.69%) | Released hours before the Fed decision. Purchase applications turning down would show the third straight week of higher financing costs already biting demand, reinforcing that the rate-sensitive economy is contracting while surveys firm. |
| Wed, Jul 29 | EIA Crude Oil and Gasoline Stocks, week to Jul 25 (prior +2.011M / +0.765M) | The clearest available check on whether the physical tightness thesis holds after Hormuz transit collapsed to a single tanker. A sizeable draw would contradict the futures market’s de-escalation pricing and put upward pressure back on the inflation outlook. |
KEY QUESTIONS:
1. Does the market apply the same capital-intensity penalty to Microsoft and Meta on Wednesday that it applied to the hyperscalers on Thursday and to Intel on Friday — and if so, is the AI trade being narrowed to asset-light beneficiaries or exited outright?
2. Resolves in favour of the paper market or the physical: futures priced Brent down to $98.17 on a diplomatic report that has produced no scheduled meeting, while cargoes are reported changing hands near $110 and Hormuz transit has collapsed. Which one moves toward the other before Wednesday’s FOMC?
3. With a tariff floor now covering 99.4% of US imports and resting on a statute that has survived court challenge, does the Fed treat the pass-through as a one-off price-level shift it can look through, or as the inflation persistence that justifies the hike a third of the rates market is already positioned for?
— US market commentary trusted by family offices and institutions. Apply for membership at join.recessionalert.comH. CHART OF THE DAY -> TOP
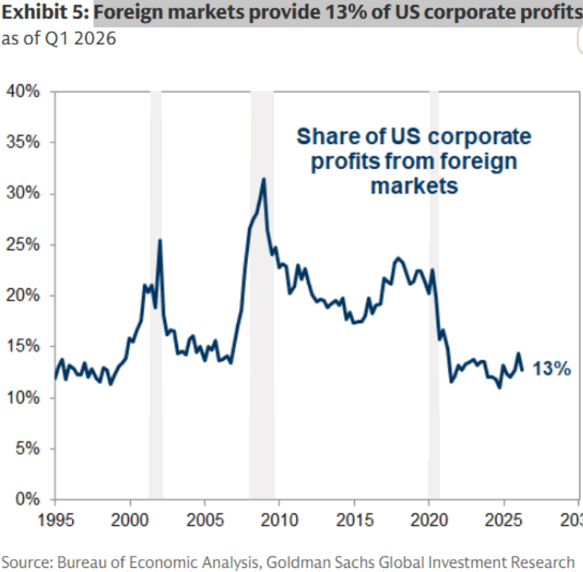
Two recessions taught this line one lesson; the third taught it the opposite. In 2001 and again in 2008-09 the foreign share spiked to records — not because American companies were winning abroad, but because the domestic profit pool was imploding beneath them while overseas receipts held their level. 2020 ran that machinery in reverse and has never let go: the first downturn here that the US profit pool exited stronger than it entered. BEA now puts after-tax profits at 12.4% of GDP, the second-highest quarterly reading in data back to 1947 — against a base that rich, 13% is what the arithmetic delivers. Restated as a sensitivity, that arithmetic is how the earnings channel narrowed. Foreign profits did not go missing; the pool they sit inside expanded fast enough to halve their weight, so the same hit to overseas earnings now moves total US profits less than half as far as it did at the 2008-09 peak. Be precise about what decayed, though: goods exports still run near 11% of GDP, and commodities, the dollar and supply chains transmit as they always did. What thinned is the direct booking of foreign profit into US income — which is why today’s new tariff schedule lands as a cost against the domestic 87%, not a lost foreign sale. The next sustained climb in this line will not be American companies winning abroad; it will be American profits losing at home.
Market Intelligence Brief (MIB) Ver. 18.44
For professional investors only. Not investment advice.
© 2026 RecessionALERT.com

Comments are closed.