
Iran ceasefire deadline Wednesday sent Brent crude surging toward $100 (S&P 500 -0.63%). Apple dropped a bombshell — Tim Cook stepping down, John Ternus in as CEO September 1 (AAPL -2.52%). Amazon’s $25B Anthropic deal is the largest AI infrastructure bet yet (AMZN +2.2%). Retail sales surged 1.7% but record gas station receipts flattered the number, crushing rate-cut hopes. UNH beat big (+6.96%); GE Aerospace sold off despite a 25% EPS beat (GE -5.56%).
TABLE OF CONTENTS
A. EXECUTIVE SUMMARY
B. MARKET DATA
C. HIGH-IMPACT STORIES (5)
D. MODERATE-IMPACT STORIES (5)
E. ECONOMY WATCH (6)
F. EARNINGS WATCH (9)
G. WHAT’S NEXT
H. CHART OF THE DAY
A. EXECUTIVE SUMMARY -> TOP
MARKET SNAPSHOT:
The Iran ceasefire-expiry countdown forced the broadest risk-off session in weeks — the S&P 500 fell 0.63% with only Energy positive as Brent crude surged 3.75% toward $99 on Strait of Hormuz disruption. The yield curve steepened sharply on growth-scare dynamics: the 2Y plunged 6.9 bps pricing recession risk while the 10Y held firm on persistent inflation expectations — and the dollar, not gold, caught the safe-haven bid, suggesting traders see a geopolitical shock rather than a structural inflation regime shift. Searing macro data — retail sales +1.7%, pending home sales beating estimates by 15x — paradoxically compounded the bearish case by crushing remaining rate-cut expectations to near zero for 2026. Breadth confirmed the weakness: 10 of 11 sectors declined, Basic Materials (-2.59%) reversed its month-long commodity rally, and the Russell 2000’s -1.01% underperformance signaled small-caps are absorbing the energy cost shock most acutely.
TODAY AT A GLANCE:
• Iran ceasefire expires Wednesday evening — Trump “ready to resume the war,” Brent crude surging toward $100/bbl on Strait of Hormuz closure threatening 20% of global oil flows
• Apple CEO Tim Cook stepping down September 1 — John Ternus named successor (AAPL -2.52%); analysts maintain buy ratings but flag AI execution pressure at WWDC
• Amazon invests up to $25B in Anthropic (total $33B) — largest AI infrastructure deal to date; JPMorgan raised S&P 500 target to 7,600 on AI-driven earnings strength
• March retail sales surged 1.7% (strongest in 3+ years) but record 15.5% gas station receipt spike inflated the headline; core control group +0.7% vs. +0.2% est.
• UnitedHealth (UNH +6.96%) beat-and-raise lifted managed care sector; GE Aerospace (GE -5.56%) sold off despite 25% EPS beat on Hormuz fuel-cost warnings
• Fed Chair nominee Warsh pledged “regime change” — scrapping forward guidance and PCE targeting — but Sen. Tillis threatens to block confirmation over unrelated Powell investigation
KEY THEMES:
1. Hormuz Countdown Reprices Everything – Wednesday’s ceasefire deadline is a binary event. Brent approaching $100 compresses non-energy margins, inflates headline data, and pushes rate cuts further out — creating a tightening-by-proxy the Fed didn’t choose. The bond market’s growth-scare steepening (2Y -6.9 bps, 10Y flat) reveals the impossible position: an oil shock that simultaneously slows growth and prevents easing.
2. AI Capex Cycle as the Market’s Last Bull Pillar – Amazon-Anthropic’s $25B deal, JPMorgan’s target hike to 7,600, and analyst upgrades across AMD/ANET/INTC collectively argue AI earnings growth is the market’s primary structural support. Without it, today’s geopolitical and rate headwinds would look far more damaging to equity valuations.
3. Consumer Resilience Becomes a Rate Trap – Retail sales +1.7%, pending home sales +1.5%, and ADP’s fifth hiring improvement give the Fed zero cover to cut. CME FedWatch shows rate-cut probability near 40% for all of 2026. The consumer is strong, but that strength paradoxically tightens the financial conditions equity markets need eased.
B. MARKET DATA -> TOP
Iran ceasefire-expiry anxiety drove a broad risk-off session, with the S&P 500 losing 0.63% and only Energy (+1.16%) finishing positive among 11 sectors as the Strait of Hormuz closure pushed Brent crude above $99. The selloff was unusually uniform — the Dow, Nasdaq, and Russell 2000 all fell 0.4–1.0% — while the curve steepened 7 bps as the 2Y yield plunged 6.9 bps, signaling the bond market is pricing slower growth rather than higher inflation. Individual stories cut both ways: UnitedHealth surged 7% on a Q1 earnings beat while GE Aerospace fell 5.6% despite beating estimates by 25%, as its own fuel-cost warnings crystallized the Hormuz-driven risk the broader tape was discounting. The dollar caught a safe-haven bid with DXY rising 0.32%, while gold sat flat — an unusual divergence suggesting the market sees this as a geopolitical shock, not an inflation catalyst.
CLOSING PRICES – April 21, 2026:
MAJOR INDICES
The selloff was broad and undiscriminating — Russell 2000 (-1.01%) led declines while Nasdaq (-0.42%) held up best, a rare inversion of the usual small-cap-outperforms-in-risk-off pattern. NYSE breadth confirmed the weakness at -0.98%, suggesting the move was genuine rather than index-weight-driven.
| Index | Close | Change | %Move | Why It Moved |
|---|---|---|---|---|
| S&P 500 | 7,064.01 | -45.13 | -0.63% | Iran ceasefire expiry fears; Strait of Hormuz remains closed ahead of Wednesday deadline |
| Dow Jones | 49,149.60 | -292.96 | -0.59% | Broad risk-off; GE Aerospace dragged blue-chips despite earnings beat |
| Nasdaq | 26,479.47 | -110.87 | -0.42% | AI/semiconductor names (AMD, ANET) offset Apple CEO-transition drag |
| Russell 2000 | 2,764.69 | -28.27 | -1.01% | Small-caps more exposed to geopolitical risk and rising energy costs |
| NYSE Composite | 22,951.97 | -226.38 | -0.98% | Broad decline confirming weak market internals; 10 of 11 sectors negative |
VOLATILITY & TREASURIES
The 2Y yield plunging 6.9 bps while the 10Y edged up 0.5 bps is a classic growth-scare steepening — the front end prices rate cuts while the long end reflects persistent supply and inflation concerns. VIX rose only modestly (+3.3%), suggesting hedged caution rather than panic.
| Instrument | Level | Change | Why It Moved |
|---|---|---|---|
| VIX | 19.50 | +0.63 (+3.34%) | Ceasefire-expiry uncertainty lifted hedging demand; contained below 20 |
| 10-Year Treasury Yield | 4.296% | +0.5 bps | Long-end held firm on supply concerns and persistent energy-driven inflation expectations |
| 2-Year Treasury Yield | 3.785% | -6.9 bps | Front-end rally on growth-scare bid; market repricing near-term rate-cut probability higher |
| US Dollar Index (DXY) | 98.41 | +0.31 (+0.32%) | Safe-haven dollar bid as geopolitical risk absorbed into FX rather than gold |
COMMODITIES
Gold’s near-flat close (-0.03%) on a risk-off day is notable — the safe-haven bid went to the dollar instead, not precious metals. Copper (-0.02%) and platinum (-0.09%) were similarly inert, confirming neither industrial demand panic nor a broad flight-to-quality trade in metals. Bitcoin fell 0.8% in line with risk assets.
| Asset | Price | Change | %Move | Why It Moved |
|---|---|---|---|---|
| Gold | $4,736.94/oz | -$1.61 | -0.03% | Flat as DXY strength offset geopolitical safe-haven demand |
| Silver | $76.91/oz | +$0.24 | +0.31% | Mild industrial bid; outperformed gold on relative value positioning |
| Copper | $6.016/lb | -$0.001 | -0.02% | Flat; geopolitical risk not yet translating into industrial demand concerns |
| Platinum | $2,043.75/oz | -$1.75 | -0.09% | Quiet session; neither safe-haven nor industrial catalyst |
| Bitcoin | $75,360 | -$607 | -0.80% | Correlated with equities risk-off; no crypto-specific catalyst |
ENERGY
The Brent-WTI spread blew out dramatically — Brent surged 3.75% toward $99 while WTI slipped 0.43%, a divergence confirming the Strait of Hormuz closure is a regional supply shock hitting international crude flows. Dutch TTF jumped 4% in sympathy while Henry Hub sat flat, reinforcing the European-supply-chain vulnerability.
| Asset | Price | Change | %Move | Why It Moved |
|---|---|---|---|---|
| Crude Oil (WTI) | $90.07/bbl | -$0.39 | -0.43% | US domestic crude insulated from Hormuz disruption; slight demand-side weakness |
| Crude Oil (Brent) | $99.06/bbl | +$3.58 | +3.75% | Strait of Hormuz closure threatens ~20% of global seaborne oil; ceasefire expires Wednesday |
| Natural Gas (Henry Hub) | $2.696/MMBtu | -$0.014 | -0.52% | US gas decoupled from crude; mild weather forecasts and ample domestic supply |
| Natural Gas (Dutch TTF) | $14.43/MMBtu | +$0.56 | +4.03% | European gas spiked on Hormuz-linked LNG supply fears; TTF-HH spread widened |
S&P 500 SECTORS
Healthcare’s structural decline deepened — the quarter’s worst (-4.54% 3M) is also YTD’s worst (-3.53%), confirming pipeline anxiety rather than a single-day event. Basic Materials reversed sharply: the 1-month leader (+14.67%) became today’s biggest loser (-2.59%), suggesting the recent commodity-driven rally is hitting profit-taking.
| Sector | 1-Day | 1-Week | 1-Month | 3-Month | 6-Month | YTD | 12-Month |
|---|---|---|---|---|---|---|---|
| Energy | +1.16% | -0.57% | -3.33% | +20.47% | +32.62% | +27.18% | +41.86% |
| Technology | -0.21% | +3.95% | +14.19% | +8.31% | +5.29% | +6.27% | +56.85% |
| Consumer Defensive | -0.57% | +0.41% | +2.54% | +1.32% | +4.79% | +6.73% | +4.72% |
| Consumer Cyclical | -1.00% | +1.85% | +11.42% | -1.16% | +0.23% | -1.43% | +27.34% |
| Financial | -1.04% | +0.40% | +8.36% | -1.12% | +4.05% | -2.23% | +20.92% |
| Industrials | -1.25% | -0.67% | +8.54% | +5.91% | +15.48% | +13.26% | +42.67% |
| Healthcare | -1.26% | -1.72% | +2.96% | -4.54% | +3.29% | -3.53% | +13.59% |
| Communication Services | -1.38% | -0.02% | +7.90% | +3.63% | +6.97% | +1.59% | +49.12% |
| Real Estate | -1.71% | +1.00% | +8.06% | +4.23% | +3.64% | +7.34% | +8.80% |
| Utilities | -1.82% | -3.16% | +2.44% | +4.65% | -0.02% | +6.16% | +19.55% |
| Basic Materials | -2.59% | -2.44% | +14.67% | +4.02% | +24.36% | +16.83% | +54.84% |
TOP MEGA-CAP MOVERS:
Selection criteria: US-listed companies with market cap above $200 billion that moved ±1.5% or more during the session. Movers are ranked by percentage change and capped at 5 gainers and 5 decliners. On muted trading days when fewer than 3 names meet the threshold, the largest moves are shown regardless. Moves driven by earnings, M&A, analyst actions, sector rotation, or macro catalysts are prioritized over low-volume or technical moves.
GAINERS
| Company | Ticker | Close | Change | Why It Moved |
|---|---|---|---|---|
| UnitedHealth Group | UNH | $346.01 | +6.96% | Q1 earnings beat; strong medical enrollment and Optum growth |
| Arista Networks | ANET | $172.86 | +3.60% | Susquehanna raised PT to $200; AI networking demand accelerating |
| Advanced Micro Devices | AMD | $284.49 | +3.47% | Stifel raised PT to $320; hit record high on AI infrastructure demand |
| Cisco Systems | CSCO | $89.70 | +2.27% | Networking/AI infrastructure sympathy rally with ANET and AMD |
| Oracle | ORCL | $181.17 | +2.02% | Cloud/AI infrastructure momentum; confirmed for Helios superclusters in Q3 |
DECLINERS
| Company | Ticker | Close | Change | Why It Moved |
|---|---|---|---|---|
| GE Aerospace | GE | $286.73 | -5.56% | Beat EPS by 25% but warned on fuel-price risk from Hormuz; Middle East conflict overshadowed results |
| RTX Corp | RTX | $187.17 | -4.40% | Beat and raised guidance but sold off on A&D sector rotation amid ceasefire uncertainty |
| Merck & Co | MRK | $112.56 | -3.88% | Phase 3 kidney cancer trial (LITESPARK-012) failed; pipeline concerns ahead of Keytruda patent cliff |
| Philip Morris International | PM | $153.25 | -2.73% | Pre-earnings selling ahead of April 22 report; softer 2026 outlook concerns |
| Apple | AAPL | $266.17 | -2.52% | CEO transition: Tim Cook stepping down, John Ternus named successor effective September 1 |
C. HIGH-IMPACT STORIES -> TOP
BEARISH
1. Iran Ceasefire Deadline Looms Wednesday — Oil Surges Toward $100 as Strait of Hormuz Remains Blocked
The core facts:The two-week U.S.-Iran ceasefire is set to expire Wednesday evening. President Trump told CNBC he is not interested in extending the truce and expects to secure a deal but is “ready to resume the war” if negotiations fail. Vice President Vance’s trip to Pakistan for peace talks was paused after Tehran signaled a lack of commitment. Iran’s foreign minister condemned the ongoing U.S. naval blockade as “an act of war and thus a violation of the ceasefire.” WTI crude settled at $92.13/bbl (+2.81%) and Brent closed at $98.48/bbl (+3.14%). The VIX spiked 8% to 18.87.
Why it matters:The Strait of Hormuz handles roughly 20% of global oil flows. Its continued closure is already distorting energy markets — March retail sales were inflated by a record 15.5% surge in gas station receipts. If the ceasefire lapses without a deal, oil analysts warn prices could approach $200/bbl under a prolonged Hormuz shutdown, forcing demand destruction and tightening financial conditions globally. The energy cost shock is compressing corporate margins across non-energy sectors and feeding directly into inflation expectations that are pushing rate cuts further out.
What to watch:Wednesday evening ceasefire expiry. VP Vance travel plans to Pakistan as a signal of negotiation progress. Brent crude’s proximity to the psychologically significant $100/bbl level.
UNCERTAIN
2. Apple CEO Tim Cook to Step Down September 1 — John Ternus Named Successor
The core facts:Apple announced that Tim Cook will become Executive Chairman effective September 1, 2026, with John Ternus, SVP of Hardware Engineering, succeeding him as CEO. The transition was approved unanimously by the Board. Ternus, 50, joined Apple in 2001 and led key hardware launches including iPad, AirPods, and multiple generations of iPhone and Mac. AAPL fell 2.52% on the news. Wall Street maintained buy ratings — Wedbush ($350 target), Citi ($315), Morgan Stanley ($315) — though Wedbush’s Dan Ives called the timing a “shocker” that would put “even more pressure on Apple to produce success at WWDC with AI front and center.”
Why it matters:Apple is the world’s most valuable public company (~$3.5T market cap). CEO transitions at this scale are exceedingly rare and historically generate uncertainty — Cook himself presided over more than $2 trillion in market cap creation. Ternus inherits critical challenges: executing an AI strategy that has lagged competitors, navigating China manufacturing risk, managing tariff exposure, and maintaining the services growth engine. The transition comes ahead of WWDC, where Apple’s AI roadmap will face intense scrutiny under new leadership.
What to watch:Apple earnings April 30 — Cook’s final report as CEO. WWDC 2026 for the AI strategy rollout under Ternus.
UNCERTAIN
3. Fed Chair Nominee Warsh Vows Independence, Advocates “Regime Change” at the Fed
The core facts:Kevin Warsh testified before the Senate Banking Committee in his confirmation hearing to succeed Jerome Powell as Fed Chair. He rejected concerns about presidential influence, stating he would be “an independent actor” and not anyone’s “sock puppet.” Warsh advocated a “regime change” in Fed communication — moving away from forward guidance toward trimmed mean inflation measures. Committee Democrats questioned his historical inflation hawkishness. Sen. Thom Tillis (R-NC) vowed to block the confirmation vote until the DOJ drops its criminal investigation of Powell and the current Fed — creating a significant procedural roadblock unrelated to Warsh himself.
Why it matters:A Warsh-led Fed would likely adopt a more hawkish reaction function and reduce the forward guidance that markets have relied on for years. Scrapping explicit rate-path signaling would increase volatility around FOMC meetings and force markets to price policy through data rather than dot plots. The Tillis blockade — requiring DOJ action on an unrelated investigation — injects political uncertainty into the succession timeline. Markets are already pricing in a higher-for-longer rate regime; a confirmed Warsh would cement that view.
What to watch:Tillis/DOJ resolution timeline. Senate Banking Committee vote scheduling. FOMC decision April 29 — Powell’s last meetings are now a defined countdown.
UNCERTAIN
4. March Retail Sales Surge 1.7% — Record Gas Station Receipts Mask Modest Core Spending
The core facts:U.S. retail and food services sales rose 1.7% month-over-month in March to $752.1 billion, beating the 1.4% consensus estimate. Year-over-year growth was 4.0%. Gasoline station receipts surged 15.5% — the largest monthly gain since the Census Bureau began tracking the series in 1992 — driven by Iran war-related fuel price spikes. Excluding gas, autos, building materials, and food services, core retail sales rose a more modest 0.7%. The 10-year Treasury yield climbed to 4.28% (+2 bps). CME FedWatch shows rate cut probability fell to roughly 40% for any cut in 2026, down from 50% on Friday.
Why it matters:The headline number looks robust but is significantly distorted by energy prices — the retail sales report is not inflation-adjusted, so much of the “growth” reflects higher pump prices rather than increased consumer volume. Core sales at +0.7% suggest the consumer is resilient but not overheating. However, the bond market took the headline at face value: yields rose, rate cut expectations were slashed, and the “higher for longer” narrative strengthened. For equity markets, the rate repricing matters more than the spending data — fewer cuts mean tighter financial conditions that compress growth stock valuations.
What to watch:FOMC decision April 29. April CPI (mid-May) for the inflation trajectory. Next retail sales release (mid-May) to determine whether gas-station inflation persists or fades with oil prices.
BULLISH
5. Amazon Invests Up to $25 Billion in Anthropic, Deepening AI Infrastructure Partnership
The core facts:Amazon agreed to invest up to $25 billion in Anthropic on top of the $8 billion already deployed, making the total commitment up to $33 billion. The deal includes $5 billion immediately, with up to $20 billion tied to commercial milestones. In return, Anthropic committed to spending more than $100 billion over 10 years on AWS technologies and will secure up to 5 gigawatts of compute capacity using Trainium2 and Trainium3 chips. AWS customers gain integrated access to Anthropic’s Claude platform. AMZN rose approximately 2.2% on the news.
Why it matters:This is the largest single AI infrastructure deal announced to date and arrives just two months after Amazon agreed to invest up to $50 billion in OpenAI — signaling an extraordinary acceleration in hyperscaler AI capital deployment. The deal reinforces Amazon’s position in the AI arms race against Microsoft/OpenAI and Google/DeepMind. JPMorgan separately cited AI-led earnings strength (including Anthropic’s Claude Mythos model) as the basis for raising its S&P 500 target to 7,600. The AI capex cycle is now the primary earnings growth driver for mega-cap tech.
What to watch:Amazon Q1 earnings April 28 for AWS AI revenue trajectory. Anthropic’s compute buildout milestones. Competitive response from Microsoft and Google.
D. MODERATE-IMPACT STORIES -> TOP
BULLISH
6. JPMorgan Raises S&P 500 Year-End Target to 7,600 on AI-Driven Earnings Strength
The core facts:Strategist Dubravko Lakos-Bujas raised JPMorgan’s 2026 year-end S&P 500 target to 7,600 from 7,200, implying roughly 7% upside from Monday’s close of 7,109. The 2026 EPS estimate was lifted to $330 from $315 (+22% YoY), with 2027 EPS raised to $385 from $355 (+17% YoY). The forward P/E multiple was held steady at 22x — the entire upgrade was driven by stronger earnings expectations, not by asking investors to pay a richer multiple. JPMorgan cited AI momentum reignited by Anthropic’s Claude Mythos model and robust tech sector earnings as primary drivers.
Why it matters:JPMorgan is the largest U.S. bank; its target revisions reflect institutional conviction and influence client positioning. The earnings-driven (not multiple-driven) nature of the upgrade is a healthier basis for the bull case — it means the target is grounded in fundamentals rather than sentiment expansion. However, JPMorgan flagged “meaningful risk” of a short-term consolidation before the market resumes its upward trajectory.
What to watch:Q1 mega-cap tech earnings next week (MSFT, GOOGL, META, AMZN) to validate the AI-earnings thesis underlying the upgrade.
BEARISH
7. U.S. Signals Tariffs “Here to Stay” in USMCA Talks with Mexico
The core facts:U.S. officials informed Mexican industry leaders that tariffs imposed by the Trump administration will remain in place even as negotiations to revise the USMCA intensify ahead of a July 2026 review deadline. Washington is pushing for stricter rules of origin, including proposals requiring 100% North American sourcing for key components such as engines and electronics, up from the current ~75% threshold. Mexico is seeking tariff relief, particularly in the auto and steel sectors, but a full rollback to a zero-tariff framework is off the table. The USMCA underpins approximately $1.6 trillion in annual trilateral trade.
Why it matters:Sustained tariffs on Mexican imports directly affect U.S. auto manufacturers, industrial companies, and agricultural exporters that rely on North American supply chains. Tighter rules of origin would force reshoring of component production — raising costs in the near term but potentially benefiting U.S. manufacturing employment. For portfolio managers, the risk is margin compression in auto (GM, F, STLA) and industrial sectors, with the July deadline creating a catalyst for sector volatility.
What to watch:USMCA formal review sessions ahead of the July deadline. Auto sector earnings guidance for tariff-impact quantification.
BEARISH
8. Nasdaq Reaches Fourth Intraday All-Time High in Five Sessions, Fails to Hold Gains
The core facts:The Nasdaq Composite touched approximately 24,538 intraday — its fourth all-time high in five sessions — before reversing sharply in afternoon trading to close at 24,260, down 0.59%. The S&P 500 erased an early 400-point Dow gain as risk appetite faded into the close. The reversal was driven by afternoon selling tied to Iran ceasefire uncertainty, deteriorating rate-cut expectations, and elevated crude oil volatility that tightened financial conditions intraday.
Why it matters:The persistent pattern of reaching new highs and reversing each session is a classic distribution signal — sellers are emerging at resistance near 24,500. Despite strong AI and tech tailwinds, the index has been unable to sustain closes above that level, suggesting exhaustion at current valuations. For technically oriented portfolio managers, this “failure at the highs” pattern often precedes consolidation or a corrective pullback, especially when combined with rising oil prices and tightening rate expectations.
What to watch:Whether the Nasdaq can sustain a close above 24,500. Q1 mega-cap tech earnings next week as a potential catalyst to break through resistance.
BULLISH
9. HSBC Upgrades Intel to Buy with $95 Price Target on Server CPU Growth Outlook
The core facts:HSBC analyst Frank Lee upgraded Intel (INTC) from Hold to Buy and raised the price target from $50 to $95, citing underappreciated server CPU momentum expected to materialize in Q2 2026. HSBC’s Q2 revenue estimate of $14.2 billion is 9% above the $13.1 billion consensus. Separately, KeyBanc reiterated Intel as a top semiconductor pick, expecting a broad sector recovery through 2027. INTC rose approximately 2% to $66.89 on the upgrades. The stock is up 80% year-to-date, though HSBC’s $95 target remains well above the $52 analyst consensus.
Why it matters:Intel’s turnaround narrative is gaining institutional credibility at a critical moment. The server CPU recovery thesis — driven by enterprise AI infrastructure buildout and data center refresh cycles — could benefit the broader semiconductor ecosystem beyond just GPU makers. HSBC’s $95 target, nearly double the consensus, signals conviction in an earnings inflection that most of the Street has yet to price in. For investors positioned in the semiconductor supply chain, this upgrade raises the question of whether Intel’s rally has further room or is already pricing in the recovery.
What to watch:Intel earnings (Q2 report). Server CPU shipment data through the first half. AMD’s competitive response in the data center segment.
BULLISH
10. Pending Home Sales Rise 1.5% in March, Triple the Consensus Estimate
The core facts:The NAR Pending Home Sales Index rose 1.5% month-over-month in March to a four-month high of 73.7, well above the 0.5% consensus estimate. This marked the second consecutive monthly increase, following a 1.8% rise in February. Year-over-year pending sales declined 1.1%. Gains were concentrated in the Northeast and South, while the Midwest and West posted declines. NAR Chief Economist Lawrence Yun noted that “contract signings rose in March despite higher mortgage rates, pointing to pent-up housing demand” and that improving inventory is helping translate demand into transactions.
Why it matters:Pending home sales are a leading indicator for the housing sector. The fact that contract signings are rising despite mortgage rates above 7% suggests genuine pent-up demand and buyer adaptation to the higher-rate environment. If rates decline — an outcome that became less likely today given the retail sales data — housing activity could accelerate meaningfully. For equity positioning, homebuilders (DHI reported today), mortgage lenders, and home improvement retailers all benefit from an improving housing trajectory.
E. ECONOMY WATCH -> TOP
Consumer resilience dominated today’s data: retail sales surged 1.7% in March — the strongest monthly gain in over three years — while pending home sales beat expectations by 15x despite 6.5% mortgage rates. The control group, stripping gas, autos, and building materials, still rose 0.7% vs. 0.2% expected, confirming genuine spending momentum the oil shock hasn’t yet crushed. ADP weekly hiring posted its fifth straight improvement, reinforcing labor market strength. Against this resilience, the day’s Fed drama underscored deeper uncertainty — Warsh called inflation “a choice” and pledged a framework overhaul at his Senate hearing, while Waller defended regional bank independence ahead of Powell’s May 15 departure. Markets price continued growth; the institutional recession consensus (Goldman 30%, Moody’s 49%) remains less sanguine.
Retail Sales Surge 1.7% in March, Strongest Monthly Gain in Over Three Years (Census Bureau, April 21)
What they’re saying:Advance estimates of U.S. retail and food services sales for March reached $752.1 billion, up 1.7% from February and 4.0% year-over-year — the largest monthly increase since January 2023. The retail sales control group, the Fed’s preferred consumer spending gauge, rose 0.7% vs. 0.2% expected. Sales excluding autos jumped 1.9%, with nonstore retailers up 10.1% year-over-year.
The context:The blowout print undercuts fears that the oil shock would crater consumer spending. A meaningful portion of the surge reflects higher gasoline receipts, but the control group beat confirms genuine spending momentum beyond fuel — suggesting the consumer remains a stabilizing force for Q2 GDP. The release was rescheduled from April 16, adding extra anticipation to an already closely watched report.
What to watch:April retail data (mid-May release) for whether fuel-driven spending begins crowding out discretionary categories. Michigan Consumer Sentiment final reading Friday (expected 47.6, near record lows) will test whether spending behavior has diverged from collapsing confidence.
Pending Home Sales Beat Expectations by 15x, Rise 1.5% as Supply Improves (NAR, April 21)
What they’re saying:The Pending Home Sales Index rose 1.5% in March to 73.7, crushing the 0.1% consensus forecast and marking the second consecutive monthly gain. The Northeast (+4.4%) and South (+3.9%) led regional gains, while the Midwest (-1.3%) and West (-2.6%) pulled back. NAR Chief Economist Lawrence Yun noted that “contract signings rose despite higher mortgage rates, pointing to pent-up housing demand.”
The context:The beat is notable given the 30-year mortgage rate averaged 6.5% during March — the highest since August. Improving inventory levels are helping bridge the affordability gap, giving buyers more options and negotiating power. Year-over-year, pending sales declined 1.1%, indicating the housing recovery remains uneven, but the monthly trajectory suggests pent-up demand is overcoming rate headwinds as listings rise.
What to watch:MBA mortgage applications Wednesday for real-time demand signals. Housing starts data (delayed to April 29 from April 17) will reveal whether builders are responding to improving demand.
ADP Weekly: Private Hiring Posts Fifth Straight Improvement, Averaging 54,750 Jobs (ADP, April 21)
What they’re saying:U.S. private employers added an average of 54,750 jobs per week over the four weeks ending April 4, according to the ADP National Employment Report’s weekly pulse. The figure represents a 36% increase from the prior period’s 40,250 and marks the fifth consecutive weekly improvement in hiring.
The context:The steady improvement in weekly hiring contradicts recession narratives and suggests the labor market is absorbing the oil shock without significant damage. The weekly ADP pulse provides a more timely employment read than the monthly payrolls report, and the sustained upward trajectory is a positive signal for consumer income and spending power heading into Q2.
What to watch:Initial jobless claims Thursday (expected 212K vs. prior 207K). The monthly ADP National Employment Report and April nonfarm payrolls (early May) for broader confirmation of the hiring trend.
Warsh Calls Inflation “a Choice,” Pledges Fed Framework Overhaul at Senate Hearing (Senate Banking Committee, April 21)
What they’re saying:Fed Chair nominee Kevin Warsh told the Senate Banking Committee that “inflation is a choice” for which the Fed must be held accountable. He signaled he would abandon core PCE as the Fed’s preferred inflation measure in favor of trimmed mean gauges, calling PCE “a rough swag.” Warsh pledged a “regime change” including dropping forward guidance, and declared he would “absolutely not” be Trump’s “sock puppet,” stating the president never asked him to commit to any rate decision.
The context:The hearing exposed a contested confirmation path. Sen. Tillis is blocking the nomination in committee over an unrelated investigation into current Chair Powell, while Sen. Warren criticized Warsh’s shifting stance as evidence he would take direction from the White House. Republicans hold a 12-10 advantage, meaning one dissent blocks confirmation. If confirmed, Warsh would inherit the Fed as inflation runs above target (CPI 3.3% annual) and recession probabilities cluster at 30-49% across major institutions.
What to watch:Senate Banking Committee vote timing and Tillis’s resolution of the Powell investigation. FOMC May meeting — likely Powell’s last as chair, with his term expiring May 15.
Waller Backs Regional Bank Independence, Would “Absolutely” Oppose Firing Presidents Over Rate Disputes (Federal Reserve / Brookings, April 21)
What they’re saying:Fed Governor Christopher Waller, speaking at the Brookings Institution, said he would “absolutely” oppose any effort to fire Federal Reserve regional bank presidents over disagreements on interest rate policy. Separately, he proposed centralizing Reserve Bank operations — HR, IT, and procurement — into national lines of business rather than maintaining separate infrastructure at each of the 12 regional banks. Waller did not comment on the economic outlook, citing the Fed’s blackout period ahead of next week’s policy meeting.
The context:Waller’s defense of regional bank independence arrives on the same day as Warsh’s contentious confirmation hearing, underscoring heightened scrutiny of Fed governance during an unusually fraught leadership transition. The operational reform proposal signals that even current officials see a need for institutional modernization. The blackout silence on monetary policy is itself notable — the market widely expects a hold at the May FOMC meeting, with the fed funds rate at 3.50-3.75%.
Business Inventories Rise 0.4% in February, Signaling Restocking After January Drawdown (Census Bureau, April 21)
What they’re saying:U.S. business inventories rose 0.4% in February to a seasonally adjusted $2,686.8 billion, slightly above the 0.3% consensus estimate. The increase reversed January’s 0.1% decline, suggesting businesses are rebuilding stockpiles after a brief period of destocking.
The context:The modest beat suggests firms are cautiously restocking, which could reflect anticipation of continued consumer demand — supported by today’s strong retail sales data — or preemptive tariff-related front-loading. Inventory dynamics matter for GDP: rising inventories add to growth in the quarter they’re built but can subtract later if demand softens. With retail sales surging 1.7% in March, the restocking appears well-timed rather than involuntary.
F. EARNINGS WATCH -> TOP
Selection criteria: This section covers only market-moving earnings from large-cap companies (>$50B market cap) with sector significance or systemic implications. The S&P 500 scorecard above tracks all 500 index components, but individual stories below focus on names large enough to move markets and provide economic signals relevant to US large-cap portfolio managers. On any given day, 30-80+ companies may report earnings, but MIB filters for the 2-5 names most relevant to institutional investors.
YESTERDAY AFTER THE BELL (Markets Reacted Today)
No major earnings yesterday after the bell from companies with >$50B market cap.
TODAY BEFORE THE BELL (Markets Already Reacted)
BULLISH
11. UnitedHealth Group (UNH): +6.96% | Beats on All Metrics, Raises Full-Year Guidance
The Numbers:Revenue $111.7B (+2% YoY) vs. $109.4B est. Adjusted EPS $7.23 vs. $6.58 est. (+9.9% surprise). GAAP EPS $6.90 vs. $6.32 est. Medical care ratio improved 90 basis points to 83.9%. Full-year adjusted EPS guidance raised to >$18.25 from >$17.75. Released: BMO
The Problem/Win:The win was decisive across both segments. UnitedHealthcare served 49.1 million consumers and expanded operating margins 40 bps to 6.6%. Optum supported 122+ million consumers with revenues of $63.7B and a 5.2% margin. The medical care ratio improvement — driven by strong cost management and favorable reserve development — was the headline for investors who had feared runaway medical costs.
The Ripple:The result lifted the entire managed care sector. Elevance Health (ELV) gained 3-4%, Humana (HUM) surged ~5%, and Molina Healthcare (MOH) also rallied. Bank of America raised its ELV price target to $405 from $385. The broad rally signals that investor fears about structural medical cost inflation in managed care may be moderating.
What It Means:UNH’s beat-and-raise confirms the managed care sector is navigating the post-pandemic utilization surge better than feared. The combination of CMS’s favorable 2027 Medicare Advantage rate decision and now-strong operator execution rebuilds the investment case for managed care names that were heavily sold in 2025.
What to watch:Elevance Health (ELV) earnings Wednesday BMO for confirmation of the positive sector read-through.
UNCERTAIN
12. GE Aerospace (GE): -5.56% | Blowout Beat Overshadowed by Margin Compression and Flat Guidance
The Numbers:Revenue $11.61B (+8.4% vs. est.) vs. $10.71B est. Adjusted EPS $1.86 vs. $1.60 est. (+16.3% surprise). GAAP EPS $1.83 vs. $1.68 est. Orders surged 87% YoY. Full-year guidance reaffirmed but not raised despite the strong Q1. Released: BMO
The Problem/Win:The numbers were outstanding — Commercial Engines & Services revenue rose 34% to $8.9B with orders up 93%. But operating margins declined 200 basis points due to strategic investments and inflation, and management’s decision to merely reaffirm (not raise) full-year guidance after a 16% EPS beat signaled caution. Management flagged the Middle East conflict as the biggest near-term external variable, creating a ceiling on confidence.
The Ripple:GE Aerospace’s sell-off contributed to broader pressure on the industrials and defense sector. The -5.56% decline in a ~$300B company removed billions in market cap and weighed on the Dow, where GE is a component.
What It Means:At a P/E of ~38x, the market is demanding more than just beats — it needs guidance raises and margin expansion. GE’s Q1 shows the commercial aerospace cycle remains strong, but investors are wary of paying a premium when margins are going the wrong direction and geopolitical risk threatens the demand outlook.
What to watch:Iran ceasefire outcome for the “biggest near-term variable.” Q2 margin trajectory and whether management raises guidance after digesting the Middle East situation.
UNCERTAIN
13. RTX Corporation (RTX): -4.40% | Beat and Raised, But Defense Rally Already Priced In
The Numbers:Revenue $22.08B (+2.9% vs. est.) vs. $21.46B est. Adjusted EPS $1.78 vs. $1.51 est. (+17.5% surprise). GAAP EPS $1.51 vs. $1.21 est. (+24.4%). Organic sales growth across all three segments. Full-year adjusted sales and EPS guidance raised. Released: BMO
The Problem/Win:RTX delivered across all segments: Raytheon saw a 40% YoY increase in munitions deliveries (12 consecutive quarters of material receipt growth), Collins Aerospace posted 15% commercial OE growth, and Pratt & Whitney expanded margins 70 bps despite a 50 bps tariff headwind. The problem is the stock had already rallied significantly on the Iran war premium. The sell-off reflects classic “buy the rumor, sell the news” dynamics amplified by emerging Iran peace prospects that could reduce defense spending urgency.
The Ripple:RTX’s sell-off alongside GE Aerospace and NOC created a sector-wide pattern of defense names declining despite operational strength, contributing to the broader industrials weakness on the session.
What It Means:For defense investors, the question is whether the 2026 rally was driven by sustainable fundamentals (record backlogs, accelerating deliveries) or a geopolitical risk premium that could evaporate with an Iran deal. Today’s sell-off suggests the market sees at least some of the premium as borrowed time.
What to watch:Iran ceasefire outcome. Congressional defense budget trajectory independent of Iran. Boeing (BA) and GE Vernova (GEV) earnings Wednesday for sector cross-read.
BEARISH
14. Northrop Grumman (NOC): -6.98% | Modest Beat Undercut by Massive Cash Burn and Space Systems Charge
The Numbers:Revenue $9.88B (+1.3% vs. est.) vs. $9.75B est. EPS $6.14 vs. $6.06 est. (+1.4% surprise). GAAP EPS $6.14 vs. $6.05 est. Revenue up 4% YoY. Full-year guidance reaffirmed but not raised. Operating cash flow was a use of $1.66B; free cash flow was a use of $1.82B. Released: BMO
The Problem/Win:The headline beat was thin (+1.4% on EPS), and the real damage was below the surface. The $1.82 billion quarterly cash burn alarmed investors accustomed to defense contractors generating robust free cash flow. An unfavorable program adjustment in the Space Systems segment added to concerns. Management merely reaffirmed guidance despite the strong defense spending backdrop — a cautious posture that suggests internal challenges the market hadn’t fully appreciated.
The Ripple:NOC’s -6.98% drop was the worst performance among the major defense primes on the day. The sell-off added to the narrative that defense stocks may be overvalued after their 25-30% YTD rallies, even with strong demand tailwinds.
What It Means:NOC’s cash burn suggests the company is investing heavily in next-generation programs (B-21 Raider, Sentinel ICBM) that consume cash before generating returns. While strategically sound long-term, the near-term FCF weakness undermines the capital return story that had supported the premium valuation. Investors need to see cash flow normalization before re-engaging.
What to watch:Q2 free cash flow trajectory. Space Systems program progress. 2027 defense budget proposals.
UNCERTAIN
15. 3M Company (MMM): -1.94% | Adjusted Beat Masked by -37% GAAP Miss on Legacy Charges
The Numbers:Revenue $6.00B (-0.09% vs. est.) vs. $6.01B est. Adjusted EPS $2.14 vs. $1.98 est. (+8.1% surprise). GAAP EPS $1.23 vs. $1.97 est. (-37.4% miss). The massive GAAP gap was driven by changes in Solventum ownership valuation and PFAS-related costs. Full-year outlook reaffirmed. Released: BMO
The Problem/Win:On an adjusted basis, 3M continued its operational turnaround with EPS up 14% YoY and Safety & Industrial sales increasing. But the GAAP results tell a different story — legacy liabilities from the Solventum spin-off and ongoing PFAS remediation costs continue to weigh on reported earnings. The -37% GAAP miss was eye-catching even for investors accustomed to 3M’s adjusted/GAAP disconnect.
The Ripple:The stock’s modest -1.94% decline suggests the market largely looked through the GAAP noise to the adjusted beat. However, the persistent gap between adjusted and GAAP earnings raises questions about when legacy liabilities will stop distorting the earnings picture.
What It Means:3M’s operational improvement is real but still obscured by legacy overhang. Until PFAS and Solventum costs are fully resolved, the stock will trade at a discount to its adjusted earnings power. The adjusted beat supports the turnaround thesis, but the -37% GAAP miss is a reminder that the cleanup is far from over.
UNCERTAIN
16. Danaher Corporation (DHR): -0.49% | Biotech Rebound Offsets Diagnostics Weakness; Masimo Acquisition Announced
The Numbers:Revenue $5.95B (-0.5% vs. est.) vs. $5.98B est. Adjusted EPS $2.06 vs. $1.94 est. (+6.4% surprise). GAAP EPS $1.45 vs. $1.61 est. (-9.7% miss). Revenue up 3.5% YoY. Core revenue growth 0.5%. Released: BMO
The Problem/Win:The Biotechnology segment was the bright spot with 7% core sales growth and margin expansion to 29.7%, driven by stronger bioprocessing consumables demand and equipment orders up 30%+. However, Diagnostics core sales fell 4% as respiratory testing softened and China pricing pressure weighed, pulling margins to 27.9%. Separately, Danaher announced a $9.9 billion cash acquisition of Masimo Corporation, a patient monitoring specialist, to be added to the Diagnostics segment.
The Ripple:The minimal stock reaction (-0.49%) reflects a market that sees the biotech recovery as encouraging but offset by diagnostics headwinds. The Masimo deal adds a new strategic dimension but will take quarters to integrate.
What It Means:Danaher’s bioprocessing recovery confirms the biotech manufacturing cycle is inflecting after a prolonged destocking period. The Masimo acquisition signals management’s intent to address the diagnostics weakness through inorganic growth. For life sciences investors, the bioprocessing data is the most actionable signal from this report.
TODAY AFTER THE BELL (Markets React Tomorrow)
BULLISH
17. Intuitive Surgical (ISRG): AMC — Reaction Tomorrow | Double Beat on Record Da Vinci Procedures
The Numbers:Revenue $2.77B (+5.8% vs. est.) vs. $2.62B est. Revenue up 23% YoY. Adjusted EPS $2.50 vs. $2.12 est. (+17.9% surprise). GAAP EPS $2.28 vs. $1.97 est. Da Vinci procedures grew ~16%, Ion procedures grew ~39%. 431 da Vinci systems placed including 232 da Vinci 5 units. Released: AMC
The Problem/Win:A comprehensive win. The 17.9% EPS beat was driven by accelerating procedure volumes, strong da Vinci 5 placement momentum, and expanding instruments & accessories revenue (+23% to $1.69B). The Ion platform for lung biopsies continues to gain traction at +39% procedure growth. The installed base expanded to 11,395 da Vinci and 1,041 Ion systems. Full-year guidance calls for 13.5-15.5% procedure growth and 67.5-68.5% gross margins.
The Ripple:ISRG’s strong results are positive for the broader medtech sector and validate continued hospital capex spending on robotic surgery platforms despite cost pressures elsewhere in healthcare.
What It Means:Intuitive Surgical continues to operate in a class of its own in robotic surgery. The da Vinci 5 adoption cycle is accelerating, and the Ion platform is adding a second growth vector. At $160B market cap, the stock trades at a premium, but the procedure growth and installed base expansion justify the multiple for medtech investors.
What to watch:Wednesday’s stock reaction. Boston Scientific (BSX) earnings Wednesday for medtech sector confirmation.
UNCERTAIN
18. Chubb Limited (CB): AMC — Reaction Tomorrow | Record Underwriting Profits, But GAAP Miss on Portfolio Losses
The Numbers:Net premiums written $14.0B (+10.7% YoY). Core operating EPS $6.82 vs. $6.60 est. (+3.3% surprise), up 85% YoY. GAAP EPS $5.88 vs. $6.65 est. (-11.5% miss). P&C combined ratio 84.0% (vs. 95.7% prior year). Revenue $14.01B vs. $13.56B est. After-tax net realized and unrealized investment losses of $1.94B. Released: AMC
The Problem/Win:Operationally, this was an exceptional quarter. The P&C combined ratio of 84% is among the best in the industry, and underwriting income of $1.79B was strong. Life insurance premiums surged 33%. However, $1.94 billion in unrealized investment portfolio losses — driven by market volatility — created a jarring GAAP miss. The divergence between operational excellence and reported earnings reflects portfolio mark-to-market noise, not fundamental weakness.
The Ripple:Chubb’s underwriting results are positive for the broader P&C insurance sector, suggesting favorable pricing and low catastrophe losses in Q1. Other insurers may see similar trends.
What It Means:Investors who can look through the unrealized portfolio losses will see one of the best underwriting quarters in recent memory. The key question is whether the investment portfolio losses reverse in Q2 as markets stabilize. For insurance-sector investors, the core operating performance confirms Chubb’s pricing power and risk selection remain best-in-class.
BEARISH
19. Capital One Financial (COF): AMC — Reaction Tomorrow | Misses on EPS and Revenue as NIM Compresses
The Numbers:Revenue $15.23B (-0.8% vs. est.) vs. $15.36B est. Adjusted EPS $4.42 vs. $4.50 est. (-1.9% miss). GAAP EPS $3.34 vs. $3.89 est. (-14.2% miss). Net income $2.2B. Net interest margin 7.87%, down 39 basis points. Credit-loss provisions $4.1B. CET1 ratio 14.4%. Released: AMC
The Problem/Win:Capital One missed on both EPS and revenue, with net interest margin compression of 39 basis points signaling that the higher-rate environment is pressuring funding costs faster than asset yields can adjust. Credit provisions remained elevated at $4.1B, reflecting ongoing normalization in consumer credit quality. The Discover integration (completed May 2025) continues to drive scale but has yet to deliver meaningful margin benefits. The efficiency ratio of 55.57% suggests room for cost optimization.
The Ripple:COF’s NIM compression and elevated credit provisions raise questions for the broader consumer credit sector ahead of earnings from other card issuers and consumer lenders.
What It Means:The consumer credit cycle continues to normalize after the post-pandemic boom. For large-cap financials, NIM compression in a flat-to-rising rate environment is a warning sign — it suggests deposit costs are increasing while loan yields plateau. The Discover merger was supposed to create scale efficiencies; the market will want to see those materialize in coming quarters.
What to watch:Wednesday’s stock reaction. Other consumer credit earnings (SYF reported today at a smaller scale). Consumer delinquency trends in Q2.
WEEK AHEAD PREVIEW:
Q1 2026 earnings season is accelerating rapidly — only 10% of S&P 500 companies have reported, but the pace picks up dramatically this week with massive days ahead. Tomorrow alone features 15+ names with market caps above $50B.
Tesla (TSLA) — AMC, Wednesday April 22 — $1.45T market cap. EPS est. $0.36, Rev est. $22.3B. The most-watched report of the week. Investors focused on auto delivery trajectory, energy storage growth, AI/FSD monetization, and Elon Musk’s time allocation amid political activity. Expect extreme volatility.
GE Vernova (GEV) — BMO, Wednesday April 22 — $267B market cap. EPS est. $1.95, Rev est. $9.25B. Critical read on the power generation and electrification cycle. Grid infrastructure spending and gas turbine demand are key themes.
IBM (IBM) — AMC, Wednesday April 22 — $240B market cap. EPS est. $1.81, Rev est. $15.6B. Focus on consulting revenue trajectory and enterprise AI adoption through WatsonX. Software segment growth is the key metric.
Philip Morris International (PM) — BMO, Wednesday April 22 — $239B market cap. EPS est. $1.83, Rev est. $9.9B. IQOS and ZYN nicotine pouch volumes drive the growth story. Regulatory developments in smoke-free products are key.
Texas Instruments (TXN) — AMC, Wednesday April 22 — $212B market cap. EPS est. $1.36, Rev est. $4.5B. Bellwether for the analog semiconductor cycle. Industrial and automotive end-market commentary will signal broader capex trends.
AT&T (T) — BMO, Wednesday April 22 — $181B market cap. EPS est. $0.55, Rev est. $31.3B. Subscriber growth, fiber buildout pace, and wireless ARPU trends are the key focus areas.
Boeing (BA) — BMO, Wednesday April 22 — $172B market cap. EPS est. -$0.68, Rev est. $21.9B. Delivery ramp progress and cash burn trajectory are critical after years of operational setbacks. Commercial aircraft production rates will dominate the call.
ServiceNow (NOW) — AMC, Wednesday April 22 — $105B market cap. EPS est. $0.97, Rev est. $3.75B. Enterprise software bellwether. AI-driven workflow automation revenue growth is the primary metric.
Lam Research (LRCX) — AMC, Wednesday April 22 — $323B market cap. EPS est. $1.36, Rev est. $5.75B. Semiconductor equipment bellwether. Wafer fabrication equipment spending trends signal the trajectory of the chip investment cycle.
Week of April 28 brings the mega-cap tech gauntlet: Alphabet (GOOGL), Microsoft (MSFT), Meta Platforms (META), and Amazon (AMZN) — collectively representing over $10 trillion in market cap. Their AI investment commentary and cloud revenue growth will set the tone for the market’s second-half trajectory.
G. WHAT’S NEXT -> TOP
UPCOMING RELEASES:
| Date | Event | Why It Matters |
|---|---|---|
| Wed, Apr 22 | Iran Ceasefire Deadline (evening) | Binary event for crude oil, defense equities, and cross-asset positioning; Brent near $100 could spike sharply on lapse |
| Wed, Apr 22 | MBA 30-Year Mortgage Rate | Real-time housing demand signal; tests whether pending home sales momentum persists despite rate headwinds |
| Thu, Apr 23 | Initial Jobless Claims (exp. 212K, prior 207K) | Weekly labor market pulse; uptick above 220K would signal oil-shock employment effects beginning |
| Thu, Apr 23 | Chicago Fed National Activity Index (Mar, prior -0.11) | Broad 85-indicator economic activity gauge; negative reading reinforces growth-scare bond positioning |
| Fri, Apr 24 | Michigan Consumer Sentiment Final (Apr, exp. 47.6, prior 53.3) | Near-record low expected; critical test of whether collapsing confidence translates into actual spending pullback |
| Tue, Apr 29 | FOMC Rate Decision (exp. hold at 3.50-3.75%) | Likely Powell’s final meeting as Chair before May 15 departure; any hawkish shift amplifies higher-for-longer narrative |
KEY QUESTIONS:
1. Will the Iran ceasefire expire without a deal Wednesday, and if so, how quickly does Brent breach $100 — the level at which demand destruction and recession risk accelerate sharply?
2. Can the Nasdaq sustain a close above 24,500 resistance, or will repeated reversals at the highs confirm distribution ahead of the mega-cap tech earnings gauntlet?
3. With retail sales surging and rate cuts priced near zero for 2026, has consumer resilience become paradoxically bearish for equity valuations that depend on easier financial conditions?
H. CHART OF THE DAY -> TOP
Compelling chart witnessed by our team either on social media, the internet or from our own models.
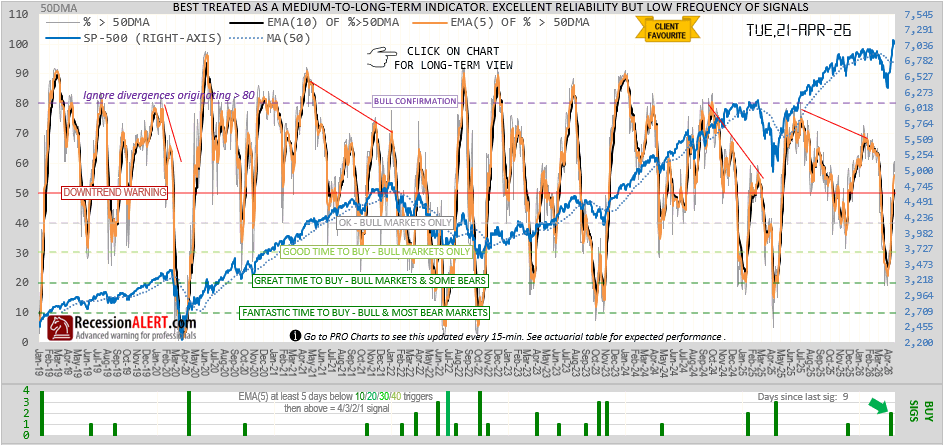
Chart of the Day: One of our oldest and most popular models is the MA50 breadth indicator on daily charts. It serves four distinct functions, two of which are identifying high-confidence buy-the-dip signals and sanity-checking the health of a bull market. We saw a Class-2 signal during the current rally on April 8th — the third strongest signal type — but the aspect we want to focus on today is divergence behaviour below the 80% threshold. The 80% level is critical. It represents the minimum requirement for at least 80% of S&P 500 stocks to be trading above their 50-day moving average, and is a necessary condition for either confirming the continuation of an existing bull rally or validating a new one. Once breadth fails to reach 80% on a market advance, that rally becomes vulnerable. This gives rise to two distinct divergence rules: Rule 1 — Pre-Correction Warning: When the S&P 500 makes new highs but breadth fails to reach 80%, this is typically a precursor to a non-trivial correction. This is exactly what we observed going into the 2026 correction, and the pattern also held cleanly during the early 2025 pullback. Rule 2 — Recovery Vulnerability: When the S&P recovers strongly but breadth not only remains below 80%, but also fails to reach the level of the prior sub-80% peak, the recovery itself is flagged as suspect. The 2022 bear market is the clearest historical template for this behaviour — each recovery attempt was betrayed by progressively lower breadth peaks, and each subsequently failed. Both rules are firing simultaneously right now. As of today, the S&P 500 has printed a new all-time high, yet breadth is stalling in the low-to-mid 60s — below 80%, and below the peak that preceded the correction. What makes this particularly insidious is that unlike 2022, where the market was already in a visible downtrend, the S&P is printing at record highs. That makes the internal deterioration easy to dismiss — which is precisely what makes it dangerous. The chart is not arguing against the rally. It is arguing that the rally does not yet have the internal support required to trust it fully.
Market Intelligence Brief (MIB) Ver. 17.10
For professional investors only. Not investment advice.
© 2026 RecessionALERT.com
Comments are closed.