
MARKET INTELLIGENCE BRIEF (MIB)
Thursday, July 16, 2026
Chipmakers cratered after TSMC’s (TSM) capex hike to $60-64B revived AI-spending fears, dragging the Nasdaq 100 down 1.62% as the S&P 500 held to -0.51%. Philly Fed manufacturing tripled estimates to a five-year high and claims hit a 10-week low, pushing yields up as Dallas Fed’s Logan pushed for “modestly higher” rates. The US struck Iran a fifth night and revoked its oil waiver, yet Brent eased on bearish inventories. Pending home sales sank 5.4% as mortgage rates hit 6.64%.
TABLE OF CONTENTS
A. EXECUTIVE SUMMARY
B. MARKET DATA
C. HIGH-IMPACT STORIES (5)
D. MODERATE-IMPACT STORIES (5)
E. ECONOMY WATCH (7)
F. EARNINGS WATCH (6)
G. WHAT’S NEXT
H. CHART OF THE DAY
A. EXECUTIVE SUMMARY -> TOP
Equities pulled back Thursday as a chipmaker-led selloff — TSMC’s Q2 beat paired with a raised $60-64B capex outlook — reignited AI-spending-return skepticism, sending the Nasdaq 100 down 1.62% against a milder 0.51% S&P 500 decline. The damage compounded an unusual macro backdrop: a fifth consecutive night of US strikes on Iran (its oil-sanctions waiver now revoked) coincided with a blowout Philly Fed print and 10-week-low jobless claims, pushing Treasury yields higher on inflation-repricing risk even as oil itself eased on bearish inventory data. Hawkish Fed commentary from Dallas’s Logan, resilient labor data, and geopolitical energy risk all pointed the same direction, arguing today’s yield move reflects more than tech jitters alone. Breadth confirmed a clean defensive rotation, not a broad flush: Consumer Defensive, Real Estate and Healthcare led while Technology absorbed the damage, and DJ Transportation’s 3.23% surge against a falling Dow marked a notable divergence.
• S&P 500 -0.51% (7,533.87), Nasdaq 100 -1.62% (29,025.77), Dow -0.20% — DJ Transportation surged +3.23%, a same-day Dow Theory divergence now five sessions strong.
• TSMC (TSM) beat Q2 EPS but fell as much as 4.6% after raising 2026 capex guidance to $60-64B; sector-wide selloff hit Micron (-5.65%), Intel (-5.84%), AMD (-5.33%), SanDisk (-12.63%).
• US struck Iran for a fifth straight night, hit an oil tanker near its main export terminal, and revoked Iran’s oil-sanctions waiver effective 12:01am EDT Jul 17 — yet Brent eased 0.38% on a bearish EIA inventory build.
• Philly Fed manufacturing index tripled estimates to 41.4 (vs. 13.0 expected), a five-year high; jobless claims fell to 208K, a 10-week low — both pushing yields higher alongside Dallas Fed’s Logan calling for “modestly higher” rates.
• June pending home sales sank 5.4% and NAHB builder confidence slipped to 34 (15th straight sub-40 reading) as 30-year mortgage rates hit 6.64%, a near one-year high.
• IBM (+3.72%) extended its rebound off Tuesday’s historic 25% crash; JPMorgan upgraded BlackRock (BLK) to Overweight with a $1,364 target (~25% upside) after its Q2 beat.
1. AI-Capex Skepticism Is Becoming a Recurring Pattern, Not a One-Off — TSMC’s beat-and-raise still triggered a chip-sector selloff, the second sharp AI-linked reversal this week after Monday’s NAND scare. Investors aren’t questioning AI demand — they’re questioning whether the spending translates into returns, and that skepticism is now repricing the sector on good news, not just bad.
2. Yields Are Rising for the “Right” and “Wrong” Reasons at Once — Blowout Philly Fed data, a 10-week-low claims print, and hawkish Fed commentary argue for higher-for-longer on strength; a fifth night of Iran strikes and a revoked oil waiver argue for higher-for-longer on geopolitical inflation risk. Both narratives point the same direction, reinforcing the move regardless of which one dominates.
3. Housing Is the Standout Weak Spot in an Otherwise Resilient Economy — Pending sales, builder confidence, and 6.64% mortgage rates are broadening evidence that current rate levels carry real economic cost, even as manufacturing and labor data show clear strength — a divergence the Fed will need to weigh heading into July 28-29.
 — Leading economic indicators. Accurate market forecasts. Apply for membership at join.recessionalert.com
B. MARKET DATA -> TOP
A chipmaker-led selloff — following TSMC’s Q2 beat paired with a raised $60B capex outlook that revived AI-spending-return worries — pulled the Nasdaq 100 down 1.62% while the S&P 500 slipped a milder 0.51%. Breadth was a clean defensive rotation, not a broad flush: value and rate-sensitive sectors held green while growth/tech absorbed the damage and the Dow finished nearly flat. The standout anomaly was DJ Transportation’s 3.23% surge even as the Dow and Nasdaq fell — a same-day Dow Theory divergence. Gold fell 1.76% on dollar strength even as VIX’s 6.64% jump alongside firmer 10-year and 2-year yields signaled inflation-repricing risk rather than a growth scare.
CLOSING PRICES – Thursday, July 16, 2026:
MAJOR INDICES
Same-day Dow Theory divergence: DJTA surged 3.23% while DJIA slipped 0.20% (spread 3.43pp), yet both remain within 2% of their 10-session highs — DJTA in fact set a fresh 10-session high — keeping Dow Theory bull confirmation in force, now entrenched across five consecutive sessions. NYSE Composite’s 0.33% gain confirms breadth held up better than the tech-heavy tape. Over the past 10 sessions, the S&P 500 has outpaced the Nasdaq 100 by roughly 3.3 percentage points, a broadening rotation as value/cyclicals gain ground on growth leadership.
| Index | Close | Change | %Move | Why It Moved |
|---|---|---|---|---|
| S&P 500 | 7,533.87 | -38.53 | -0.51% | Chip-led selloff dragged growth stocks broadly lower |
| Dow Jones | 52,553.62 | -105.02 | -0.20% | Blue-chips largely absorbed tech weakness; UnitedHealth’s earnings beat offset losses |
| DJ Transportation | 22,826.4 | +715.0 | +3.23% | Surged against the tape — a notable same-day Dow Theory divergence |
| Nasdaq 100 | 29,025.77 | -476.83 | -1.62% | Led losses as chipmaker selloff followed TSMC’s raised $60B capex outlook |
| Russell 2000 | 2,976.60 | +0.34 | +0.01% | Essentially flat; small-caps sidestepped the mega-cap tech selloff |
| NYSE Composite | 23,952.27 | +79.74 | +0.33% | Broad composite held up better than tech-heavy gauges |
VOLATILITY & TREASURIES
VIX’s 6.64% spike alongside rising 10-year (+1.1bps) and 2-year (+2.1bps) yields is an inflation-fear signature, not a recession scare — in a growth scare yields typically fall as bonds catch a bid. The 2-year outpacing the 10-year in percentage terms points to near-term inflation repricing. DXY’s 0.29% gain confirms a modest dollar bid alongside the yield move, consistent with today’s metals pullback.
| Instrument | Level | Change | Why It Moved |
|---|---|---|---|
| VIX | 16.71 | +1.04 (+6.64%) | Jumped alongside rising yields — an inflation-fear, not growth-scare, signature |
| 10-Year Treasury Yield | 4.556% | +1.1 bps | Firmed as June retail sales cooled only modestly, keeping inflation-linked rate premium intact |
| 2-Year Treasury Yield | 4.149% | +2.1 bps | Outpaced the 10-year’s rise, pointing to near-term inflation repricing |
| US Dollar Index (DXY) | 100.76 | +0.29 (+0.29%) | Firmed modestly, weighing on dollar-denominated metals |
COMMODITIES
Gold (-1.76%) and silver (-2.89%) fell in tandem, but silver’s steeper drop signals industrial-demand caution layered atop the dollar-driven pullback in the safe-haven metal. Gold’s slip despite continued US strikes on Iranian military sites shows dollar strength outweighing the geopolitical bid today, though the metal held above $4,000. Bitcoin’s 1.28% decline tracked equities lower, confirming risk-off rather than decoupling into its own narrative.
| Asset | Price | Change | %Move | Why It Moved |
|---|---|---|---|---|
| Gold | $3,980.30/oz | -$71.50 | -1.76% | Slipped on dollar strength even as Mideast tensions persisted |
| Silver | $55.775/oz | -$1.658 | -2.89% | Underperformed gold, reflecting added industrial-demand caution |
| Copper | $6.2930/lb | -$0.0480 | -0.76% | Tracked the broader risk-off tone in growth-sensitive assets |
| Platinum | $1,629.85/oz | -$11.85 | -0.72% | Softer alongside the precious metals complex |
| Bitcoin | $64,183 | -$835.0 | -1.28% | Tracked equities lower, confirming risk-off sentiment |
ENERGY
WTI (-0.33%) and Brent (-0.38%) moved in near-lockstep with an unchanged spread — a synchronized global softening, not a regional disruption. Oil declined alongside equities today, a demand-linked risk-off move rather than a supply shock or stagflationary signal. Natural gas told a starkly different story: Henry Hub eased 1.23% on ample domestic supply while Dutch TTF surged 3.64% in dollar terms, underscoring European-specific tightness distinct from the US market.
| Asset | Price | Change | %Move | Why It Moved |
|---|---|---|---|---|
| Crude Oil (WTI) | $79.34/bbl | -$0.26 | -0.33% | Softened in tandem with the broader risk-off tone |
| Crude Oil (Brent) | $84.63/bbl | -$0.32 | -0.38% | Moved in lockstep with WTI; spread unchanged |
| Natural Gas (Henry Hub) | $2.888/MMBtu | -$0.036 | -1.23% | Eased on ample domestic supply |
| Natural Gas (Dutch TTF) | $18.44/MMBtu | +$0.65 | +3.64% | Surged on European-specific supply tightness, decoupled from Henry Hub |
S&P 500 SECTORS
Technology — the 3-month sector leader at +13.12% — reversed hard, posting the day’s second-worst decline (-2.29%) and worst 1-week return (-3.10%), a sharp momentum break from its multi-month leadership. Meanwhile Consumer Defensive (+2.78%), Real Estate (+2.22%) and Healthcare (+1.48%) led today as classic defensive/rate-sensitive rotation, confirming the growth-to-value shift visible in the indices signal above.
| Sector | 1-Day | 1-Week | 1-Month | 3-Month | 6-Month | YTD | 12-Month |
|---|---|---|---|---|---|---|---|
| Consumer Defensive | +2.78% | +2.86% | +0.31% | +3.10% | +4.55% | +9.12% | +8.14% |
| Real Estate | +2.22% | +3.08% | +2.85% | +6.06% | +10.66% | +12.95% | +11.73% |
| Healthcare | +1.48% | -1.14% | +6.24% | +7.72% | +3.12% | +5.04% | +22.60% |
| Energy | +0.33% | +3.29% | +1.73% | -0.68% | +21.27% | +26.27% | +31.18% |
| Utilities | +0.16% | +0.52% | +1.11% | -3.36% | +5.36% | +6.25% | +13.44% |
| Financial | +0.07% | +2.11% | +5.83% | +9.10% | +6.80% | +7.00% | +17.21% |
| Consumer Cyclical | -0.01% | +0.82% | +0.13% | -0.79% | -6.74% | -2.81% | +4.95% |
| Industrials | -0.52% | -2.42% | -5.74% | +0.92% | +6.13% | +13.51% | +18.90% |
| Basic Materials | -1.72% | -0.82% | -9.44% | -10.18% | -3.61% | +6.03% | +28.78% |
| Technology | -2.29% | -3.10% | -5.50% | +13.12% | +16.01% | +17.88% | +29.52% |
| Communication Services | -2.96% | +0.13% | -1.66% | +0.84% | +1.62% | +4.72% | +33.91% |
TOP MEGA-CAP MOVERS:
GAINERS
| Company | Ticker | Close | Change | Why It Moved |
|---|---|---|---|---|
| Philip Morris International | PM | $189.84 | +4.95% | Consumer Defensive strength amid today’s rotation into staples |
| AbbVie | ABBV | $254.39 | +4.21% | Healthcare led gains as the sector benefited from the defensive rotation out of tech |
| IBM | IBM | $219.05 | +3.72% | Rebounding off Tuesday’s historic 25% Q2-earnings-miss crash, the stock’s worst day since 1968 |
| Amgen | AMGN | $371.58 | +3.70% | Biotech gained alongside the broader defensive rotation |
| Merck | MRK | $127.63 | +3.25% | Healthcare sector strength on today’s rotation into defensives |
DECLINERS
| Company | Ticker | Close | Change | Why It Moved |
|---|---|---|---|---|
| SanDisk | SNDK | $1,411.20 | -12.63% | Unwinding an 857% YTD run; TSMC’s raised capex outlook stoked margin/pricing concerns for the NAND memory maker |
| Oracle | ORCL | $124.21 | -6.25% | AI-capex spending concerns pressured shares despite a Buy-consensus long-term outlook |
| Intel | INTC | $96.98 | -5.84% | Swept up in the broad semiconductor selloff following TSMC’s raised $60B capex outlook |
| Micron | MU | $853.20 | -5.65% | Chipmaker selloff compounded by memory-pricing pressure concerns |
| AMD | AMD | $500.94 | -5.33% | Swept up in the broad semiconductor selloff |
— Institutional-grade intelligence for serious investors. Apply for membership at join.recessionalert.comC. HIGH-IMPACT STORIES -> TOP
BEARISH
1. Semiconductor Rout Deepens as TSMC’s Capex Guidance Hike Reignites AI-Spending Valuation Fears
The core facts:Taiwan Semiconductor Manufacturing (TSM) beat Q2 EPS estimates by nearly 11% and posted its fifth consecutive quarter of record profit (+77% year-over-year), yet shares fell as much as 4.6% after the company raised its 2026 capital-expenditure guidance to $60-64 billion from a prior $52-56 billion range and lifted its Arizona investment commitment toward $265 billion in total US manufacturing spend. The selloff spread across the sector: Micron fell 4-9%, Western Digital dropped 5%, Seagate lost more than 5%, SK Hynix slid roughly 8%, and AMD, Intel, Nvidia, and Marvell each declined 2-7%. The Philadelphia Semiconductor Index fell as much as 4%, dragging the Nasdaq Composite down 1.5% (-387 points to 25,881.95) and the S&P 500 down roughly 0.4-0.5%, even as advancing stocks outnumbered decliners and defensive sectors (Staples, Health Care, Real Estate) led the tape.
Why it matters:The market’s decision to punish TSMC despite blowout results signals growing investor skepticism about whether surging AI-infrastructure capital spending will translate into commensurate returns, not doubt about underlying AI demand. This marks the second sharp chip/memory reversal in a matter of days — following Monday’s NAND-oversupply scare — suggesting elevated volatility around AI-linked names is becoming a recurring feature of the tape rather than a one-off event. The defensive rotation beneath a falling headline index shows investors broadly de-risking from crowded AI positioning rather than reacting to a single company’s guidance.
What to watch:Whether chip stocks stabilize Friday or extend a third consecutive down session, and any incremental capex commentary from AMD, Micron, or other AI-infrastructure suppliers in the days ahead.
UNCERTAIN
2. US Strikes Iran for a Fifth Consecutive Night as Crude Paradoxically Eases on Bearish Inventory Data
The core facts:The US military carried out a fifth consecutive night of strikes against Iranian targets Thursday, including the first targeted hit on an Iranian oil tanker near the country’s main export terminal since the current blockade began. The Treasury’s 60-day waiver permitting Iranian oil sales — previously set to run through August 21 — was revoked, barring transactions after 12:01am EDT July 17. Despite the escalation, Brent crude actually eased to $84.63/bbl (-0.37% on the day) after an early spike, as a bearish EIA report showing a 4.56-million-barrel build in distillate stockpiles outweighed the geopolitical risk premium; Strait of Hormuz transits have collapsed more than 50% versus the prior week. Separately, Trump suggested Iran may be open to negotiating even as strikes continue, while the WSJ reported the administration is weighing broader options, including strikes on infrastructure and seizing strategic islands near the Strait.
Why it matters:The combination of a fifth straight night of strikes, a revoked sanctions waiver, and reported plans for broader military options keeps a structural energy-inflation risk embedded in markets, even though today’s price action showed crude can still fall on bearish supply data despite an active war. That divergence — escalating conflict, easing prices — argues against reading today’s calm oil tape as a sign the risk has passed; a change in the inventory picture or a genuine Iranian response to the infrastructure threat could reverse the move quickly. Rising Treasury yields today partly reflected this same energy-inflation uncertainty.
What to watch:Whether Iran responds to the infrastructure-strike threat or engages the negotiating track Trump referenced, and whether next week’s EIA inventory and Hormuz-transit data confirm today’s price relief or reverse it.
BULLISH
3. Philly Fed Manufacturing Index Triples Estimates, Hits Five-Year High
The core facts:The Philadelphia Fed’s Manufacturing Business Outlook Survey surged to 41.4 in July from 10.3 in June, blowing past the 13.0 consensus by nearly three times to reach its highest level since November 2021. New orders jumped 10 points to 37.0 — also the strongest since November 2021 — while shipments climbed 19 points to 33.7, the best reading since April, with employment sub-indices posting broad-based gains as well.
Why it matters:A regional manufacturing survey this strong, arriving the same week as a cooling PPI print, reinforces the soft-landing narrative of solid growth without renewed inflation pressure. But the data also gave ammunition to hawks: Treasury yields ticked higher Thursday (10-year up 3bps to 4.5754%, 2-year up over 2bps to 4.1577%) as the strength reduces the urgency for the Fed to cut, feeding into today’s broader yield-driven volatility alongside Dallas Fed’s Logan and the Iran-driven energy risk.
What to watch:The national ISM Manufacturing PMI later this month for confirmation that regional strength is broadening, and whether Fed officials cite today’s data in the run-up to the July 28-29 FOMC meeting.
BEARISH
4. Housing Slowdown Deepens as Pending Sales Sink, Builder Confidence Extends Historic Funk
The core facts:June pending home sales fell 5.4% month-over-month, far below the -0.5% consensus, while NAHB builder confidence slipped two points to 34 — a 15th consecutive sub-40 reading, the longest such stretch since 2012. The 30-year fixed mortgage rate climbed to 6.64% (Freddie Mac’s weekly average: 6.55%), a near one-year high, and 37% of builders reported cutting prices in July, up from 35% in June and 32% in May.
Why it matters:The combination of sinking transaction volume, prolonged builder pessimism, and rates near a one-year high points to an affordability-driven housing slowdown that shows no sign of bottoming, with direct read-through to homebuilder earnings, mortgage-related financials, and the Fed’s own assessment of interest-rate-sensitive sectors. Housing weakness of this persistence complicates any simple “higher for longer” narrative, since it demonstrates real economic cost from current rate levels even as other data (manufacturing, labor) show resilience.
What to watch:July’s housing starts and existing home sales data for confirmation the slowdown is broadening beyond pending sales, and whether mortgage rates ease once the Fed’s rate path becomes clearer after the July 28-29 meeting.
UNCERTAIN
5. June Retail Sales Miss as Fifth Night of Iran Strikes Pushes Treasury Yields Higher
The core facts:June retail sales rose just 0.2% month-over-month, below the 0.3% consensus, though underlying details were firmer than the headline miss suggested. The report landed alongside the fifth consecutive night of US-Iran strikes and a broader rise in Treasury yields — the 10-year note climbed toward 4.60%, approaching the two-month high of 4.62% set July 13 — as markets weighed a resilient labor market (jobless claims at a 10-week low, reported the same morning) against tepid headline consumer spending growth and energy-driven inflation risk from the Iran conflict.
Why it matters:A soft retail sales print would normally argue for a more dovish Fed, but today it competed with strong labor data, hawkish Fed commentary from Dallas’s Logan, and rising oil-driven inflation risk — all pushing yields higher rather than lower. The net effect illustrates how geopolitically-driven energy risk and labor-market strength are currently outweighing softer consumer-spending signals in setting the market’s rate-path expectations.
What to watch:July retail sales and the September/October FOMC meetings for whether consumer spending momentum continues to soften or was a one-month blip.
— Quantifying recession risk so you don’t have to guess. Apply for membership at join.recessionalert.comD. MODERATE-IMPACT STORIES -> TOP
BULLISH
6. IBM Rebounds Modestly Off Its Worst Trading Day Since 1987
The core facts:IBM shares rose roughly 2% Thursday, a partial recovery after Tuesday’s unprecedented 25.2% single-day crash — the stock’s worst day since 1987 — triggered by a preliminary Q2 revenue miss ($17.2 billion versus $17.85-17.86 billion expected). CEO Arvind Krishna told investors that clients redirected capital in the final weeks of June away from IBM’s software and infrastructure toward memory chips and servers, racing to secure supply-constrained AI hardware ahead of expected price increases. The stock’s Relative Strength Index near 29 signals oversold conditions. IBM’s full Q2 earnings report and guidance update are due July 22.
Why it matters:The rebound is modest relative to the scale of Tuesday’s collapse, and Krishna’s explanation — that the miss reflects a temporary capex-timing shift by clients rather than demand erosion — has not yet been tested against hard numbers. Whether investors accept that framing likely hinges on the full Q2 release and updated guidance next week.
What to watch:IBM’s full Q2 report and formal guidance update on July 22 for confirmation of whether the capex-reallocation explanation holds up or deeper demand softness is at play.
BEARISH
7. SanDisk Extends Slide as TSMC Capex Shock Compounds NAND Memory Fears
The core facts:SanDisk shares fell roughly 8-9.6% Thursday, extending Wednesday’s decline, as the same TSMC capex-guidance shock weighing on broader chips intensified concerns about NAND memory pricing and supply. The stock is now roughly 36% below its all-time high after an extraordinary 857% year-to-date rally at its peak. Notably, no sell-side analyst has cut a price target on SanDisk in the past three weeks — several have raised targets even as the stock fell.
Why it matters:The disconnect between falling shares and rising analyst price targets suggests today’s move is driven by momentum-unwind and sector-wide repositioning rather than a fundamental reassessment of SanDisk’s NAND business — but a stock down this sharply, this fast, after an 857% run leaves little room for error if the next data point (pricing, guidance, or peer commentary) disappoints.
What to watch:Whether SanDisk stabilizes alongside the broader chip sector Friday, and any NAND pricing commentary from peers Micron or Western Digital.
UNCERTAIN
8. Dallas Fed’s Logan Calls for “Modestly Higher” Rates to Finish Inflation Fight
The core facts:Dallas Fed President Lorie Logan said in Houston remarks Thursday that “modestly higher interest rates would better balance the outlook and risks for the FOMC’s dual mandate goals,” arguing current policy isn’t doing enough to return inflation to 2%. She cited a solid labor market — unemployment averaging 4.3% in the first half of the year, with employers adding roughly 92,000 jobs per month — as removing a key obstacle to further tightening.
Why it matters:Logan’s remarks add to a hawkish chorus this week and reinforce the Fed’s internal divide over the rate path — markets still assign only a 12.3% probability to a hike at the July 28-29 meeting, but Logan’s framing shifts the debate toward September or October as the more likely window for action if inflation data doesn’t cooperate.
What to watch:The September and October FOMC meetings for whether Logan’s camp gains further support, and upcoming inflation data for the trigger point she’s describing.
BULLISH
9. Jobless Claims Fall to 208,000, Fewest in 10 Weeks
The core facts:Initial jobless claims fell 8,000 to a seasonally adjusted 208,000 for the week ended July 11, well below the 217,000 consensus and the lowest level since early May. The reading reinforces what economists describe as a “slow hire, slow fire” labor market.
Why it matters:Stable claims data reduces the Fed’s incentive to cut rates and reinforces the case Logan made the same day for holding — or even raising — rates further, adding another data point pushing yields higher across Thursday’s session.
What to watch:Next month’s payrolls report for confirmation the labor market is holding steady rather than beginning to soften.
UNCERTAIN
10. Thursday’s Wave of Analyst Actions: BlackRock Upgraded, AEP Downgraded, Alphabet and Meta Initiated
The core facts:JPMorgan upgraded BlackRock (BLK) to Overweight from Neutral and raised its price target to $1,364 from $1,165 — implying roughly 25% upside — following BlackRock’s Q2 beat, citing “the strong setup for flows, organic revenue, and operating leverage ahead.” Capital One upgraded Palo Alto Networks (PANW) to Overweight ($421 target) and Okta (OKTA) to Overweight ($171 target). Goldman Sachs downgraded American Electric Power (AEP) to Neutral ($147 target). Wedbush initiated Alphabet (GOOGL) at Outperform ($445 target) and Meta (META) at Neutral ($671 target); Piper Sandler started SpaceX (SPCX) at Neutral ($156 target); Baird initiated Vertiv (VRT) at Outperform ($370 target).
Why it matters:The BlackRock upgrade is the standout — a top-tier bank endorsing a near-25% re-rating right after earnings signals real conviction in the asset manager’s flow and margin trajectory. The broader mix of upgrades, one notable downgrade, and fresh initiations across software, utilities, and AI-adjacent names shows sell-side positioning actively shifting in response to this week’s earnings rather than a single directional market call.
What to watch:Whether BlackRock shares begin closing the gap toward JPMorgan’s $1,364 target in the sessions ahead, and follow-through analyst commentary on Alphabet and Meta given today’s fresh initiations.
— Separating signal from noise since 2007. Apply for membership at join.recessionalert.comE. ECONOMY WATCH -> TOP
Today’s data split along a familiar fault line: labor and manufacturing surprised to the upside while housing kept deteriorating. Initial claims fell to a 10-week low of 208K and the Philly Fed’s headline index rocketed to 41.4 — nearly a five-year high — even as retail sales growth slowed to 0.2% on a gas-price pullback. Housing told the opposite story: pending sales sank 5.4% and NAHB builder confidence slipped to 34, its 15th straight sub-40 reading, as 30-year mortgage rates pushed toward multi-month highs. Dallas Fed’s Logan added a hawkish wrinkle, arguing “modestly higher” rates may be needed even as GDPNow ticked up to 1.7% for Q2.
Philly Fed Manufacturing Index Surges to 41.4, Nearly a Five-Year High (RTTNews, July 16, 2026)
What they’re saying:The Philadelphia Fed’s Manufacturing Business Outlook Survey jumped to 41.4 in July from 10.3 in June, blowing past the 13.0 consensus by more than 28 points — the highest reading since November 2021. New orders surged to 37.0 and shipments climbed to 33.7, both multi-year highs, while the employment index rose to 10.0.
The context:The magnitude of the beat — nearly 3x the expected reading — signals a broad-based reacceleration in regional manufacturing activity that contrasts sharply with the soft factory prints seen through much of the first half of 2026. Regional Fed surveys like this often foreshadow the national ISM Manufacturing PMI.
What to watch:ISM Manufacturing PMI (early August) for confirmation of a broader national turn; Empire State and Richmond Fed surveys for regional consistency.
Initial Jobless Claims Fall to 208K, Fewest in 10 Weeks (Bloomberg / DOL, July 16, 2026)
What they’re saying:Initial claims for state unemployment benefits dropped 8,000 to a seasonally adjusted 208,000 for the week ended July 11, well below the 217,000 Reuters consensus and 219,000 FactSet estimate. The 4-week moving average eased to 214,250 from 219,000 prior.
The context:The decline reverses the elevated-claims trend that persisted from late May through mid-June, reinforcing that the labor market remains stable even as other pockets of the economy — housing, homebuilder hiring — show strain.
What to watch:Next week’s claims print and the early-August nonfarm payrolls report for confirmation labor resilience is holding.
Retail Sales Growth Slows to 0.2% in June as Gas Prices Retreat, E-Commerce Surges (CNN Business, July 16, 2026)
What they’re saying:Headline retail sales rose 0.2% in June, in line with consensus but down sharply from May’s upwardly revised 1.0% gain. Sales excluding gas stations rose a solid 0.7%; online retail jumped 1.9%, likely aided by Prime Day promotions, while gas station receipts plunged 5.3% and health/personal-care spending fell 0.8%.
The context:Composition matters more than the headline here — falling gas prices mechanically dragged down the unadjusted total even as underlying, ex-energy consumer spending held up well. Economists flagged renewed slowdown risk for consumer spending in the back half of the year.
What to watch:July retail sales (mid-August) and back-to-school spending data for whether the ex-gas strength persists.
Pending Home Sales Slump 5.4% in June, Far Worse Than Expected (NAR / Reuters, July 16, 2026)
What they’re saying:NAR’s Pending Home Sales Index fell 5.4% in June and is down 0.3% year-over-year, badly missing the Reuters consensus for a 0.5% decline. Contract signings fell in all four major U.S. regions month-over-month; only the Northeast showed a year-over-year gain (+2.2%).
The context:NAR chief economist Lawrence Yun attributed the slump to “the highest mortgage rates in nearly a year” combined with record-high national median home prices, calling the market “tepid” and especially difficult for first-time buyers.
What to watch:June existing home sales and July mortgage application data for whether the affordability squeeze is deepening.
Builder Confidence Slips to 34 as Mortgage Rates Hit Multi-Month High (NAHB / CNBC, July 16, 2026)
What they’re saying:The NAHB/Wells Fargo Housing Market Index fell two points to 34 in July from an upwardly revised 36 in June, marking 15 consecutive months below the breakeven level of 40 — the longest such stretch since 2012. The 30-year fixed mortgage rate rose to 6.64%, and 37% of builders reported cutting prices in July, up from 35% in June.
The context:Persistent affordability pressure from elevated mortgage rates, high land costs, and rising material prices continues to weigh on builder sentiment, corroborating the same morning’s pending-home-sales weakness.
What to watch:June housing starts and building permits (due July 17) for whether builders are pulling back on new construction.
Dallas Fed’s Logan Calls for “Modestly Higher” Interest Rates (CNBC, July 16, 2026)
What they’re saying:In prepared remarks for a Houston speech, Dallas Fed President Lorie Logan said “modestly higher interest rates would better balance the outlook and risks for the FOMC’s dual mandate goals,” arguing “every month of above-target inflation has compounded the strain on Americans’ budgets.”
The context:Logan stopped short of calling for a hike at the July 28-29 FOMC meeting (markets currently price just 12.3% odds of one), but her remarks add to a chorus of hawkish Fed voices arguing rates may need to rise further to finish the inflation fight.
What to watch:July 28-29 FOMC meeting and statement language for whether hawkish rhetoric translates into a policy shift.
Atlanta Fed’s GDPNow Revised Up to 1.7% for Q2 Growth (Atlanta Fed, July 16, 2026)
What they’re saying:The Atlanta Fed’s GDPNow model raised its Q2 2026 real GDP growth tracking estimate to 1.7%, up from 1.3% as of July 8, following today’s data on retail sales, business inventories, and housing.
The context:The upward revision, while still below the economy’s longer-run trend pace, suggests Q2 growth may come in firmer than feared a week ago — a modest offset to today’s soft housing prints and further evidence the economy is decelerating rather than contracting.
What to watch:The Commerce Department’s advance Q2 GDP release (July 30) to see whether GDPNow’s tracking holds up against the official print.
— Know the probability before the market prices in the risk. Apply for membership at join.recessionalert.comF. EARNINGS WATCH -> TOP
YESTERDAY AFTER THE BELL (Markets Reacted Today)
No major earnings yesterday after the bell from companies with >$100B market cap.
TODAY BEFORE THE BELL (Markets Already Reacted)
BULLISH
11. UnitedHealth Group (UNH): +1.16% | Blowout Beat Drives Guidance Raise as Medical Costs Improve
The Numbers:Revenue of $112.0 billion beat the $110.81 billion estimate; adjusted EPS of $6.38 crushed the $4.91 estimate (+30% surprise); GAAP EPS came in at $6.04. The medical care ratio improved to 86.7% from 89.4% a year ago. Released: BMO ET.
The Problem/Win:The win was a sharp medical-cost recovery: UnitedHealthcare’s operating margin rose to 4.6% from 2.4% a year ago, and Optum expanded margin by 160 basis points, showing the pricing and cost-discipline actions management outlined earlier this year are taking hold faster than expected.
The Ripple:The improved medical-cost trend is a positive read-through for peer managed-care names (Cigna, Humana, Elevance) heading into their own Q2 reports, since it suggests the industry-wide utilization pressure that hammered 2025 results may be easing.
What It Means:The results support UnitedHealth’s turnaround narrative after a difficult 2025, though the modest +1.16% stock reaction suggests much of the good news was already priced in given the stock’s recent run into the print.
What to watch:The company’s raised full-year adjusted EPS guidance of $19.50-$20.00 and next quarter’s medical care ratio for confirmation the cost discipline is durable, not a one-quarter reprieve.
UNCERTAIN
12. GE Aerospace (GE): -4.06% | Beat-and-Raise Overshadowed by Margin Compression Worries
The Numbers:Adjusted revenue of $12.6 billion (+24% YoY) beat estimates, with adjusted EPS of $2.02 versus $1.86 consensus. Commercial Engines & Services revenue reached $9.7 billion (+27%) with $2.7 billion profit (+20%); Defense & Propulsion Technologies revenue hit $3.4 billion (+16%) with $475 million profit (+18%, +30bps margin). GE raised FY26 guidance to $10.55-$10.75 billion operating profit, $7.65-$7.85 adjusted EPS, and $8.9-$9.2 billion free cash flow. Released: BMO ET.
The Problem/Win:The problem was margin, not growth: GE beat on revenue and profit across both segments and raised guidance, but disclosed that servicing its $210 billion backlog in a supply-constrained aerospace market required absorbing double-digit sequential increases in priority-supplier input costs, compressing margins even as deliveries rose.
The Ripple:The margin-compression concern is a read-through for other aerospace suppliers navigating the same constrained parts market, and may temper enthusiasm ahead of upcoming reports from engine and airframe peers.
What It Means:GE beat on every headline metric and still raised guidance, yet the stock fell because investors are pricing the risk that margin erosion continues as the backlog converts to deliveries — a genuinely two-sided outcome rather than a clean beat.
What to watch:Q3 results for evidence GE can stabilize margins while maintaining delivery volume growth.
BULLISH
13. Abbott Laboratories (ABT): +12.5% | Guidance Raise Sends Shares to Fresh Highs
The Numbers:Reported sales grew 13.0%; comparable sales rose 4.8%. Adjusted EPS of $1.31 topped estimates; GAAP EPS was $0.53. Abbott raised full-year 2026 adjusted EPS guidance to $5.45-$5.60 from $5.38-$5.58 and reaffirmed comparable sales growth guidance of 6.5-7.5%. Third-quarter guidance was set at $1.38-$1.46 adjusted EPS. Released: BMO ET.
The Problem/Win:The win was broad-based: growth accelerated across the diagnostics, medical devices, and nutrition segments enough to support a second consecutive guidance raise, with no single division flagged as a drag.
The Ripple:Abbott’s strength provides a positive read-through for diversified med-tech peers ahead of their own Q2 reports, particularly in diagnostics and medical devices where Abbott’s commentary on demand trends often sets the tone.
What It Means:A clean beat-and-raise combined with a double-digit stock jump signals the market had been under-pricing Abbott’s growth trajectory heading into the print.
What to watch:Whether the raised guidance holds through Q3, given Abbott’s own new EPS range of $1.38-$1.46 for the quarter.
BULLISH
14. Prologis (PLD): +4.04% | Record Leasing and Data-Center Pipeline Fuel Second Guidance Raise This Year
The Numbers:Core FFO per share rose 11.6% year-over-year to $1.63. Adjusted EPS of $1.13 beat the $0.75 estimate by more than 51%; revenue of $2.43 billion beat the $2.16 billion estimate by roughly 12.5%. Cash same-store NOI grew 8.5%. Prologis raised full-year 2026 core FFO guidance to $6.22-$6.30 per share — its second guidance raise this year — and hiked development-starts guidance by $1 billion at the midpoint. Released: BMO ET.
The Problem/Win:The win was demand breadth: a record 67 million square feet of leasing combined with an expanding 5.8 gigawatt data-center power pipeline shows Prologis capturing both traditional logistics demand and the industrial real estate side of the AI infrastructure buildout simultaneously.
The Ripple:Prologis’s results are a bullish read-through for industrial and logistics REIT peers, and the data-center pipeline growth reinforces the broader AI-infrastructure capex theme dominating today’s session in chips.
What It Means:A second guidance raise this year, on the back of record leasing, signals Prologis’s underlying business is accelerating rather than merely stabilizing.
What to watch:Continued data-center pipeline conversion into signed leases as a gauge of how durable the AI-driven demand is for industrial real estate.
TODAY AFTER THE BELL (Markets React Tomorrow)
UNCERTAIN
15. Netflix (NFLX): -9% AH | EPS Beat Undercut by Reaffirmed, Not Raised, Guidance
The Numbers:Revenue of $12.56 billion was roughly in line with the $12.587 billion estimate; EPS of $0.80 beat the $0.79 estimate. Full-year 2026 revenue guidance was maintained at $50.7-$51.7 billion and the 31.5% operating margin target was held, rather than raised. Free cash flow guidance was lifted to approximately $12.5 billion from $11 billion, aided by the after-tax benefit of the termination fee Netflix received after stepping away from its pursuit of Warner Bros. Q3 guidance calls for 12% revenue growth (11% FX-neutral) and a 33.2% operating margin. Released: AMC ET.
The Problem/Win:The problem was guidance, not execution: after a strong quarter, management chose to reaffirm rather than raise full-year revenue guidance, disappointing investors positioned for an upgrade, while flagging that content-amortization growth peaked this quarter before decelerating in the back half.
The Ripple:The reaction raises the bar for streaming peers on subscriber and ad-tier growth commentary, particularly as competitive intensity in streaming continues to build following recent industry consolidation.
What It Means:A beat that still trades off roughly 9% shows how demanding the setup was heading into the print — Netflix needed to raise guidance, not just meet it, to satisfy a market pricing in continued acceleration.
What to watch:Q3 subscriber and ad-tier growth trends for evidence the deceleration flagged in content amortization doesn’t extend to the top line.
BULLISH
16. Intuitive Surgical (ISRG): +2.5% AH | Broad Beat on Procedure Growth Offers Relief After a 30% Slide
The Numbers:Revenue of $2.89 billion rose 19% year-over-year, beating the $2.81 billion estimate by roughly $80 million. Non-GAAP EPS of $2.80 beat the $2.48 estimate by nearly 13%. Worldwide procedures (da Vinci plus Ion) grew approximately 16% year-over-year — da Vinci procedures +15%, Ion procedures +36% — with 468 da Vinci systems placed versus 395 a year ago, including 246 of the newest da Vinci 5 units. Released: AMC ET.
The Problem/Win:The win was procedure and placement growth accelerating on both the legacy da Vinci and newer Ion platforms simultaneously, addressing the demand-slowdown concerns that had driven the stock down roughly 30% year-to-date heading into the print.
The Ripple:Strong da Vinci 5 placement growth is a positive signal for surgical-robotics suppliers and hospital capital-equipment spending more broadly.
What It Means:The modest +2.5% after-hours reaction, against a backdrop of a 30% year-to-date decline, suggests the beat reassured investors on fundamentals without fully resolving the valuation-compression and competitive concerns (including a recent TD Cowen price-target cut) that drove the stock lower.
What to watch:Whether the after-hours gain holds through Friday’s full session, and management commentary on competitive dynamics during the earnings call.
WEEK AHEAD PREVIEW:
Q2 2026 earnings season remains in its early innings (~4% of the S&P 500 reported as of last week), with a large wave of reporters — including several regional and money-center financial names — arriving the week of July 20. Friday, July 17 has no confirmed >$100B US-domiciled reporters at this time.
Charles Schwab (SCHW) — BMO, Tue Jul 21 — Consensus calls for EPS of $1.53 (+34% YoY) on revenue of $6.84 billion (+17%); trading revenue (est. $1.14 billion, +20% YoY) and net interest income growth are the focus areas as markets look for confirmation that brokerage and asset-management momentum is continuing.
Danaher (DHR) — BMO, Tue Jul 21 — Consensus EPS of $1.83; this is the first full quarter following Danaher’s completed acquisition of Masimo in June, so integration progress and any updated guidance will be closely watched.
Capital One Financial (COF) — AMC, Tue Jul 21 — EPS is expected to decline roughly 11% year-over-year to $4.89 despite higher revenue; the Discover integration ($2.5-2.7 billion in targeted synergies by 2027) and the domestic card revenue margin (16.9% in Q1) are the key metrics as credit card volumes continue migrating onto the Discover network.
The reported percentage of the S&P 500 rises sharply once the July 20 wave of bank and diversified-financial names clears, moving Q2 2026 earnings season well past its current ~4% completion mark.
— US market commentary trusted by family offices and institutions. Apply for membership at join.recessionalert.comG. WHAT’S NEXT -> TOP
UPCOMING RELEASES:
| Date | Event | Why It Matters |
|---|---|---|
| Fri, Jul 17 | Housing Starts & Building Permits (Jun, starts expected 1.31M vs. prior 1.177M; permits expected 1.40M vs. prior 1.41M) | Follow-through on today’s weak pending home sales and NAHB builder confidence data — shows whether builders are pulling back construction amid 6.64% mortgage rates. |
| Fri, Jul 17 | Industrial Production MoM (Jun, expected 0.2%, prior 0.1%) | Tests whether today’s blowout Philly Fed manufacturing strength is showing up in actual factory output, or if the survey remains ahead of hard data. |
| Fri, Jul 17 | Import/Export Prices MoM (Jun, import expected -0.7% vs. prior 1.9%; export expected -0.4% vs. prior 1.3%) | Trade-price inflation feeds directly into the Fed’s inflation assessment ahead of the July 28-29 FOMC meeting, particularly relevant given today’s hawkish remarks from Dallas Fed’s Logan. |
| Fri, Jul 17 | Michigan Consumer Sentiment Prel (Jul, expected 51, prior 49.5) | First read on how households are processing this week’s inflation and Iran-conflict headlines; a move above 50 would suggest early stabilization after months of sub-50 readings. |
KEY QUESTIONS:
1. Will chip stocks stabilize Friday or extend a third consecutive down session, and does incremental AI-capex commentary from other suppliers confirm or ease the valuation concerns TSMC’s guidance revived?
2. Does Iran negotiate or escalate following the revoked oil waiver and fifth night of US strikes, and does Friday’s data confirm today’s oil-price calm or reverse it?
3. With Philly Fed manufacturing tripling estimates, jobless claims at a 10-week low, and Logan pushing for “modestly higher” rates, is the July 28-29 FOMC meeting shifting from a hold toward a live debate over the next move?
— US market commentary trusted by family offices and institutions. Apply for membership at join.recessionalert.comH. CHART OF THE DAY -> TOP
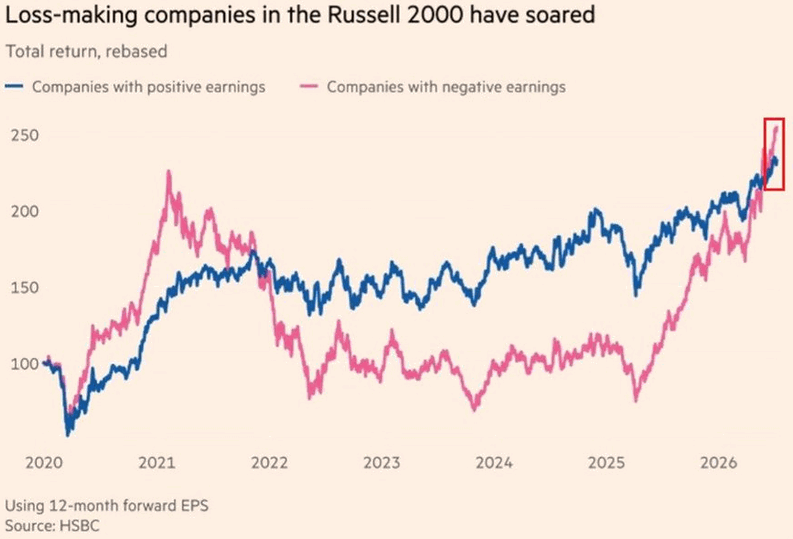
Rate cuts do not hand a loss-making company earnings — they hand it time, and time is what the pink line just repriced. Roughly 40% of Russell 2000 constituents carry floating-rate debt, and interest expense already eats near 31% of index EBITDA, so when the Fed eases, the coupon reprices within a quarter with no revenue required. Add the OBBBA’s bonus depreciation and R&D expensing and a forward multiple near 18x against 26x for large caps, and four marginal factors have done what earnings have not. That is why the loss-makers just retook leadership for the first time since the 2021 meme peak, erasing four and a half years of quality’s advantage in about eighteen months. This is not a fringe cohort outrunning a healthy core: two decades ago roughly 14% of the index lost money; late last year it was 806 of about 2,000 members. Close to half the index is now the highest-beta claim on a policy path. The only prior sample is a warning — last time pink led, it fell -63% while blue barely flinched. Nothing was fixed here; the cost of carry relented, and it relents only while the cuts keep coming. The junk half is not riding the small-cap recovery — it is the recovery.
Market Intelligence Brief (MIB) Ver. 18.42
For professional investors only. Not investment advice.
© 2026 RecessionALERT.com

Comments are closed.