
MIB WEEKLY DIGEST
Week of Oct 5–9, 2026
An OpenAI revenue scare split the AI trade: Thursday’s Financial Times report of a ~$50 billion run-rate sank chipmakers, and Friday’s Bloomberg account of a $70 billion target revived only software — Intel fell 12.26% on the week while Palantir rose 10.75%. The S&P 500 still gained 1.15% after its first close above 7,800, carried by staples, utilities and energy as Technology finished last. The 10-year hit a 24-year closing high of 5.315% Monday before auctions drew buyers and the Fed minutes named AI borrowing as a rival for capital. Gulf attacks widened and Hurricane Isaias shut in 63% of Gulf oil output, keeping Brent above $100.
TABLE OF CONTENTS
A. WEEK AT A GLANCE
B. WEEK IN MARKETS
C. WEEK’S TOP STORIES (8)
D. WEEK IN THE ECONOMY (5)
E. WEEK IN EARNINGS (1)
F. NEXT WEEK SETUP
G. CHART OF THE WEEK
A. WEEK AT A GLANCE -> TOP
The S&P 500 rose 1.15% on the week and set a record on Tuesday, but without its usual engine: Technology finished last of eleven sectors after Thursday’s report that OpenAI’s revenue trails earlier signals broke the chip trade, and staples, utilities and energy did the lifting. Underneath, the Fed sharpened its case for more hikes while long-dated Treasuries found buyers at 24-year-high yields, and energy risk spread from the Strait of Hormuz to the platforms of the Gulf of Mexico. The market ends the week priced for higher rates and higher oil, and less sure who will pay for AI.
• OpenAI revenue whiplash: the FT’s ~$50 billion run-rate (Thu) sank chips and the Nasdaq 100 fell 1.39% that day; Bloomberg’s $70 billion year-end target (Fri) lifted only software. Intel −12.26% on the week, Palantir +10.75%.
• A record, then a rotation: the S&P 500’s first close above 7,800 (Tue, 7,818.93) gave way to a defensive week, with Consumer Defensive (+4.16%) leading and Technology (−1.09%) last.
• The long end held: the 10-year closed at 5.315% Monday, a 24-year high, but the 10- and 30-year auctions drew end buyers and it finished the week 3.2 bps lower at 5.244%.
• The Fed leans toward more hikes: the minutes show most officials expect another increase by year-end, and Waller and Musalem agreed with flexibility on timing; Polymarket’s 2026 hike odds held at 100%.
• Gulf risk widened: a laden supertanker was struck off the UAE (Fri) and Hurricane Isaias shut in 63% of Gulf of Mexico oil output (Thu); Brent +1.43% to $104.25, above $100 every session.
• The season’s first mega-cap print: PepsiCo beat on revenue and core EPS and rose 3.73% Thursday despite cutting full-year core EPS growth to 2.5%–3.5%.
1. AI Now Has Three Prices — Equity investors paid up for AI’s users (software, Palantir), marked down its suppliers (five chip names led the decliners, and Apple cut iPhone orders over AI-driven memory costs), and the bond market began charging for its financing, as the Fed minutes and SpaceX’s $40 billion debt plan made explicit.
2. A Hawkish Fed the Market Had Already Priced — The minutes and three officials argued for more hikes, yet yields fell across the curve, hike odds held at 100% and recession odds slipped, so the argument has moved from whether to when — and Wednesday’s CPI now carries the timing.
3. Energy Buffers Are Being Spent While the Threat Expands — Washington deferred diesel taxes, sped up IEA releases and licensed Russian diesel while the strategic reserve sits at a 44-year low, in the same week attacks spread beyond Hormuz and a hurricane shut in most Gulf of Mexico output.
 — Leading economic indicators. Accurate market forecasts. Apply for membership at join.recessionalert.com
B. WEEK IN MARKETS -> TOP
An AI-revenue scare, not the Fed, shaped the week. AI hardware carried the Nasdaq Composite to a record on Monday and the S&P 500 to its first close above 7,800 on Tuesday; then Thursday’s Financial Times report that OpenAI’s revenue run-rate trails earlier signals by about $20 billion broke the chip trade, and Friday’s Bloomberg account of a $70 billion year-end target rescued software but not semiconductors. Leadership flipped to the defensive end: nine of eleven sectors rose while Technology, the year’s leader, finished last, and the broad NYSE Composite comfortably beat the Nasdaq 100. Bonds supplied the week’s real divergence: the Fed minutes, Governor Waller and St. Louis Fed President Musalem all signalled more hikes, yet yields fell across the curve once Monday’s 24-year closing high in the 10-year proved a peak rather than a breakout. The index ends the week higher with its engine stalled.
FRIDAY CLOSE & WEEK-ON-WEEK CHANGE — Fri, Oct 9, 2026:
MAJOR INDICES
The week inverted the year’s leadership: the NYSE Composite and the Dow outran a Nasdaq 100 that surrendered most of its early-week gain once Thursday’s chip selloff hit, while small caps and transports finished lower even as both large-cap gauges rose. A Russell 2000 that peaked Monday and never recovered it marks a rotation into large defensives, not a broadening out to smaller companies.
| Index | Fri Close | WoW Change | WoW % | Why It Moved (Week) |
|---|---|---|---|---|
| S&P 500 | 7,811.54 | +88.82 | +1.15% | Record close Tuesday on AI hardware, then two down days after the FT’s OpenAI revenue report; staples, utilities and energy carried the net gain while Technology finished the week lower. |
| Dow Jones | 51,654.95 | +477.99 | +0.93% | Steadier than the tech-heavy gauges: Caterpillar’s 5.75% drop made Wednesday the only real loss, and Friday’s 0.83% advance on the broad rebound sealed the weekly gain. |
| DJ Transportation | 19,804.14 | −205.61 | −1.03% | C.H. Robinson’s near-11% fall on its RXO deal cut the average 1.09% Monday, and losses Tuesday and Wednesday outweighed Thursday’s 1.43% rebound. |
| Nasdaq 100 | 30,883.15 | +75.22 | +0.24% | Record closes Monday and Tuesday on Nvidia, AMD and Marvell were mostly erased by Wednesday’s dip and Thursday’s 1.39% chip-led drop; Friday’s rebound came from software, not semiconductors. |
| Russell 2000 | 2,806.98 | −25.92 | −0.91% | Peaked Monday, then lost nearly 2% across Tuesday and Wednesday as small caps sat out the large-cap record and led Wednesday’s cyclical selloff; flat Thursday and a modest Friday gain did not repair it. |
| NYSE Composite | 23,939.10 | +284.79 | +1.20% | Best of the major gauges: it rose on four of five days, including Thursday’s tech selloff, with only Wednesday’s eight-sector decline breaking the run. |
VOLATILITY & TREASURIES
Hawkish talk and falling yields coexisted all week: the minutes, Waller and Musalem each pointed to more hikes, yet both the 2-year and the 10-year finished lower, a sign the policy path was already priced and that supply, not the Fed, was setting long yields. The 10-year’s Monday close, its highest in 24 years, marked the turn once Wednesday’s 10-year auction left dealers their smallest share since 2008, and the curve ended near where it began after a mid-week steepening. A lower VIX through Thursday’s chip selloff kept it contained.
| Instrument | Fri Level | WoW Change | Why It Moved (Week) |
|---|---|---|---|
| VIX | 14.84 | −0.47 (−3.07%) | Rose in three sessions but fell harder on Tuesday’s record and Friday’s software rebound, closing at the week’s low; Thursday’s AI-revenue selloff lifted it only 2.25%. |
| 10-Year Treasury Yield | 5.244% | −3.2 bps | Closed Monday at 5.315%, a 24-year high, then eased as Wednesday’s strong 10-year auction and Thursday’s haven bid during the chip selloff outweighed hike signals from the minutes, Waller and Musalem. |
| 2-Year Treasury Yield | 4.793% | −3.6 bps | Drifted lower Monday through Thursday as October hike odds stayed low after the September payrolls miss, despite hawkish Fed commentary; Friday’s 3.7 bp rise came the day Michigan’s long-run inflation expectations reached 3.5%. |
| US Dollar Index (DXY) | 102.21 | +0.29 (+0.28%) | Monday’s euro weakness on French bond-spread fears lifted it to an 18-month high, and Wednesday’s close was the highest in 122 sessions; it held most of the gain into Friday. |
COMMODITIES
Wednesday’s precious-metals break proved a one-session event: platinum fell 4.1% and silver 2.5% against the dollar’s 122-session high, then Friday’s rally across the complex left gold and copper higher on the week. Copper outgaining gold argues for growth-flavoured buying, not a haven trade. Bitcoin was the outlier, falling on the two sessions small caps and tech sold off and finishing lower in a week the S&P 500 rose, behaving as a high-beta tech proxy rather than a hedge.
| Asset | Fri Price | WoW Change | WoW % | Why It Moved (Week) |
|---|---|---|---|---|
| Gold | $4,221.05/oz | +$50.40 | +1.21% | Flat Monday and up Tuesday, it broke 1.23% Wednesday against the dollar’s 122-session high, then rallied 1.54% Friday with no confirmed catalyst to finish higher. |
| Silver | $61.09/oz | +$0.292 | +0.48% | The widest swings in the complex: +1.59% Monday, −2.49% Wednesday and −1.43% Thursday, +2.80% Friday; net little changed. |
| Copper | $6.7083/lb | +$0.1173 | +1.78% | Rose Monday with the risk-on tape, held apart from Wednesday’s precious-metals slide and joined Friday’s broad rally; UBS’s 2027 deficit view was cited but not established as a driver. |
| Platinum | $1,697.70/oz | −$12.70 | −0.74% | Wednesday’s 4.08% drop, the steepest metals decline of the week, outweighed gains on Monday and Friday. |
| Bitcoin | $82,467.00 | −$1,962.00 | −2.32% | Flat through Tuesday’s equity record, then fell 2.48% Wednesday and 2.26% Thursday alongside small caps and tech; no crypto-specific catalyst, and Monday’s CFTC retail-crypto rulemaking notice did not move it. |
ENERGY
Brent’s widening premium over WTI, to about $12.75 from $11.40, says the week’s risk was priced in the Gulf states rather than at home, even with Hurricane Isaias shutting in most of the Gulf of Mexico’s oil output by Thursday. Crude traded against equities at the turn: Thursday’s 3% jump coincided with a 1.4% drop in the tech-heavy index, a supply-shock signature, not a demand read. Gas, not crude, carried the week’s energy gains in both the US and European markets, though no catalyst was confirmed for either.
| Asset | Fri Price | WoW Change | WoW % | Why It Moved (Week) |
|---|---|---|---|---|
| Crude Oil (WTI) | $91.50/bbl | +$0.10 | +0.11% | A round trip: fell about 2% Monday on recovering Middle East exports and the G7 reserve pledge, settled lower Wednesday on the IEA’s accelerated releases, then jumped Thursday as Isaias shut in 63% of US Gulf output. |
| Crude Oil (Brent) | $104.25/bbl | +$1.47 | +1.43% | Held above $100 every session; Thursday’s 3.3% jump on Isaias and revived Middle East risk outweighed Monday’s supply-relief drop, and Friday’s strike on a laden tanker off the UAE kept it there. |
| Natural Gas (Henry Hub) | $3.196/MMBtu | +$0.152 | +4.99% | Up four of five sessions as Isaias formed and shut in Gulf gas output, though the storm link was never confirmed; Thursday’s 85 Bcf storage build brought the only down day. |
| Natural Gas (Dutch TTF) | $26.72/MMBtu | +$1.48 | +5.86% | Three gains of about 3% each outweighed declines Monday and Thursday; no catalyst was confirmed in any session. |
S&P 500 SECTORS — WEEKLY ROTATION
A nine-of-eleven breadth sweep whose two holdouts were the cyclical names, Technology and Industrials. The rotation was defensive, led by the staples and Utilities, and partly single-name: Philip Morris and Walmart, both among the week’s five biggest mega-cap gainers, sit inside the staples lead. Technology’s loss was a semiconductor story, not a sector-wide one: all five of the week’s biggest mega-cap decliners were chip names while software’s Palantir topped the gainers. With Technology still first on six-month and YTD horizons, this reads as a leader pausing, not a regime change.
| Sector | 1-Week | 1-Month | 3-Month | 6-Month | YTD | 12-Month |
|---|---|---|---|---|---|---|
| Consumer Defensive | +4.16% | +1.93% | −0.61% | −0.63% | +6.71% | +7.79% |
| Utilities | +3.76% | −1.67% | −8.80% | −11.87% | −3.14% | −7.70% |
| Energy | +3.23% | −0.55% | +11.44% | +7.99% | +40.60% | +41.46% |
| Consumer Cyclical | +3.06% | +1.31% | −2.03% | +0.42% | −5.93% | −6.80% |
| Healthcare | +2.05% | +1.80% | +2.91% | +11.91% | +8.03% | +14.57% |
| Financial | +1.12% | −4.11% | −2.68% | +7.58% | +2.72% | +7.02% |
| Real Estate | +1.09% | −3.94% | −7.90% | −3.18% | +1.68% | −0.40% |
| Basic Materials | +0.93% | −3.85% | +5.11% | −5.63% | +11.78% | +16.88% |
| Communication Services | +0.85% | +2.73% | −0.63% | +3.35% | +1.17% | +7.18% |
| Industrials | −0.54% | +0.44% | −4.26% | −2.60% | +9.36% | +9.08% |
| Technology | −1.09% | +5.81% | +10.19% | +32.69% | +31.22% | +27.08% |
TOP WEEKLY MOVERS:
The leaderboard split cleanly by momentum. Every decliner was a semiconductor name sitting on an outsized run — Sandisk up more than 500% this year, Intel nearly tripled, Lam, Applied and KLA up 60–100% — and four of the five were still higher on the month, so this reads as profit-taking from extremes that began Tuesday and deepened after Thursday’s OpenAI report, not a broken trend. The gainers had the opposite profile: Walmart, Mastercard and Visa, with YTD gains between zero and 10%, caught the same rotation into steady earners that put staples atop the sector table. Palantir alone carried momentum, extending a 60% three-month run as software decoupled from chips.
TOP 5 WEEKLY GAINERS
| Ticker | Week | YTD | Year | Why It Moved |
|---|---|---|---|---|
| PLTR | +10.75% | +17.61% | +12.71% | Goldman Sachs upgraded it to Buy with a $230 target on Thursday, citing sovereign AI as a roughly $50 billion addressable market; it rose 2.40% that day while Technology fell 1.90%. Friday added 5.17% as software led the rebound after Bloomberg reported OpenAI expects about $70 billion in annualized revenue by year-end. The stock briefly topped $200 but stopped short of its $207.52 record. |
| PM | +7.32% | +25.43% | +28.27% | No single catalyst — broad-sector or momentum move. Rose five straight sessions to its highest close of the past year ($200.50 on Thursday, +4.05%) with no company announcement; coverage attributed the move to defensive buying of staples, the week’s leading sector. Third-quarter results are due around October 20–21. |
| V | +6.87% | +9.91% | +11.07% | No single catalyst — broad-sector or momentum move. Extended a seven-session winning streak to within 5% of its 52-week high with no company-specific trigger, moving in tandem with Mastercard; coverage cited positioning ahead of October 27 results, and Barclays reiterated Buy with a $420 target on Friday. |
| WMT | +6.80% | −0.05% | +9.41% | No single catalyst — broad-sector or momentum move. The week’s company news — Monday’s expansion of Wing drone delivery to Denver and Seattle in 2027 and Wednesday’s holiday-season plans — was not tied to the move by any source. The gain came with the rotation into staples, off a level about 23% below its 52-week high, and leaves the stock roughly flat for the year. |
| MA | +6.68% | +3.20% | +4.36% | No single catalyst — broad-sector or momentum move. Rose five straight sessions alongside Visa with no company-specific trigger; Baird raised its target to $710 from $660 on Friday, and a WSJ report that Trump and Vance back a card-network competition bill did not interrupt the run. Third-quarter results are due October 29. |
TOP 5 WEEKLY DECLINERS
| Ticker | Week | YTD | Year | Why It Moved |
|---|---|---|---|---|
| INTC | −12.26% | +183.74% | +176.98% | Fell four of five sessions. Monday’s 2.63% drop followed Elon Musk’s confirmation that TSMC could join his Terafab chip venture in Texas, where Intel had been the only publicly identified manufacturing partner; Intel says it remains in the project. Thursday’s 5.34% loss came in the chip selloff after the FT’s OpenAI revenue report, and it did not join Friday’s software rebound. |
| LRCX | −8.24% | +86.26% | +126.13% | No single catalyst — broad-sector or momentum move. Fell every session from Tuesday as chip-equipment stocks took profits after their AI-driven rally, even as Morgan Stanley and Cantor Fitzgerald raised their price targets; coverage cited stretched valuations ahead of fiscal first-quarter results on October 21. |
| SNDK | −8.03% | +566.37% | +1119.79% | No single catalyst — broad-sector or momentum move. Profit-taking after a 566% YTD run: coverage tied Tuesday’s drop to SK Hynix’s earnings caution and questions about the timing of data-center demand from Oracle’s Project Jupiter. It bounced Wednesday on a note putting third-quarter memory-chip prices up nearly 20%, then dropped 4.90% Thursday in the OpenAI-driven chip selloff; Friday’s 1.72% decline came the day Nikkei reported Apple cut iPhone 18 Pro orders after memory-driven price increases. |
| AMAT | −6.11% | +97.30% | +130.15% | No single catalyst — broad-sector or momentum move. Slipped Tuesday despite a bullish Goldman Sachs margin call and a new Intel partnership on next-generation transistors that carried no disclosed order value, then fell with chip-equipment peers through the week; coverage pointed to profit-taking after the stock nearly doubled this year. |
| KLAC | −5.47% | +60.95% | +85.64% | Morgan Stanley cut its price target to $227 from $253 on Tuesday, lowering its valuation multiple to 28 times from 36 while raising its 2027 estimates and keeping Overweight; the stock fell 4.54% that day with chip-equipment peers and did not recover as the group weakened through Thursday. |
— Institutional-grade intelligence for serious investors. Apply for membership at join.recessionalert.comC. WEEK’S TOP STORIES -> TOP
Three threads run through the week’s eight stories. The AI build-out came under scrutiny from every side at once — its revenue (#1), its financing (#3), its power supply (#7) and its owners’ push into new industries (#8). Energy split into threat and response: attacks spread beyond Hormuz and a hurricane reached the Gulf of Mexico (#2, #4) while Washington pulled every diesel lever it has (#5). The third thread, the Fed’s independence (#6), arrives just as the AI borrowing in #3 tests how much long-term money is left for the Treasury.
UNCERTAIN
1. OpenAI Revenue Whiplash Splits the AI Trade: The FT’s $50 Billion Run-Rate Sinks Chips Thursday, Bloomberg’s $70 Billion Target Rescues Only Software Friday — Technology Finishes the Week Last
The core facts:The week opened with AI hardware at full strength. On Tuesday Marvell raised its fiscal 2028 revenue target to about $20 billion from about $18 billion and set a first fiscal 2031 goal of $70–90 billion; the stock rose 5.81%, Cisco 4.54% and Arista 4.09%, AMD closed at a record, and the S&P 500 made its first close above 7,800. On Thursday the Financial Times reported that OpenAI’s annualized revenue was near $50 billion at the end of September, “about $20bn less than has been previously signalled,” according to documents shared with investors. Technology fell 1.90% and the Nasdaq 100 1.39%, led by Oracle (−5.48%), Intel (−5.34%), SanDisk (−4.90%), Micron (−4.79%) and Broadcom (−4.35%). Late Thursday Bloomberg reported that OpenAI expects to reach or exceed $70 billion in annualized revenue by year-end and attributed the gap to a method that treats cloud-provider sales differently; OpenAI declined to comment. Friday’s rebound ran through software — Palantir +5.17%, Palo Alto Networks +5.09%, CrowdStrike +4.57%, Microsoft +2.38% — while Intel, AMD and Sandisk kept falling. The same day Nikkei reported Apple cut October iPhone 18 Pro component orders by at least 15% after a $100 price increase it blames on AI-driven memory costs.
Why it matters:OpenAI is the revenue line behind a large share of committed AI compute spending, so a dispute over its run-rate goes straight to who pays for the build-out — and Friday showed the market will not re-underwrite that spending on a disputed figure. The week therefore ended with the AI trade split in two: companies selling AI to users recovered, while the suppliers of capacity did not. The receipts are stark: Technology finished last of eleven sectors and the only one besides Industrials to fall (see sector rotation table in Section B), all five of the week’s biggest mega-cap decliners were chip names, and Palantir topped the gainers (see weekly movers table). Apple’s cut adds a second channel: AI demand is raising memory costs enough to dent volumes in consumer hardware, so part of the chipmakers’ pricing power is now coming out of their own customers.
What to watch:ASML’s results on Wednesday, October 14 and Taiwan Semiconductor’s on Thursday, October 15 are the first hard reads on AI capital spending this season; strong orders would test whether the chip group’s lag is fundamental or positioning. Any clarification from OpenAI itself would settle which run-rate is right.
BEARISH
2. Gulf Attacks Widen All Week — a Saudi Pipeline Hit, a Record Weekly Tanker Count, a Laden Supertanker Struck Off the UAE — as Trump Rules Out Iran Strikes Before the Midterms; Brent Holds Above $100 Every Session
The core facts:Monday: the Houthis claimed weekend strikes on Saudi Aramco sites, and a single Saudi source told AFP the East-West pipeline’s Khurais pumping station was hit again; up to four tanker attacks were logged near Hormuz from October 2 to 4. Crude still fell about 2% as Middle East exports topped pre-war levels and Aramco cut November prices for Asia to six-year lows. Tuesday: Saudi Arabia’s energy minister said the Hormuz-bypass pipeline was back to 5.8 million barrels a day, against capacity of about 7 million, while Houthi strikes hit airports in Jazan and Najran. Wednesday: a Reuters exclusive counted at least 12 attacks on tankers around Hormuz in the week to October 5, the most since the war began on February 28, and The Atlantic reported the White House had asked the Pentagon for Iran strike options usable before the November 3 midterms. Thursday: President Trump posted that the US “will not be attacking Iran at any time prior to the midterm elections,” and Treasury sanctioned 17 shadow-fleet tankers and 13 companies; only seven vessels had transited the strait on Tuesday. Friday: the fully laden supertanker GEM NO.2 was struck by an unknown projectile at anchor 13 nautical miles off the UAE, and Iran’s Revolutionary Guard navy said it had hit an LPG carrier on an “unauthorized” route south of the strait and that enforcement would no longer be confined to Hormuz. Brent finished at $104.25.
Why it matters:Two things moved in opposite directions. The most acute risk, a US strike, got a hard expiry date; the zone of attack spread beyond the strait into anchorages and loading areas that had been treated as safe, and Iran now claims that reach explicitly. Exports are recovering under rising fire rather than because fire has eased, which is why Brent never settled below $100 and finished the week higher even as Gulf exports climbed (see Energy table in Section B). Because crude was flat on Friday, the wider risk zone is not yet in the price; it reaches delivered costs through freight rates and war-risk insurance first. For rates, this is the energy channel the Fed minutes cited as one reason to keep hiking.
What to watch:Daily Hormuz transit counts and any US Central Command response to strikes outside the strait; the strike pledge expires on November 3, so the risk premium may rebuild into that date rather than fade.
UNCERTAIN
3. The 10-Year Hits a 24-Year Closing High, Then Three Auctions Prove Buyers Exist at 5.3% — as the Fed Minutes and SpaceX’s $40 Billion Debt Plan Name AI Borrowing as the New Rival for Their Money
The core facts:On Monday the 10-year Treasury yield closed at 5.315% and the 30-year also posted its highest close in more than two decades, in a bear steepener that left the 2-year lower; the dollar reached an 18-month high as the euro fell below $1.12 on French bond-spread stress. Tuesday’s $58 billion 3-year auction cleared at 4.932%, the highest for the tenor since May 2006, on softer indirect demand. That evening the Financial Times reported SpaceX is seeking about $40 billion — roughly $10 billion of bank loans and $30 billion of investment-grade debt — to buy Nvidia chips, and Treasuries sold off Wednesday morning, the 10-year touching 5.364% intraday. The $39 billion 10-year auction then cleared at 5.300% with a 2.77 bid-to-cover and primary dealers left with just 2.5%. Wednesday’s FOMC minutes recorded market commentary attributing part of the rise in term premiums to “competition for capital from heavy private debt issuance to finance the development of artificial intelligence (AI) infrastructure.” Thursday’s $22 billion 30-year reopening cleared at 5.618% with dealers taking 6.8%. Freddie Mac’s 30-year mortgage rate rose to 7.40%.
Why it matters:The week answered the question hanging over the long end — whether there are end buyers at these yields — with yes, and the 10-year finished lower on the week after Monday proved the peak (see Vol & Treasuries table in Section B). But it answered a second question less comfortably: the price. Crowding out is showing up as a higher clearing yield, not as unsold bonds, and the Fed’s own minutes now name AI infrastructure borrowing as one of the competitors setting that price. SpaceX’s plan is a concrete instance, and it links this story directly to story #1: the AI build-out is simultaneously the market’s biggest source of equity earnings hopes and a growing claimant on the long-dated capital the Treasury needs. The cost lands on housing first, with mortgage rates more than a point above a year ago.
What to watch:The September Monthly Budget Statement on Tuesday, October 13, which closes the fiscal year and sizes the financing need, September CPI on Wednesday, October 14, and any formal SpaceX bond launch and its pricing against investment-grade peers.
UNCERTAIN
4. Hurricane Isaias Shuts In 63% of US Gulf Oil Output Ahead of a Friday-Night Landfall; Crude Jumps 3% Thursday and Energy Finishes Among the Week’s Top Three Sectors
The core facts:Tropical Storm Isaias formed in the Gulf of Mexico on Wednesday, when operators had already shut in 25.08% of the Gulf’s oil production and 16.37% of its gas. By Thursday, as Isaias became the first hurricane of the 2026 Atlantic season, shut-ins reached 62.89% of oil and 57.35% of gas output, with 121 of 371 manned platforms evacuated; BP evacuated Na Kika and Thunder Horse, and Shell and Chevron curtailed operations. Landfall was forecast near the Mississippi-Alabama-Florida border on Friday night, with about 0.5 million barrels a day of refining capacity, including the Pascagoula refinery, in its path. Reuters estimates about 9 million barrels of production will be lost. WTI settled up $3.21 at $91.49 and Brent up $4.08 at $104.28 on Thursday, and Energy was the session’s best sector, with Chevron up 3.12% and ExxonMobil 2.71%. Crude was flat on Friday.
Why it matters:Offshore shut-ins usually reverse within days once platforms are reboarded, and Friday’s flat close says the market is pricing a temporary outage rather than damage. The lasting exposure is onshore: Gulf Coast refining, in a week when diesel was already the tightest part of the barrel and Washington was spending reserves and political capital to ease it (story #5). The storm also landed on the one sector that had been holding up the commodity side of the market: Energy finished the week up 3.23% and remains the year’s best sector (see sector rotation table in Section B), and Henry Hub gas was up nearly 5% on the week.
What to watch:Post-landfall damage reports from Gulf Coast refineries over the weekend and the pace of platform reboarding; WTI holding above $90 into next week would signal the market is pricing damage rather than a short outage.
BULLISH
5. Washington Pulls Three Levers on the Diesel Shortage in Five Days: A Tax-Relief Order, an IEA Release Speed-Up With Diesel First, and a License for Russian Diesel Imports
The core facts:Monday: President Trump signed an executive order in Grand Island, Nebraska temporarily authorizing highway use of tax-free dyed diesel and deferring the 24.4-cent federal diesel excise tax through the end of 2026; the White House put the saving at about $60 per 250-gallon fill. Diesel reached a record of about $6.50 a gallon last month, and Energy Department data showed the Strategic Petroleum Reserve at 283 million barrels, its lowest since October 1982. Wednesday: IEA member governments backed accelerating the releases announced in March and prioritising diesel “given the current tightness in diesel markets”; about 325 million barrels have been released, with about 100 million pledged but not yet delivered. Crude settled lower despite a surprise 3.2 million-barrel US inventory draw. Friday: Treasury issued General License 135, authorizing the importation, including into the United States, of Russian-origin diesel until April 7, 2027, after the President said Russia would “immediately supply over 300,000 Tons” with more to follow in November; Russia’s own ban on most diesel exports runs through October 31.
Why it matters:Diesel, not crude, is where the energy shock bites US freight, farm and goods costs, and this week the administration attacked it from the tax side, the stockpile side and the sanctions side at once. The Russian license is the significant one: it addresses the product shortage directly and reverses sanctions policy toward Moscow less than four weeks before the midterms, carrying political risk alongside its disinflationary effect. The limits are visible too. The tax measure is a deferral, the IEA step brings forward barrels rather than adding them, and a reserve at a 44-year low leaves less cushion for the wider attacks in story #2 or storm damage from story #4.
What to watch:Whether the first 300,000 tons of Russian diesel actually load, next week’s IEA Governing Board review, and Russia’s decision on its export ban when it expires on October 31; September CPI on October 14 shows how much energy is adding to inflation before any relief arrives.
UNCERTAIN
6. The White House Builds a Process to Fire Fed Governor Lisa Cook, With a Hearing on November 5, Two Days After Trump Says the Board “Would Like to See the Country Do Badly”
The core facts:On Wednesday, asked about mortgage rates in the Oval Office, President Trump called Fed Chair Kevin Warsh “great” but said the rest of the Board “would like to see the country do badly, in my opinion, because I think interest rates should come down.” Treasury Secretary Bessent said inflation, mortgage rates “and the 10-year will come back down” once the Iran conflict ends. On Friday a presidential memorandum dated October 7 was made public establishing a three-member committee — the Assistant to the President for Economic Policy, the chair of the EEOC and the director of the Office of Government Ethics — to report “whether there is ‘cause’ for Governor Cook’s removal” under 12 U.S.C. 242 as construed by the Supreme Court in Trump v. Cook. Cook’s written position is due three days before a closed, four-hour hearing at the White House on Thursday, November 5, with a post-hearing statement due by November 10. No market reaction was identified.
Why it matters:The Supreme Court allowed a renewed removal attempt if it came with notice and a hearing; this memorandum supplies exactly that, turning a legal tail risk into a scheduled process with a decision plausible before year-end. Read together with Wednesday’s remarks, the pressure is aimed at the governors rather than the Chair, at the moment most of the Committee expects another hike. The hearing sits between the October 27–28 meeting and December’s, so the composition of the Board that decides the next move is now itself uncertain. A removal through an executive fact-finding process would make every Board seat more exposed to politics, and that is a risk investors would price into long-dated yields — already a few basis points from a 24-year high (story #3).
What to watch:Cook’s written response due Monday, November 2 and any legal challenge to the committee before the November 5 hearing; a widening gap between 10-year and 2-year yields would be the market’s signal of a rising term premium.
BULLISH
7. Google Underwrites 890 MW of New Nuclear Capacity From Constellation for 20 Years; Constellation Jumps 12% and Utilities Hold Their Gain Through the Chip Selloff
The core facts:On Tuesday Google and Constellation Energy announced a 20-year power purchase agreement to bring 890 megawatts of new nuclear capacity onto the PJM grid through uprates at 11 Constellation units in Illinois, Pennsylvania and New Jersey, plus a 15-year supply agreement for a further 2,700 MW from Constellation’s existing PJM fleet. Constellation will invest more than $4.3 billion, with the first uprate expected by 2028, and selected Google Cloud and Gemini Enterprise under an expanded five-year technology alliance. Constellation shares rose 12.25% to $300.40 and Utilities led all eleven sectors that day with a 2.79% gain.
Why it matters:A hyperscaler signing for two decades turns AI power demand into contracted utility revenue rather than a forecast, and uprating existing reactors is the fastest route to new firm, carbon-free capacity. The weekly view adds the more useful signal: Utilities held the gain through Thursday’s AI selloff and finished the week second among sectors (see sector rotation table in Section B), while the chipmakers in story #1 gave theirs back. The power leg of the AI build-out, backed by long contracts, traded as the safer way to own the theme in a week the compute leg was questioned. It lands on a sector still down nearly 12% over six months, so the re-rating has room if more deals follow.
What to watch:Whether other hyperscalers sign comparable uprate or supply contracts, and whether Utilities extend their leadership once the defensive rotation of this week fades.
BEARISH
8. SpaceX Buys Nationwide 800 MHz Spectrum for Starlink Mobile, and AT&T, T-Mobile and Verizon Fall 5% to 7% After Hours
The core facts:After Thursday’s close SpaceX agreed to acquire all of Grain Management’s nationwide 800 MHz spectrum, up to 14 megahertz of paired low-band frequencies, for its Starlink Mobile service. Terms were not disclosed and the deal needs FCC approval; Grain bought the licenses from T-Mobile for $2.9 billion and was reported in August to be seeking about $6 billion. Low-band spectrum lets Starlink Mobile add a terrestrial layer that reaches indoors, and most existing phones already support the band. Earlier in the week the FCC approved Starlink Mobile’s second-generation constellation of 15,000 satellites. In after-hours trading AT&T fell 6.75%, T-Mobile 5.4% and Verizon 5%, and on Friday Communication Services was one of only two sectors to close lower as the carriers sank.
Why it matters:The deal turns SpaceX from a satellite partner of the carriers into a would-be carrier with the low-band spectrum that indoor coverage requires. The three national networks are owned as defensive income stocks, and a credible new competitor goes to the stability of the subscriber base that justifies that valuation — in a week when investors were otherwise rotating into exactly that kind of defensive income. The challenger is also one of the AI build-out’s biggest new borrowers (story #3), so its expansion into telecom will be financed in the same bond market the carriers depend on.
What to watch:Any response from AT&T, Verizon or T-Mobile, the FCC review timetable for the transfer, and carrier commentary on subscriber competition in third-quarter results.
— Separating signal from noise since 2007. Apply for membership at join.recessionalert.comD. WEEK IN THE ECONOMY -> TOP
The week’s macro tension was a lopsided version of cooling labor + sticky services. The services half is unambiguous: ISM’s prices index hit its highest since July 2022 on Monday, and by Friday households expected the pressure to last, with Michigan long-run expectations at 3.5% and the New York Fed’s one-year gauge at 3.9%. The labor half rests on softer evidence — a falling employment-trends index and more consumers saying jobs are hard to get — set against jobless claims near 1969 lows. That imbalance is why most Fed officials, Waller and Musalem among them, now argue for more hikes. Markets had already priced the destination: Polymarket’s 2026 hike odds sat at 100% on both Fridays and the 2-year and 10-year yields both finished lower, so the debate has moved from whether to when. Wednesday’s September CPI, expected at 3.6%, will show whether October 28 is the date.
POLYMARKET ODDS — WEEK-ON-WEEK SHIFT:
| Market | Last Friday | This Friday | Δ |
|---|---|---|---|
| US Recession by end-2026 | 8% | 7% | −1.0 pp |
| Fed rate hike in 2026 | 100% | 100% | 0.0 pp |
| Fed rate cuts ≥1 in 2026 | 4% | 4% | 0.0 pp |
UNCERTAIN
Fed Minutes Show Most Officials See Another Hike by Year-End, and Waller and Musalem Back It — With Flexibility on Timing (Federal Reserve, Wed, Oct 7 – Thu, Oct 8)
What they’re saying:Minutes of the September 15–16 meeting, which raised the target range a quarter point to 3.75%–4.00% on a 12-0 vote, state that “most participants assessed that another increase in the target range for the federal funds rate would likely be appropriate by year end,” with inflation risk “skewed to the upside” and several officials calling policy “not restrictive or only mildly restrictive.” On Thursday Governor Waller said he anticipates additional hikes but that they “do not need to come at consecutive meetings,” citing core PCE inflation of 3% and noting that 16 of 18 September projections showed at least one more increase this year. St. Louis Fed President Musalem said “more monetary policy firming will be required,” with rates going up “in the next six to nine months,” but declined to prejudge October. On Tuesday San Francisco Fed President Daly said further hikes depend on whether the tariff, oil and AI shocks fade or compound.
The context:The news in the week’s Fed messaging was timing, not direction. Waller’s “not at consecutive meetings” and Musalem’s six-to-nine-month window stretch the cycle into 2027 rather than front-loading it, which is why the market took three hawkish signals in stride: the 2-year and 10-year finished the week 3.6 and 3.2 bps lower (see Vol & Treasuries table in Section B) and Polymarket’s 2026 hike odds were unchanged at 100% (see Polymarket table above). The minutes’ split rationale matters for what comes next: officials citing energy shocks could lose their case if fuel prices fall, while those citing AI-driven demand would not. On Friday futures put the odds of a December increase at 82%.
What to watch:September CPI on Wednesday, October 14, the last inflation report before the October 27–28 meeting; a hot reading would test how much timing flexibility survives.
BEARISH
Inflation Expectations Rise on Two Surveys — NY Fed One-Year at 3.9%, Highest Since May 2023; Michigan Long-Run at 3.5% as Sentiment Misses at 46.3 (NY Fed, Wed, Oct 7; University of Michigan, Fri, Oct 9)
What they’re saying:The New York Fed’s September Survey of Consumer Expectations put median one-year inflation expectations at 3.9%, up from 3.6%, with three-year expectations at 3.3% and five-year steady at 3.0%; the perceived probability of losing one’s job fell to 13.5%, the lowest since December 2024. Michigan’s preliminary October sentiment index fell to 46.3 from 48.1, below the 47.6 consensus, as current conditions dropped to 44.7 from 50.9 against a 50.5 forecast while expectations rose to 47.3. Year-ahead inflation expectations rose to 4.7% from 4.6% and long-run expectations to 3.5% from 3.4%, both the highest since May. A Michigan special report found only 31% of consumers plan to keep buying as usual where prices have jumped; 54% plan to cut back and 16% to stop.
The context:Two independent surveys moved the same way in the same week, and it was the long-run Michigan reading, now up two months running, that matters most to a Fed trying to show the energy shock is not becoming entrenched. Both surveys also show households feeling secure in their jobs while expecting to cut back where prices have jumped, so the pressure is landing on what they buy rather than on whether they work — the version of the problem that shows up in spending before it shows up in payrolls. The 2-year yield rose 3.7 bps on Friday, the only day it rose all week, though no source tied the move directly to the release.
What to watch:September CPI on Wednesday, October 14 (expected 3.6% from 3.4%), September retail sales on Thursday, October 15 as the first hard test of whether weaker sentiment is reaching spending, and the final October Michigan reading on Friday, October 23.
BEARISH
ISM Services Holds at 54.9, in Line With Forecasts, but Prices Paid Jumps to 74.0, Highest Since July 2022; S&P Global and Freight Gauges Confirm the Cost Pressure (ISM, Mon, Oct 5)
What they’re saying:The ISM Services PMI registered 54.9 in September against a 55.0 consensus and 55.4 in August, its 27th straight month of expansion. Business activity fell 5.2 points to 56.5 and new orders slipped to 59.8, while employment rose 2.3 points to 50.1. The Prices Index rose 1.4 points to 74.0, above 70 for the sixth time in seven months. S&P Global’s final services PMI rose to 58.8, the fastest expansion since July 2021, with input cost inflation at its steepest since November 2022. On Tuesday the Logistics Managers’ Index rose to 70.2, with transportation prices at 92.7 and capacity contracting.
The context:Monday’s market ignored it — the 2-year fell as hike odds stayed low after the September payrolls miss — but the print set the agenda the Fed then spoke to for the rest of the week. Services is where most core inflation sits, and three separate gauges now show costs rising with capacity tight, the combination that passes increases through to final prices. It is the clearest evidence of the week that the price pressure is not just energy, which weakens the argument that a fall in oil alone would let the Fed stop.
What to watch:Core CPI on Wednesday, October 14 (expected 0.2% on the month) for whether services prices are reaching consumers, and September PPI on Thursday, October 15.
UNCERTAIN
Jobless Claims Fall to 197,000, Near the Lowest Since 1969, Even as the Conference Board’s Employment Trends Index Drops 0.5% (Department of Labor, Thu, Oct 8; Conference Board, Mon, Oct 5)
What they’re saying:Initial claims fell 2,000 to 197,000 in the week ending October 3, below the 200,000 expected, and the four-week average fell to 198,000; continuing claims rose 17,000 to 1,716,000. The Conference Board’s Employment Trends Index fell to 107.56 in September from 108.08, ending two monthly gains, as the share of consumers saying jobs are “hard to get” rose to 21.9% from 20.3% and the share of small firms with positions they could not fill fell to 32% from 35%.
The context:The week’s labor data describe a market that has stopped hiring without starting to fire. Claims near 1969 lows say layoffs are not rising; the trends index, the consumer “hard to get” reading and the September payrolls gain of 29,000 reported the previous Friday say hiring has slowed. That combination gave the Fed no reason to soften: Waller called the labor market “solid and stable” the day the claims printed, and the recession odds in the Polymarket table edged down a point. The 17,000 rise in continuing claims is the detail to track, because it is where slower hiring shows up first.
What to watch:Initial claims on Thursday, October 15 (expected 197,000) and the ADP weekly employment estimate on Tuesday, October 13.
UNCERTAIN
GDPNow Holds Near 3.6% for Q3 Despite a Wider-Than-Expected $105.6 Billion Trade Deficit — but Inventories Supply More Than Half of It (BEA, Tue, Oct 6; Atlanta Fed, Thu, Oct 8)
What they’re saying:The August goods and services deficit widened to $105.6 billion from a revised $92.8 billion, wider than the $102 billion consensus, as imports rose 4.3% on crude oil, gold and semiconductors. The Atlanta Fed’s GDPNow model cut net exports’ contribution to −2.69 points but held third-quarter growth at 3.7% on stronger consumption and investment nowcasts. On Thursday, after a downward revision to August wholesale inventories, it eased to 3.6%, with inventory investment contributing 1.98 points. Wholesale sales rose 1.8% in August, while consumer credit rose only $8.3 billion against $15 billion expected as card balances contracted.
The context:There is no growth scare to offset the inflation side of the ledger: a nowcast near 3.6% even after a 4.3% import surge supports the Fed’s view that activity is firming, which is why the week’s recession odds barely moved. The quality is the concern. With stockbuilding supplying about 55% of the estimate and household credit growth slowing, the quarter rests more on inventories than on final demand — and inventory gains tend to reverse.
What to watch:September retail sales, August business inventories and the GDPNow update, all on Thursday, October 15.
— Know the probability before the market prices in the risk. Apply for membership at join.recessionalert.comE. WEEK IN EARNINGS -> TOP
TOP EARNINGS OF THE WEEK
UNCERTAIN
1. PepsiCo (PEP): +3.73% on Thursday | Beats on Revenue and Core EPS, but Cuts Full-Year Core EPS Growth to 2.5%–3.5% to Fund a North America Reset
The Numbers:Reported before the open on Thursday, October 8. Revenue $25.27 billion vs. $24.95 billion expected (+5.6% year over year; organic +3.1%). Core EPS $2.34 vs. $2.29 expected (+2%); reported EPS $2.23 (+17%). Fiscal 2026 guidance: organic revenue growth about 3% (prior 2%–4%), net revenue growth about 6% (prior 4%–6%), core EPS growth 2.5%–3.5% (prior: low end of 5%–7%), and core constant-currency EPS growth 1%–2% (prior: low end of 4%–6%).
The Problem/Win:The beat came from abroad and from one-offs. Organic revenue grew 9% in EMEA and Asia Pacific Foods, 7% in International Beverages and 6% in Latin America Foods, while both North American businesses were flat and North American beverage volume fell 3%. Core operating profit rose 3% despite 35 basis points of margin contraction, and a 4-point favorable tariff-refund effect was part of that gain. Management is lowering the year’s earnings growth to spend more on North American innovation, funded by “additional structural cost reduction actions.”
The Ripple:Consumer Defensive rose 2.17% on Thursday, with Coca-Cola up 2.27% and Philip Morris up 4.05%, though no source tied those moves to PepsiCo’s report. The sector went on to lead all eleven for the week.
What It Means:Investors paid for international volume and a reinvestment story while accepting a sharp cut to this year’s earnings growth — and the tariff refund that flattered the quarter is a non-recurring item that a nationwide class of importers is now also pursuing. Until North American organic growth turns, the multiple rests on the promise of the reset rather than on its results.
What to watch:The size and timing of the structural cost actions, and whether North American organic revenue turns positive next quarter.
WEEK AHEAD PREVIEW:
Q3 2026 earnings season is just beginning (3.8% of the S&P 500 reported as of October 9). The large banks, Johnson & Johnson and UnitedHealth open the season in earnest on Tuesday, October 13; ASML, Bank of America, Morgan Stanley, BlackRock and Progressive follow on Wednesday, October 14; and Charles Schwab and Prologis report on Thursday, October 15.
JPMorgan Chase (JPM) — BMO, Tuesday, October 13 — Consensus EPS $5.93 on revenue of $51.23 billion. Key focus: net interest income guidance with Fed officials signaling more hikes and the 2-year yield at 4.793%, trading revenue in a volatile rates quarter, and credit commentary after its own strategists flagged the most deeply distressed leveraged loans since March 2020.
Johnson & Johnson (JNJ) — BMO, Tuesday, October 13 — Consensus EPS $2.50 on revenue of $25.38 billion. Key focus: medtech exposure to the coming Section 232 device tariffs after Becton Dickinson’s investment-for-relief deal, and pharmaceutical growth guidance for 2027.
UnitedHealth Group (UNH) — BMO, Tuesday, October 13 — Consensus EPS $4.15 on revenue of $111.31 billion. Key focus: medical cost trends and margin guidance for 2027, plus its first comments on the 2027 Medicare Advantage Star Ratings published October 8, which drive quality-bonus revenue.
Goldman Sachs (GS) — BMO, Tuesday, October 13 — Consensus EPS $12.86 on revenue of $16.83 billion. Key focus: advisory and underwriting fees in an active quarter for large mergers and AI-related debt financing, and fixed-income trading revenue with the 10-year above 5.2%.
Wells Fargo (WFC) — BMO, Tuesday, October 13 — Consensus EPS $1.85 on revenue of $22.31 billion. Key focus: management’s first comments on HUD’s new fair-lending investigation, mortgage volumes with Freddie Mac’s 30-year rate at 7.40%, and net interest income guidance.
Citigroup (C) — BMO, Tuesday, October 13 — Consensus EPS $2.65 on revenue of $23.72 billion. Key focus: markets and services revenue, card credit costs, and progress on its return-on-equity targets.
ASML Holding (ASML) — BMO, Wednesday, October 14 — Consensus EPS $12.14 on revenue of $13.16 billion. Key focus: EUV order intake from AI and memory customers after a week in which chipmakers fell on doubts over OpenAI’s revenue and did not join Friday’s software rebound; the outlook for China sales; and 2027 guidance as the first major read on chip-equipment demand this season.
Bank of America (BAC) — BMO, Wednesday, October 14 — Consensus EPS $1.10 on revenue of $30.58 billion. Key focus: net interest income guidance and deposit costs as rates rise, consumer credit quality as Michigan’s current-conditions gauge falls to 44.7, and trading revenue.
Morgan Stanley (MS) — BMO, Wednesday, October 14 — Consensus EPS $2.93 on revenue of $19.93 billion. Key focus: wealth-management net new assets and fee growth, and investment-banking and equities trading revenue.
BlackRock (BLK) — BMO, Wednesday, October 14 — Consensus EPS $14.33 on revenue of $7.43 billion. Key focus: fixed-income fund flows with long-dated yields above 5%, private-markets fundraising, and the base-fee effect of higher equity markets.
Progressive (PGR) — BMO, Wednesday, October 14 — Consensus EPS $4.30 on revenue of $22.61 billion. Key focus: underwriting margins after the August combined ratio worsened to 89.3% from 83.1% a year earlier as premium growth slowed to 6%, and auto policy growth.
Charles Schwab (SCHW) — BMO, Thursday, October 15 — Consensus EPS $1.66 on revenue of $7.20 billion. Key focus: net interest revenue and client cash balances as the Fed signals more hikes, trading activity in a volatile quarter, and net new client assets.
Prologis (PLD) — BMO, Thursday, October 15 — Consensus EPS $0.78 on revenue of $2.18 billion. Key focus: warehouse leasing demand and occupancy as tariff refunds and higher rates reshape importers’ inventory decisions, rent growth on renewals, and progress on its data-center development pipeline.
No company above $100 billion reports on Monday, October 12 (Columbus Day), or Friday, October 16. Taiwan Semiconductor (ADR) reports on Thursday, October 15, and BNY Mellon ($96.83 billion) reports the same morning, just below this section’s threshold.
— US market commentary trusted by family offices and institutions. Apply for membership at join.recessionalert.comF. NEXT WEEK SETUP -> TOP
UPCOMING RELEASES:
| Date | Event | Why It Matters |
|---|---|---|
| Tue Oct 13 | ADP Employment Change Weekly (prior 23.75K) | The first private hiring read after a week in which claims sat near 1969 lows but the employment-trends index fell; a soft reading would firm the picture of a labor market that has stopped hiring without starting to fire. |
| Tue Oct 13 | Existing Home Sales – Sep (expected 3.97M, prior 3.98M) | The first turnover read since mortgage rates reached 7.40%–7.49%; a print below 3.9 million would show the long-end selloff biting housing volumes. |
| Tue Oct 13 | Existing Home Sales MoM – Sep (prior -2%) | A second straight monthly decline would confirm that housing is adjusting through volume rather than price, with annual home-price gains already below inflation. |
| Tue Oct 13 | Monthly Budget Statement – Sep (prior -$167B) | Closes the fiscal year and sizes the financing need behind this week’s 3-, 10- and 30-year auctions; a larger gap adds supply to a long end already competing with AI borrowers for capital. |
| Wed Oct 14 | MBA 30-Year Mortgage Rate (prior 7.49%) | Shows whether the 10-year’s retreat from Monday’s 24-year closing high is reaching borrowers after two straight weeks of falling mortgage applications. |
| Wed Oct 14 | CPI Inflation Rate MoM – Sep (expected 0.6%, prior 0.4%) | The week’s decisive print: an energy-heavy 0.6% is already expected, so anything hotter tests whether the Fed keeps the timing flexibility Waller described before the October 27–28 meeting. |
| Wed Oct 14 | CPI Inflation Rate YoY – Sep (expected 3.6%, prior 3.4%) | A rise to 3.6% would match this week’s jump in household inflation expectations and keep an October hike firmly in play. |
| Wed Oct 14 | Core Inflation Rate MoM – Sep (expected 0.2%, prior 0.3%) | Tests whether services prices running at ISM’s 74.0 are reaching consumers; 0.3% or higher would undercut the view that inflation is only an energy problem. |
| Wed Oct 14 | Core Inflation Rate YoY – Sep (expected 2.5%, prior 2.4%) | The measure that separates the Fed officials citing energy shocks from those citing AI-driven demand; a rising core strengthens the case that does not depend on oil. |
| Wed Oct 14 | CPI index NSA / s.a. – Sep (prior 334.98 / 334.131) | The index level behind the headline rates; it matters mainly for inflation-linked contracts and TIPS accruals rather than for the policy read. |
| Wed Oct 14 | API Crude Oil Stock Change (prior -2.09M) | The first private inventory read covering Hurricane Isaias’s shut-ins; a large draw would point to lost Gulf output that outlasted the storm. |
| Thu Oct 15 | PPI MoM – Sep (prior 0.4%) | Pipeline inflation after a month of transportation prices above 90 in the logistics index and Brent above $100; a hot reading would reinforce the services-cost signal. |
| Thu Oct 15 | Core PPI MoM – Sep (prior 0.2%) | Strips out energy and food to show whether producer cost pressure is broadening beyond fuel. |
| Thu Oct 15 | Retail Sales MoM – Sep (prior 1.2%) | The first hard test of whether Michigan’s collapse in current conditions, and consumers’ plans to cut back where prices jumped, are reaching actual spending. |
| Thu Oct 15 | Retail Sales Ex Autos MoM – Sep (prior 1.4%) | Removes autos, where borrowing costs bite first, to show how broad nominal spending stayed with gasoline back near $4.50 a gallon. |
| Thu Oct 15 | Retail Sales Control Group MoM – Sep (prior 1.4%) | Feeds GDP directly; with inventories supplying more than half of GDPNow’s 3.6%, this line decides how much of third-quarter growth is final demand. |
| Thu Oct 15 | Initial Jobless Claims (expected 197K, prior 197K) | Another reading near 197,000 would leave the labor market offering the Fed no reason to pause; the continuing-claims line is where slower hiring would show first. |
| Thu Oct 15 | NY Empire State Manufacturing Index – Oct (prior 7.60) | The first factory read for October, with prices-paid components that show whether energy and tariff costs are still climbing. |
| Thu Oct 15 | Philadelphia Fed Manufacturing Index – Oct (prior 37.8) | Comes off an unusually strong 37.8; a sharp drop would be the first hint that third-quarter strength is fading into the fourth. |
| Thu Oct 15 | Business Inventories MoM – Aug (prior 0.8%) | Stockbuilding is carrying third-quarter growth, and this release revises how much of the GDPNow estimate it accounts for. |
| Thu Oct 15 | Atlanta Fed GDPNow – Q3 (prior 3.6%) | Folds in retail sales and inventories the same day; a cut below 3% would be the first sign of a growth scare to set against the inflation data. |
| Thu Oct 15 | EIA Crude Oil Stocks Change (prior -3.186M) | The official measure of the barrels Isaias kept off the market; a second large draw would help hold WTI above $90. |
| Thu Oct 15 | EIA Gasoline Stocks Change (prior 0.382M) | Shows whether Gulf Coast refining came through the storm intact; a draw would push pump prices back toward their $4.50 highs. |
| Fri Oct 16 | Export Prices MoM – Sep (prior 0.6%) | Gauges how much of the US energy price shock is being passed on to foreign buyers as Brent’s premium over WTI widens. |
| Fri Oct 16 | Import Prices MoM – Sep (prior 0.7%) | With the dollar near an 18-month high, a firm reading would show imported inflation coming from fuel and tariffs rather than from the currency. |
| Fri Oct 16 | Industrial Production MoM – Sep (expected 0.3%, prior 0%) | Shows whether factory output is following the strong services surveys after a flat August, a check on how broad the third-quarter strength really is. |
| Fri Oct 16 | Net Long-term TIC Flows – Aug (prior -$27.9B) | Measures foreign demand for US securities; another outflow would sharpen the long-end supply question this week’s auctions only partly answered. |
WHAT TO WATCH NEXT WEEK:
1. Does Wednesday’s CPI turn “by year-end” into “October 28”? The minutes, Waller and Musalem all point to another hike but leave the meeting open; headline is expected at 3.6% and core at 0.2% on the month, so a hot core reading is what would pull the move forward.
2. Can ASML and TSMC repair the chip trade the OpenAI revenue dispute broke? ASML reports Wednesday and Taiwan Semiconductor Thursday; strong AI orders would say this week’s chip selloff was positioning, while caution would confirm that the market is right to separate AI’s users from its suppliers.
3. Do the banks confirm the credit warnings building beneath the index? JPMorgan, Goldman Sachs, Wells Fargo and Citigroup report Tuesday, after JPMorgan’s own strategists counted $65 billion of deeply distressed leveraged loans and Wells Fargo drew a HUD fair-lending probe; with yields this high, net interest income guidance and loan-loss provisions will show who is benefiting and who is carrying the risk.
4. Does Isaias leave lasting damage — and does Russian diesel actually arrive? Post-landfall refinery reports and Thursday’s EIA data will show whether the storm cost barrels or only days, while the first loading of the 300,000 tons of Russian diesel tests whether this week’s supply levers deliver real relief.
5. Are consumers acting on their pessimism yet? Michigan’s current-conditions index fell 12% and most respondents plan to cut back where prices jumped; Thursday’s retail sales will show whether intentions have turned into spending cuts, which would change the growth side of the Fed’s calculation.
— US market commentary trusted by family offices and institutions. Apply for membership at join.recessionalert.comG. CHART OF THE WEEK -> TOP
WHY THIS CHARTOf the week’s five charts, Thursday’s is the only one that sits where the two biggest stories meet: the Treasury auction it dissects cleared on the same afternoon the Fed minutes named AI infrastructure borrowing as a rival for long-term capital, the day after SpaceX’s $40 billion debt plan surfaced. Monday’s job-loss chart and Friday’s household-expectations chart each explain one input to the Fed’s next move; this one explains why the cost of financing the AI build-out and the cost of financing the government have become the same question.
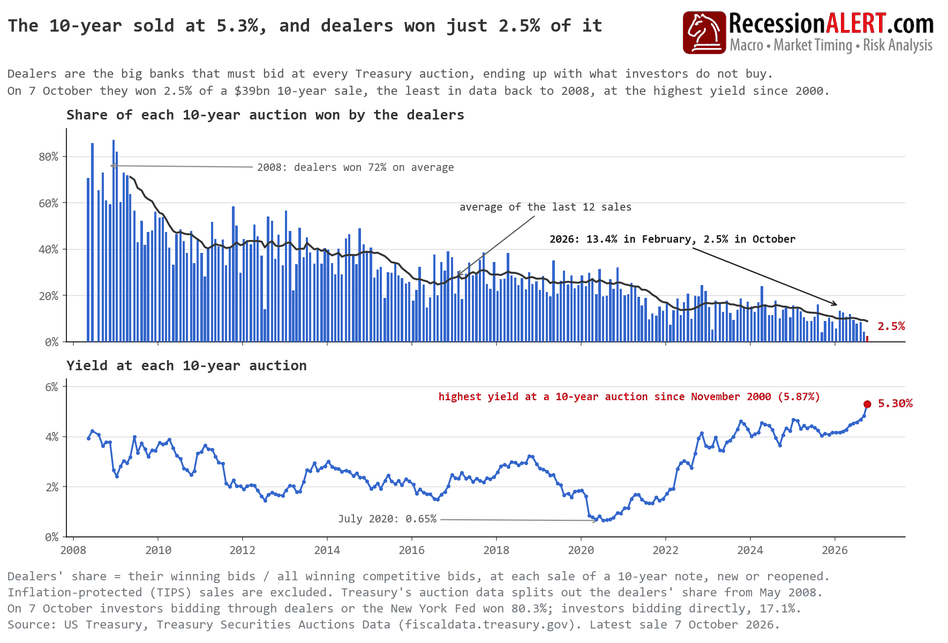
ORIGINAL CHART ANALYSIS — FROM THURSDAY’S MIBYields this high are usually read as a buyers’ strike, but Wednesday’s 10-year auction shows buyers setting the price. With the amount on offer fixed, a shortage of buyers shows up in one of two ways: the primary dealers — banks obliged to bid at every Treasury auction — keep the leftovers, or the yield rises until investors take nearly the lot. Wednesday was the second: dealers were left the smallest share of 221 such sales since 2008, and $2.77 was bid per dollar sold, matching the highest since January 2016. Treasury fills bids from the lowest yield up, and the last one accepted sets every winner’s yield — so 5.3% was the price investors themselves named. Fed minutes released an hour later suggest why: they cite market commentary naming one rival for investors’ money — heavy private borrowing for AI infrastructure, lifting term premiums, the extra yield demanded to lend for years. SpaceX’s reported $40bn borrowing talks are the latest example. That is crowding out — a higher price, not unsold bonds — and it is no one-off: the three smallest 10-year dealer shares since 2008 all came in the last 13 months. Thursday’s 30-year is the edge to watch: at 5.618%, its highest auction yield since 1999, it left dealers 6.79% — still the third-smallest since 2008, but nearly three times the 10-year’s, on a bond that loses almost twice as much for the same rise in yields. Treasury will not run out of buyers — only out of cheap ones. What it means: For homebuyers, cheaper mortgages will need investors to accept lower yields — buyers are not what is missing. Freddie Mac’s 30-year rate hit 7.40% today, the highest since November 2023, from about 6% in February. For stock investors, companies borrowing to fund AI pay a premium over that 5.3%, so their build-out will get dearer as yields rise. For the economy, Treasury now borrows for ten years at 5.3% against an average 3.4% on its notes, so its interest bill will keep climbing. What would change this: a 10-year sale leaving dealers over 10%, last seen in May.
MIB Weekly Digest Ver. 2.06
For professional investors only. Not investment advice.
© 2026 RecessionALERT.com

Comments are closed.