
MARKET INTELLIGENCE BRIEF (MIB)
Wednesday, July 22, 2026
Oil hit six-week highs — WTI +2.73%, Brent +3.32% — as an 11th night of US strikes on Iran, a Houthi Red Sea blockade threat, and a Caspian Pipeline attack compound at once, dragging gold to $4,140 while stocks slipped (S&P -0.14%, Nasdaq 100 -0.54%). Deutsche Bank and BofA now see 2-3 more Fed hikes after a weak 20-year auction pushed yields to 5.16%. Dell +9.32%, GE Vernova -8.69%, Palantir -6.10%. Alphabet and Tesla report after the bell.
TABLE OF CONTENTS
A. EXECUTIVE SUMMARY
B. MARKET DATA
C. HIGH-IMPACT STORIES (3)
D. MODERATE-IMPACT STORIES (5)
E. ECONOMY WATCH (5)
F. EARNINGS WATCH (10)
G. WHAT’S NEXT
H. CHART OF THE DAY
A. EXECUTIVE SUMMARY -> TOP
US equities closed narrowly lower — S&P 500 -0.14%, Dow flat, Nasdaq 100 -0.54% — as an escalating Middle East energy shock met a hardening Fed outlook. WTI (+2.73%) and Brent (+3.32%) hit six-week highs on three compounding supply threats — an eleventh night of US strikes on Iran, a Houthi blockade threat against Saudi Red Sea exports, and a drone strike halting Caspian Pipeline loadings — while gold’s rise to a two-week high confirms the stagflationary read, reinforced by Deutsche Bank and BofA now projecting two-to-three additional Fed hikes and a weak 20-year Treasury auction pushing long yields to 5.16%. Communication Services (-1.40%) led sector losses as roughly $489 billion in 2026 AI-debt issuance sharpens scrutiny ahead of tonight’s Alphabet and Tesla results. The pullback stayed narrow and growth-concentrated — Energy and Utilities led gains, the NYSE Composite advanced, and Dow Theory’s bull confirmation held into a second session.
• WTI +2.73% to $86.64, Brent +3.32% to $94.03 — six-week highs as US strikes on Iran hit an 11th night, a Houthi blockade threat, and a Caspian Pipeline attack compound simultaneously.
• S&P 500 -0.14%, Dow flat, Nasdaq 100 -0.54%, Russell 2000 -0.97% — pullback concentrated in growth/small-caps; NYSE Composite advanced +0.12%.
• Gold +1.56% to $4,140.10/oz, highest since July 7; VIX fell 2.05% to 16.70 even as 10Y (+2.9bps) and 2Y (+4.1bps) yields rose.
• Deutsche Bank and BofA now project two-to-three additional Fed hikes before year-end; a weak 20-year Treasury auction (bid-to-cover 2.46) pushed long yields to 5.16%.
• Dell +9.32% on Super Micro’s AI-server strength; GE Vernova -8.69% on a Q2 EPS miss; Palantir -6.10% on a free open-source rival launch; Prologis tabled an $18.8B “best and final” bid for Segro.
• Alphabet and Tesla report after tonight’s close — the first Mag 7 test against $489B in 2026 AI-debt issuance scrutiny; Intel reports Thursday amid weak PC-demand concerns.
1. A stagflationary energy shock meets a hawkish Fed — Oil rising while equities slipped and gold rallied is the market pricing a supply-driven inflation risk rather than a growth scare, arriving in the same week Deutsche Bank and BofA flip to projecting more hikes and a soft 20-year auction pushes yields higher — a combination that pressures equity multiples from both the inflation and discount-rate side at once.
2. AI capex faces its first debt-scrutiny earnings test — With 2026 AI-related debt issuance already exceeding all of 2025, tonight’s Alphabet and Tesla results (and Intel’s Thursday print) will be read as the market’s first real gut-check on whether hyperscaler capex guidance can justify the leverage being taken on to fund it.
3. Narrow rotation, not a market-wide selloff — Energy and Utilities outperformance against Communication Services’ laggard status, a positive NYSE Composite, and an intact Dow Theory bull confirmation show breadth held beneath a single-sector-driven index dip — a distinction that matters for how forcefully today’s headline losses should be read.
 — Leading economic indicators. Accurate market forecasts. Apply for membership at join.recessionalert.com
B. MARKET DATA -> TOP
An eleventh consecutive night of U.S. strikes on Iran, Houthi shipping threats, and an attack on a Caspian Pipeline terminal drove crude sharply higher — WTI +2.73%, Brent +3.32% — while gold gained 1.56% to its highest since July 7 on safe-haven demand. Equities were narrowly lower: the S&P 500 fell 0.14% and the Dow was flat, but the Nasdaq 100 dropped 0.54% as Communication Services (-1.40%) lagged, with Meta down 2.58% ahead of Alphabet and Tesla earnings due after the close. Energy (+1.36%) and Utilities (+2.15%) led sector gains on the oil and safe-haven bid. Dell surged 9.32% on AI-server demand; GE Vernova sank 8.69% on a Q2 earnings miss.
CLOSING PRICES – Wednesday, July 22, 2026:
MAJOR INDICES
Dow Theory bull confirmation extends into a second session — both DJIA and DJTA sit within 1% of their 10-session highs, Tuesday’s confirmation carrying through today’s modest pullback. The Nasdaq 100’s 0.54% decline versus the Dow’s flat close reflects a narrow, growth-led drag rather than a broad market event; the NYSE Composite’s advance to 23,919.71 confirms broader breadth held up even as mega-cap tech lagged into tonight’s Alphabet and Tesla reports. Large-cap/small-cap and growth/broad relative performance stayed within normal ranges over the past 10 sessions.
| Index | Close | Change | %Move | Why It Moved |
|---|---|---|---|---|
| S&P 500 | 7,499.04 | -10.16 | -0.14% | Narrow pullback as growth/tech lagged into earnings |
| Dow Jones | 52,219.35 | -5.29 | -0.01% | Essentially flat; blue-chips absorbed the oil shock |
| DJ Transportation | 22,601.7 | -65.7 | -0.29% | Pulled back with industrials; still confirms Dow Theory bull signal |
| Nasdaq 100 | 28,998.10 | -157.08 | -0.54% | Meta and Communication Services weighed ahead of earnings |
| Russell 2000 | 2,958.50 | -28.90 | -0.97% | Small-caps underperformed on rate-sensitive pressure |
| NYSE Composite | 23,919.71 | +29.52 | +0.12% | Broad tape modestly higher despite mega-cap tech drag |
VOLATILITY & TREASURIES
VIX fell 2.05% even as both the 10Y (+3bps) and 2Y (+4bps) yields rose — a mild inflation-risk read tied to the oil spike rather than a growth scare, since equity volatility eased rather than climbed. The 2Y outpaced the 10Y, a modest curve-flattening tilt consistent with sticky near-term inflation expectations from the crude shock. DXY slipped fractionally, showing no safe-haven dollar bid despite the geopolitical escalation.
| Instrument | Level | Change | Why It Moved |
|---|---|---|---|
| VIX | 16.70 | -0.35 (-2.05%) | Options market shrugged off geopolitical escalation |
| 10-Year Treasury Yield | 4.657% | +2.9 bps | Modest inflation-risk repricing on the oil spike |
| 2-Year Treasury Yield | 4.302% | +4.1 bps | Front end led higher, flattening the curve slightly |
| US Dollar Index (DXY) | 101.13 | -0.06 (-0.06%) | Essentially flat; no safe-haven dollar bid |
COMMODITIES
Gold and silver moved together — up 1.56% and 1.64% respectively — on safe-haven demand tied to Middle East escalation, while copper fell 0.92%, decoupling from the precious-metals bid with no parallel read-through to industrial/growth expectations. Platinum’s 0.78% gain tracked the precious-metals complex. Bitcoin’s 0.78% decline against a risk-off geopolitical backdrop shows it trading as a risk asset today, not a safe-haven hedge.
| Asset | Price | Change | %Move | Why It Moved |
|---|---|---|---|---|
| Gold | $4,140.10/oz | $+63.70 | +1.56% | Safe-haven demand; highest since July 7 |
| Silver | $60.080/oz | $+0.972 | +1.64% | Tracked gold’s safe-haven bid |
| Copper | $6.4920/lb | $-0.0605 | -0.92% | Decoupled from precious metals; no industrial-demand signal |
| Platinum | $1,650.65/oz | $+12.75 | +0.78% | Tracked the precious-metals complex |
| Bitcoin | $65,926.0 | $-519.0 | -0.78% | Traded as a risk asset, not a safe-haven hedge |
ENERGY
WTI (+2.73%) and Brent (+3.32%) moved in tandem on a global supply-disruption narrative — an eleventh night of U.S.-Iran strikes, Houthi Red Sea threats, and a Caspian Pipeline terminal attack — not a regional spread story. Natural gas participated only modestly (Henry Hub +2.76%), while Dutch TTF’s 4.72% gain shows Europe’s gas market reacting more sharply to the same risk. Oil rising as equities slipped is a supply-shock, stagflationary-leaning signal, not a demand/growth story.
| Asset | Price | Change | %Move | Why It Moved |
|---|---|---|---|---|
| Crude Oil (WTI) | $86.64/bbl | $+2.30 | +2.73% | 11th night of U.S. strikes on Iran; Strait of Hormuz risk |
| Crude Oil (Brent) | $94.03/bbl | $+3.02 | +3.32% | Houthi shipping threats plus Caspian Pipeline terminal attack |
| Natural Gas (Henry Hub) | $2.944/MMBtu | $+0.079 | +2.76% | Modest participation in the broader energy complex rally |
| Natural Gas (Dutch TTF) | $20.87/MMBtu | $+0.94 | +4.72% | Europe’s gas market reacting sharply to Middle East supply risk |
S&P 500 SECTORS
Energy and Utilities topped the day (+1.36%, +2.15%) while Communication Services led declines both today (-1.40%) and over the week (-6.38%), a consistent laggard as Meta slides into tonight’s Alphabet earnings. Technology’s -0.37% daily dip sits against a starkly positive 3-month (+12.39%) and 12-month (+29.88%) trend — a pause, not a reversal. Basic Materials swung from a 3-month laggard (-6.67%) to today’s second-best performer (+1.93%).
| Sector | 1-Day | 1-Week | 1-Month | 3-Month | 6-Month | YTD | 12-Month |
|---|---|---|---|---|---|---|---|
| Utilities | +2.15% | +1.37% | +2.29% | -0.06% | +6.05% | +7.54% | +12.29% |
| Basic Materials | +1.93% | +0.98% | -3.95% | -6.67% | -2.96% | +8.95% | +29.60% |
| Energy | +1.36% | +4.71% | +8.60% | +3.58% | +24.83% | +31.78% | +39.27% |
| Consumer Defensive | +0.38% | +0.79% | +1.26% | +0.28% | +1.59% | +7.01% | +5.32% |
| Financial | +0.02% | -1.00% | +3.68% | +8.17% | +6.98% | +5.85% | +14.05% |
| Technology | -0.37% | -0.84% | -4.15% | +12.39% | +21.89% | +19.65% | +29.88% |
| Real Estate | -0.58% | +0.93% | +2.99% | +3.82% | +8.26% | +11.53% | +8.81% |
| Industrials | -0.60% | -2.24% | -6.02% | -1.49% | +4.31% | +11.57% | +16.26% |
| Consumer Cyclical | -0.75% | -2.53% | +0.96% | -3.78% | -5.02% | -5.20% | +0.73% |
| Healthcare | -0.76% | +0.02% | +5.47% | +7.56% | +2.52% | +3.61% | +22.32% |
| Communication Services | -1.40% | -6.38% | -0.04% | -1.47% | +2.02% | +1.03% | +26.29% |
TOP MEGA-CAP MOVERS:
GAINERS
| Company | Ticker | Close | Change | Why It Moved |
|---|---|---|---|---|
| Dell Technologies Inc | DELL | $441.80 | +9.32% | AI-server demand surge; analysts raise price targets |
| Philip Morris International Inc | PM | $194.30 | +3.33% | Q2 EPS $2.20 beat $2.05 est.; revenue beat on Zyn strength |
| Broadcom Inc | AVGO | $396.81 | +2.67% | Continued AI/semiconductor infrastructure demand |
| NVIDIA Corp | NVDA | $212.06 | +2.30% | AI chip demand continues to lift semiconductor names |
| Johnson & Johnson | JNJ | $255.63 | +2.00% | Outperformed a broader Healthcare sector decline |
DECLINERS
| Company | Ticker | Close | Change | Why It Moved |
|---|---|---|---|---|
| GE Vernova Inc | GEV | $985.03 | -8.69% | Q2 EPS $2.47 missed ~$3.20 est. despite 22% revenue growth |
| Space Exploration Technologies Corp | SPCX | $115.26 | -6.70% | Post-IPO pullback deepens, now well below its $135 IPO price |
| Palantir Technologies Inc | PLTR | $124.57 | -6.10% | Free open-source “World Monitor” competitor launched; valuation concerns |
| Intel Corp | INTC | $102.62 | -2.68% | Weak PC demand/margin concerns ahead of Thursday’s Q2 report |
| Meta Platforms Inc | META | $627.17 | -2.58% | Pressured with growth/Communication Services ahead of Alphabet’s earnings tonight |
— Institutional-grade intelligence for serious investors. Apply for membership at join.recessionalert.comC. HIGH-IMPACT STORIES -> TOP
BEARISH
1. Crude Jumps to Six-Week High as 11th Straight Night of US Strikes on Iran Compounds Caspian Pipeline Attack
The core facts:WTI settled +2.73% at $86.64/bbl and Brent +3.32% at $94.03/bbl Wednesday, the highest closes in roughly six weeks, as an eleventh consecutive night of US strikes on Iranian military targets combined with a drone attack that forced the Caspian Pipeline Consortium to halt loadings at its Black Sea terminal (two tankers struck July 19, ~1.58M bbl/day of Kazakh crude affected) and Monday’s Houthi declaration of a naval blockade against Saudi Arabia’s Red Sea exports. President Trump separately vowed Wednesday to target Iranian bridges and power plants if Iranian forces strike vessels transiting Hormuz. The rally shrugged off a bearish EIA print (crude stocks +2.0M bbl against a forecast draw).
Why it matters:Three distinct supply-risk vectors — Hormuz/Iran, the Red Sea blockade threat, and now a second Black Sea export route — are compounding simultaneously rather than resolving, and crude rising while equities slipped and gold gained is a stagflationary-leaning signal rather than a demand story. Energy (+1.36%) and Utilities (+2.15%) led sector gains while Treasury yields ticked up (10Y +2.9bps to 4.657%) on inflation-risk repricing, keeping the energy shock in the mix as a live input to next week’s July 28-29 FOMC decision even without a fresh Fed trigger today.
What to watch:Whether tanker operators or insurers publicly suspend Hormuz or Caspian transits, and next week’s EIA/API data for confirmation of an actual physical supply disruption rather than a pure risk-premium move.
UNCERTAIN
2. AI Capex Debt Scrutiny Weighs on Communication Services Ahead of Alphabet, Tesla Earnings
The core facts:Goldman Sachs research (strategist Amanda Lynam) flagged roughly $489 billion of AI-related debt issued so far in 2026 — already well above 2025’s full-year $322 billion — with about 40% issued directly by hyperscalers, intensifying investor scrutiny of AI infrastructure financing ahead of Alphabet and Tesla’s results after today’s close. Communication Services fell 1.40% today (-6.38% for the week), the Nasdaq 100 dropped 0.54%, and Meta declined 2.58% as the sector’s dominant laggard heading into the print.
Why it matters:A near-$500 billion debt load concentrated in a handful of hyperscalers raises the stakes on tonight’s capex disclosures — investors are no longer taking AI infrastructure spending at face value and are demanding evidence of return, meaning any capex guidance perceived as open-ended rather than disciplined risks a sharper reaction than in prior quarters. The Nasdaq 100’s underperformance against a flat Dow shows the pressure is concentrated in growth/tech rather than broad-based.
What to watch:Alphabet and Tesla’s after-hours reaction tonight (see Section F) as the first Mag 7 test of the cycle for how markets price AI capex against the debt buildup.
BULLISH
3. Prologis Tables $18.8 Billion “Best and Final” Bid for UK Logistics Giant Segro
The core facts:Prologis (PLD) submitted a final all-stock-plus-cash offer Wednesday for UK warehouse landlord Segro — 0.0920 new Prologis shares per Segro share plus a partial cash alternative of up to £3.5 billion, valuing Segro at roughly £14.0 billion (~$18.8 billion), a 9.5% increase over its initial proposal. Segro’s board has agreed to recommend the deal to shareholders; Prologis says the offer is final absent a competing bid.
Why it matters:An $18.8 billion cross-border logistics-real-estate combination is among the largest industrial REIT deals in years and signals continued consolidation appetite in warehouse/logistics real estate even as e-commerce-driven demand growth has moderated — a read-through for US industrial REIT valuations and cap-rate assumptions more broadly.
What to watch:Segro shareholder vote timing and whether a competing bidder emerges before the offer is finalized.
— Quantifying recession risk so you don’t have to guess. Apply for membership at join.recessionalert.comD. MODERATE-IMPACT STORIES -> TOP
BULLISH
4. Dell Surges 9.32% as Super Micro’s AI-Server Update Reinforces Enterprise Demand
The core facts:Dell Technologies (DELL, $286B market cap) rose 9.32% to $441.80 after rival Super Micro Computer reported record AI-server orders and sharply raised its gross-margin outlook, reinforcing confidence that enterprise AI-infrastructure demand remains robust. Evercore ISI lifted its DELL price target to $500 (Outperform) and JPMorgan raised its target to $550 (Overweight), both citing sustained AI-optimized server momentum following Dell’s prior-quarter disclosure of a $51.3 billion AI backlog.
Why it matters:A peer’s results serving as the catalyst for Dell’s own re-rating shows the AI-server demand story is broadening across the hardware supply chain rather than being confined to any single vendor, a supportive signal for the enterprise AI-capex thesis even as the Nasdaq 100 was negative on the day.
What to watch:Dell’s own next earnings report for confirmation that backlog conversion is keeping pace with peer-reported order strength.
BEARISH
5. Palantir Falls 6.10% as Free Open-Source “World Monitor” Rival Launches on GitHub
The core facts:Palantir (PLTR) fell 6.10% to $124.53 after developer Elie Habib released “World Monitor,” a free, open-source intelligence platform built in a single weekend, on GitHub. The tool aggregates 500+ live feeds into 56 stackable layers on an interactive globe and runs local AI threat classification via Ollama with no API keys or cloud access required — functionally similar to the government “war room” dashboards Palantir charges substantial sums for.
Why it matters:A credible free alternative built by a single developer, however early-stage, sharpens the valuation debate around Palantir’s premium multiple by raising questions about the defensibility of proprietary intelligence-platform pricing against openly auditable, on-device alternatives.
What to watch:Whether World Monitor gains adoption traction or government interest beyond its initial GitHub release.
BEARISH
6. Intel Slides 2.68% on Weak PC Demand, Margin Concerns Ahead of Thursday’s Q2 Report
The core facts:Intel (INTC) fell 2.68% to $102.62 amid renewed concern over softening PC demand, foundry-yield issues and rising manufacturing costs heading into Thursday’s Q2 report (consensus: revenue $14.42B, EPS $0.21). The company has flagged weaker second-half PC demand due to rising component costs and macro uncertainty; the stock’s forward P/E near 87x following a 310%+ trailing-year rally leaves little room for a disappointing print.
Why it matters:Intel’s rich valuation was built on an AI/foundry turnaround narrative; today’s pullback shows the market pricing in binary risk around gross-margin guidance (39% target) and Data Center segment performance ahead of tomorrow’s number.
What to watch:Thursday’s Q2 report (see Week Ahead Preview) for gross-margin trajectory and PC-segment guidance.
BEARISH
7. SpaceX Post-IPO Slide Deepens to 6.70%, Now 36% Below Post-Listing Peak
The core facts:SpaceX (SPCX) fell 6.70% to $115.26, extending a decline that has now erased nearly all gains since its June 12 IPO — the largest in US history by market value, priced at $135/share and peaking near $202 on its third trading day. Shares are now roughly 36% below that peak and below the IPO price itself, as investors reassess the ~$1.1-1.8 trillion valuation ahead of the company’s first earnings report as a public entity and the approaching expiration of employee/early-investor lockup agreements.
Why it matters:A sustained post-IPO reassessment at this scale of market cap has outsized weight for any index or fund with exposure, and the pending lockup expiration raises the prospect of further supply pressure once early holders can sell.
What to watch:The lockup expiration date and SpaceX’s first public earnings report for a fundamental re-anchoring of the valuation debate.
UNCERTAIN
8. Gold Rallies 1.56% to $4,140, Highest Since July 7, on Middle East Safe-Haven Demand
The core facts:Gold gained 1.56% to $4,140.10/oz Wednesday, its highest close since July 7, with silver (+1.64%) and platinum (+0.78%) tracking the move on renewed safe-haven demand tied to the escalating Middle East conflict. Copper decoupled, falling 0.92% with no parallel industrial-demand signal, confirming the move is safe-haven rather than broad-commodity driven.
Why it matters:Unlike yesterday’s pre-FOMC-positioning gold bid, today’s rally is explicitly geopolitical-risk driven, reinforcing that safe-haven flows and the oil-shock narrative (Story 1) are two expressions of the same underlying escalation rather than independent developments.
What to watch:A break above $4,140-$4,150 technical resistance could expose $4,175-$4,200 if Middle East tensions continue to escalate.
— Separating signal from noise since 2007. Apply for membership at join.recessionalert.comE. ECONOMY WATCH -> TOP
The Fed’s policy path hardened this week as Warsh’s hawkish tilt drew fresh hike calls from Deutsche Bank and BofA, while a soft 20-year Treasury auction pushed long yields to 5.16% on investor caution. Real-economy signals stayed mixed: the Conference Board’s LEI slipped 0.2% in June even as the Board lifted its 2026 GDP forecast to 1.9%, and mortgage purchase demand jumped 6% week-over-week despite rates near 6.7%. A surprise 2.0M-barrel crude build did little to offset a Hormuz-driven price surge toward $93 Brent, keeping energy costs a live inflation risk. Net effect: a Fed with less room to cut, and a bond market already pricing it in.
Fed’s Hawkish Tilt Solidifies as Deutsche Bank, BofA Project Additional 2026 Hikes (Seeking Alpha / CNBC, July 22, 2026)
What they’re saying:Fed commentary this week increasingly favors additional tightening over cuts, with hawkish officials led by Chair Warsh dominating the policy debate. Deutsche Bank now projects two additional 25bp hikes before year-end, while BofA sees three (September, October, December) — a sharp reversal from earlier 2026 rate-cut expectations. The Fed’s own median funds-rate projection for 2026 has been revised up to 3.8% from 3.4%.
The context:The shift marks a reversal from the Fed’s prior easing bias; June FOMC data showed PCE inflation at 3.6% and core PCE at 3.3%, both well above target, giving hawks the data cover to argue for further tightening. Markets currently assign only about 25% odds to a hike at the July 28-29 meeting, suggesting the more decisive move is expected in September.
What to watch:The July 28-29 FOMC meeting; September FOMC as the likelier venue for the next hike; upcoming core PCE data.
Weak 20-Year Treasury Auction Pushes Long Yields to 5.16% as Demand Softens (Treasury Department / TipRanks, July 22, 2026)
What they’re saying:The Treasury’s $16 billion 20-year bond auction drew a high yield near 5.05%-5.16% and a bid-to-cover ratio of 2.46 — below the 2.58 average of the prior ten auctions, signaling below-average investor demand. The 20-year yield rose to 5.16% following the results.
The context:Soft demand for long-dated Treasuries alongside a hawkish Fed reinforces the “higher for longer” rate narrative — investors are demanding more yield to hold duration risk amid persistent inflation and rising hike expectations. Weak auctions of this kind tend to pressure equities and widen credit spreads as the risk-free rate resets higher.
What to watch:Thursday’s 10-Year TIPS auction; follow-through in 10-year and 30-year yields; Treasury’s next quarterly refunding announcement.
Conference Board’s Leading Index Falls 0.2% in June, Yet 2026 GDP Forecast Raised to 1.9% (The Conference Board, July 20, 2026)
What they’re saying:The Conference Board’s Leading Economic Index declined 0.2% in June to 99.1, reversing gains from the prior two months and roughly matching the -0.1% consensus estimate. Weak consumer expectations and a drop in building permits offset the largest positive contribution, from the yield spread. Despite the monthly dip, the Board raised its full-year 2026 GDP growth forecast to 1.9% from 1.8%, citing AI-related business investment.
The context:The LEI is down just 0.3% over the first half of 2026, a far milder pace than the 1.1% contraction seen in the second half of 2025 — signaling stabilization rather than acceleration toward recession. The divergence between a softening leading indicator and an upgraded growth forecast underscores a bifurcated economy, with AI capex offsetting consumer-side weakness.
What to watch:The next LEI release (mid-August, covering July); consumer expectations components for signs of further deterioration.
Surprise Crude Build Fails to Cool Oil Rally as Hormuz Tensions Push Brent Toward $93 (EIA / OilPrice.com, July 22, 2026)
What they’re saying:EIA data showed U.S. commercial crude stockpiles rose 2.0 million barrels for the week ended July 18, versus a consensus forecast for a 1.25-1.5 million-barrel draw — a rare summer build that leaves inventories 6% below the five-year average. Despite the bearish supply signal, Brent crude traded up more than 2.5% to $93.34 on the day, driven by renewed uncertainty over Iran-US talks and the security of shipping through the Strait of Hormuz.
The context:The build would ordinarily argue for lower prices, but geopolitical risk premium is overriding fundamentals — a dynamic the Fed is watching closely, since a sustained oil-price shock complicates the inflation outlook just as hawks are gaining the upper hand on the FOMC.
What to watch:Developments in Strait of Hormuz shipping talks; Brent/WTI price action heading into next week’s EIA report.
Mortgage Purchase Demand Jumps 6% as Rising Home Inventory Offsets Higher Rates (MBA / CNBC, July 22, 2026)
What they’re saying:Weekly mortgage applications rose 1.9% for the week ended July 17, with purchase applications up 6% even as the 30-year conforming rate climbed to 6.69% from 6.65%. Refinance activity fell 2% as higher rates dulled refi incentive. MBA chief economist Mike Fratantoni attributed the pickup to growing home inventory and easing price competition drawing buyers back into the market.
The context:Resilient purchase demand despite rising rates is a positive read on the consumer, suggesting elevated home inventory — rather than affordability alone — is now the dominant swing factor for housing activity. This modestly offsets the building-permits weakness flagged in the LEI report above.
What to watch:Friday’s New Home Sales report (June); next week’s existing home sales; further MBA weekly releases as rates continue to reset higher.
— Know the probability before the market prices in the risk. Apply for membership at join.recessionalert.comF. EARNINGS WATCH -> TOP
YESTERDAY AFTER THE BELL (Markets Reacted Today)
BULLISH
9. Chubb (CB): AH n/a | Underwriting Strength Drives Double-Digit Earnings Growth
The Numbers:Q2 core operating income $2.8B (+14.6% YoY); P&C combined ratio 83.8%.
The Problem/Win:Disciplined underwriting kept the combined ratio well below 100, driving double-digit core operating income growth despite an active catastrophe-risk backdrop.
The Ripple:Reinforces the P&C insurance sector’s pricing discipline heading into peer reports.
What It Means:Underwriting-driven (not investment-income-driven) earnings growth is the higher-quality outcome insurers can post.
Released:AMC, July 21, 2026.
BULLISH
10. Capital One (COF): +0.52% | Discover Integration Pays Off as Credit Quality Improves
The Numbers:Adjusted EPS $5.81 vs. $4.69 est.; net charge-off rate improved 22bps QoQ.
The Problem/Win:The Discover acquisition is delivering both the scale and credit-quality benefits management promised, with charge-offs improving rather than deteriorating post-integration.
The Ripple:Supportive read-through for consumer-credit health across card issuers.
What It Means:Large-scale bank M&A integration risk is de-risking faster than the market had priced.
Released:AMC, July 21, 2026.
TODAY BEFORE THE BELL (Markets Already Reacted)
BULLISH
11. Philip Morris International (PM): +3.33% | Zyn, IQOS Strength Drives Beat-and-Raise
The Numbers:Revenue $11.19B vs. $10.60B est. (+5.57%); adjusted EPS $2.20 vs. $2.03 est. (+6.77%); revenue +10% YoY.
The Problem/Win:Smoke-free products grew 11.7%, with IQOS net revenue +13.7% and Zyn nicotine pouches driving US strength; international smoke-free revenue rose 14.2% at a 70.1% gross margin.
The Ripple:Reinforces the smoke-free transition thesis across tobacco peers; FDA granted MRTP authorization to 20 Zyn variants.
What It Means:PMI raised reported EPS guidance to $7.19-$7.34 (from $7.18-$7.33), though it trimmed adjusted EPS guidance slightly to $8.26-$8.41 — a beat-and-largely-raise quarter.
Released:BMO, July 22, 2026.
UNCERTAIN
12. GE Vernova (GEV): -8.69% | EPS Miss Overshadows Raised Guidance and Surging AI-Power Orders
The Numbers:Adjusted EPS $2.47 vs. $3.17-$3.20 est. (-22.13% miss); revenue $11.10B vs. $10.79B est. (+2.91% beat).
The Problem/Win:Wind remained a drag (orders -40%, quarterly EBITDA loss of $275M), pulling down headline EPS, but Power and Electrification orders surged 88% YoY to $24.2B on AI data-center demand, pushing total backlog to $176B (gas turbine backlog now 116GW, targeting 125GW by year-end).
The Ripple:Confirms the AI-driven power-demand buildout is a genuine order-book tailwind for grid/turbine suppliers, distinct from and larger than the Wind-segment weakness.
What It Means:Management raised full-year 2026 revenue guidance to $45.5-$46.5B and free cash flow to $11.5-$12.5B despite the EPS miss — the sell-off reflects a headline-driven overreaction to the miss rather than a demand-outlook deterioration.
Released:BMO, July 22, 2026.
BULLISH
13. Southern Copper (SCCO): +3.97% | High Metal Prices Drive EPS Beat
The Numbers:Revenue $4.29B vs. $4.32B est. (-0.76%, essentially in-line); EPS $2.01 vs. $1.98 est. (+1.33%); net income $1.67B.
The Problem/Win:Elevated copper prices and volumes drove the EPS beat even as revenue landed essentially in line, with the company flagging a projected 2026 global copper market deficit of ~320,000 tons.
The Ripple:Supportive for the broader industrial-metals complex given the flagged supply deficit.
What It Means:2026 production guidance is modestly lower (molybdenum, silver by-products both trimmed), meaning further upside depends more on price than volume.
Released:BMO, July 22, 2026.
BULLISH
14. AT&T (T): +3.50% | Subscriber Growth Accelerates, EPS Beats
The Numbers:EPS $0.65 vs. $0.59 est. (+10.23%); revenue $31.56B vs. $31.80B est. (-0.75%, essentially in-line); adjusted EBITDA +5.2% to $12.3B; free cash flow $4.7B (up from $4.4B YoY).
The Problem/Win:Added 646,000 Advanced Connectivity internet subscribers (367,000 fiber, 279,000 fixed wireless) plus 432,000 postpaid phone net adds at 0.86% churn — broad-based subscriber momentum across fiber, fixed wireless, and postpaid phone.
The Ripple:Strong fiber/fixed-wireless net adds signal continued share gains against cable broadband competitors.
What It Means:AT&T reiterated full-year adjusted EPS guidance of $2.25-$2.35 and free cash flow of at least $18B — an EPS beat with reiterated (not raised) guidance, but subscriber momentum is the more important underlying signal.
Released:BMO, July 22, 2026.
TODAY AFTER THE BELL (Markets React Tomorrow)
BULLISH
15. Alphabet (GOOGL/GOOG): AH: n/a | Cloud Growth Accelerates to 82%, Capex Comes in Roughly In-Line
The Numbers:Revenue $119.8B vs. $116.9B est.; Google Cloud $24.77B vs. $24.56B est. (+82% YoY); advertising revenue $81.63B vs. $81.12B est.; capex $44.9B (+100% YoY) against a roughly $44.8B street estimate. Reported EPS of $9.11 includes an estimated ~$80B in unrealized equity-stake gains, so it is not comparable to the $2.89 consensus on a like-for-like basis.
The Problem/Win:Cloud’s acceleration to 82% YoY growth (from 63% the prior quarter) is the standout result, and capex landing essentially in line with the pre-announced $180-190B full-year 2026 guidance defused the market’s chief fear — that AI infrastructure spending was accelerating beyond what was already priced in.
The Ripple:A clean cloud beat with contained capex is a positive read-through for the broader hyperscaler-capex debate (Story 2) heading into peer reports.
What It Means:Management flagged a further “significant increase” in 2027 capex — the debt-financing debate (Story 2) is deferred, not resolved.
Released:AMC, July 22, 2026.
UNCERTAIN
16. Tesla (TSLA): AH: pending | Record 480K Deliveries Set the Bar; Results Due Later Tonight
The Numbers:Consensus: EPS $0.53 (range $0.50-$0.55), revenue ~$26.4B. Q2 deliveries already reported at a record 480,126 units, +25% YoY and more than 74,000 above consensus. Actual Q2 financial results had not yet been released as of this report’s compilation; refer to tomorrow’s Yesterday After the Bell for confirmed figures.
The Problem/Win:The delivery beat already sets a high bar; the open question is whether margins and profitability kept pace, with prediction markets pricing a 74% probability of an EPS beat heading into the print.
The Ripple:Tesla shares enter the print down roughly 16% year-to-date, well behind the Nasdaq’s +11% YTD gain, raising the stakes on tonight’s guidance commentary.
What It Means:Alongside Alphabet, this is the first Mag 7 test of how markets price AI/robotics capex against near-term auto profitability.
Released:AMC, July 22, 2026 (results pending at compilation).
BULLISH
17. Texas Instruments (TXN): AH: n/a | Broad-Based Beat on Industrial, Data Center, Automotive Demand
The Numbers:Revenue $5.46B vs. $5.24B est. (+13% sequentially, +23% YoY); EPS $2.14 vs. $1.95 est., including a 5-cent benefit not in original guidance.
The Problem/Win:Growth was broad-based across industrial, data center and automotive end markets rather than concentrated in one segment; trailing-12-month free cash flow reached $6.5B on $8.7B operating cash flow.
The Ripple:A broad-based analog-chip beat is a positive read for industrial and automotive semiconductor demand more generally, not just AI-linked names.
What It Means:Confirms the semiconductor recovery extends beyond AI-specific demand into legacy industrial/auto end markets.
Released:AMC, July 22, 2026.
UNCERTAIN
18. IBM: AH: n/a | Full Report Confirms July 14 Preliminary Warning; Software/Red Hat Offset Infrastructure Weakness
The Numbers:Revenue $17.2B, about $660M below consensus (+1% YoY); GAAP diluted EPS $2.27 (-2% YoY); adjusted EPS $2.93 (+5% YoY, essentially in line with the ~$2.95 estimate). Segment: Software +5%, Consulting flat, Infrastructure -7% (though Distributed Infrastructure +37%, Red Hat +11%).
The Problem/Win:IBM shares already fell more than 25% on July 14 when the company preannounced weak preliminary Q2 results — today’s full report largely confirms rather than surprises, with Red Hat and Distributed Infrastructure providing an offsetting bright spot against broader Infrastructure segment weakness. The company disclosed $12.5B in generative-AI bookings.
The Ripple:Software/Red Hat resilience against Infrastructure softness mirrors the broader legacy-hardware-versus-AI-services divide playing out across enterprise IT.
What It Means:Because the bad news was already priced in on July 14, today’s after-hours reaction is likely to hinge on forward AI-bookings commentary rather than the already-known Q2 shortfall.
Released:AMC, July 22, 2026.
WEEK AHEAD PREVIEW:
Q2 2026 earnings season accelerates into its busiest stretch, with 10% of the S&P 500 reported and an 88% EPS beat rate so far.
Intel (INTC) — AMC, Thu Jul 23 — Reports Q2 (consensus revenue $14.42B, EPS $0.21) directly on the heels of today’s 2.68% pre-earnings slide (Story 6) on weak PC demand and margin concerns; gross-margin trajectory (39% target) and Data Center performance are the key swing factors.
RTX (RTX) — BMO, Thu Jul 23 — Defense/aerospace demand and supply-chain execution remain the key focus as the sector benefits from elevated global defense spending.
T-Mobile US (TMUS) — BMO, Thu Jul 23 — Postpaid phone net adds and churn will reveal competitive positioning against Verizon and AT&T; consensus $2.61 EPS on $22.95B revenue, though intense promotional spending is a bottom-line headwind.
Thermo Fisher Scientific (TMO) — BMO, Thu Jul 23 — Bioproduction and pharma/biotech demand recovery in focus, with consensus modeling ~3% organic growth and new product launches (Glacios 3 Cryo-TEM) supporting the guidance raise narrative.
Union Pacific (UNP) — BMO, Thu Jul 23 — The $85B Norfolk Southern transcontinental merger remains the dominant focus as the companies respond to the Surface Transportation Board’s information requests; fuel costs are a flagged headwind to Q2 margins.
Blackstone (BX) — BMO, Thu Jul 23 — Realization activity and performance revenues are the key swing factor (consensus ~$705.7M realized performance revenue), alongside AUM growth and the firm’s AI-data-center investment pipeline.
Lockheed Martin (LMT) — BMO, Thu Jul 23 — Defense order backlog and program execution in focus amid sustained elevated defense budgets.
Newmont (NEM) — AMC, Thu Jul 23 — Realized gold prices (~$4,774/oz est., a 2.5% sequential decline from Q1 highs) and production (est. 1.23M oz, -10.9% YoY on planned mine sequencing) are the key swing factors against today’s gold rally (Story 8) backdrop.
Verizon (VZ) — BMO, Fri Jul 24 — Rounds out the telecom trio alongside AT&T (Story 14) and T-Mobile, with subscriber trends the key cross-carrier comparison point.
Earnings season continues at a rapid pace through early August as the bulk of S&P 500 constituents report.
— US market commentary trusted by family offices and institutions. Apply for membership at join.recessionalert.comG. WHAT’S NEXT -> TOP
UPCOMING RELEASES:
| Date | Event | Why It Matters |
|---|---|---|
| Thu, Jul 23 | Initial Jobless Claims (expected 212K, prior 208K) | A read on labor-market resilience just as hawkish Fed commentary intensifies — a soft print would cut against the case for further hikes. |
| Thu, Jul 23 | Chicago Fed National Activity Index (prior -0.10, for Jun) | Broad-based growth gauge that helps confirm or challenge the Conference Board’s upgraded 2026 GDP forecast. |
| Fri, Jul 24 | Building Permits Final (expected 1.367M, for Jun) | Permits weakness was a key drag on this week’s Leading Economic Index; the final print will confirm whether that softness persists. |
| Fri, Jul 24 | New Home Sales (expected 0.61M, for Jun) | Tests whether the rising-inventory tailwind seen in this week’s mortgage-purchase data extends to new construction. |
| Fri, Jul 24 | Kansas Fed Manufacturing Index (prior 19, for Jul) | Regional manufacturing gauge offering an early read on whether the oil-shock cost pressure is bleeding into factory activity. |
KEY QUESTIONS:
1. Does the crude rally reflect a genuine physical supply disruption, or is it a risk-premium move that fades once tanker traffic through Hormuz and the Caspian is confirmed intact?
2. Will Alphabet and Tesla’s capex disclosures tonight reassure markets on AI-infrastructure debt discipline, or accelerate the scrutiny Goldman flagged around the $489 billion 2026 issuance figure?
3. With Deutsche Bank and BofA now projecting hikes rather than cuts, does next week’s July 28-29 FOMC meeting shift from a non-event to a live risk for markets?
H. CHART OF THE DAY -> TOP
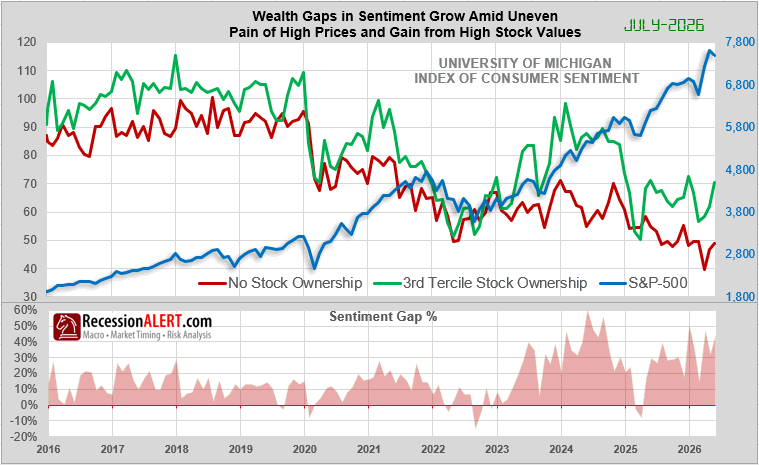
The headline fell 11.8% in a year; the cohort that owns the market never moved. Every point of that decline came from households holding no equities — which is the tell, because this spread has only ever closed one way. The two lines answer different questions. Top-tercile sentiment is a portfolio mark handed back to an interviewer; non-owner sentiment is a price-level control — no marks, no beta, just the till receipt. Difference them and ambient macro cancels — gas, tariffs, the labor market hit both — leaving something close to pure stockholder mood. So compression cannot be benign by construction. No rally reaches the red line, and disinflation cannot un-ring a price level 29% above 2020. It is why a rebound off the worst headline reading in 74 years carries non-owners only back to their mid-2022 crisis level, and why Joanne Hsu hedges July’s gain as a gasoline print that may reverse. The floor is pinned; only the ceiling moves. That makes this a capitulation gauge wearing an inequality label. Every print at -5% or worse — 2020, 2022, 2025 — landed on a major equity low; three episodes is a thin sample, but the mechanism explains why. From +43.2%, reaching that zone asks top-tercile sentiment to fall roughly a third with the bottom cohort flat. Watch the green line, not the spread. Convergence here has never been a floor rising; it is the ceiling coming down.
Market Intelligence Brief (MIB) Ver. 18.43
For professional investors only. Not investment advice.
© 2026 RecessionALERT.com

Comments are closed.