
MARKET INTELLIGENCE BRIEF (MIB)
Friday, August 21, 2026
Flash PMI shocked at 56.0, a 52-month high, putting Q3 growth near 3%: cyclicals bought it, the two-year charged for it. US-Canada talks collapsed; 50% duties hit $20B of Canadian goods at midnight. Gold cleared $4,672 and Bitcoin ran 6.69% to $77,522 with the dollar flat and yields higher. Tesla +5.14% on Nevada’s first paid robotaxi permits; Marvell -5.56% despite a 38% target raise. Fourteen Walmart cuts, eight Ross raises, same session. Oil rigs fell a third straight week.
TABLE OF CONTENTS
A. EXECUTIVE SUMMARY
B. MARKET DATA
C. HIGH-IMPACT STORIES (6)
D. MODERATE-IMPACT STORIES (8)
E. ECONOMY WATCH (6)
F. EARNINGS WATCH (0)
G. WHAT’S NEXT
H. CHART OF THE DAY
A. EXECUTIVE SUMMARY -> TOP
Equities rallied on a growth surprise rather than a liquidity one: S&P Global’s flash composite PMI printed 56.0 against 53.2 expected, its highest since April 2022, and the leadership that followed — Basic Materials +2.99%, Goldman Sachs +3.73%, the Russell 2000 +0.85% — was cyclical and broad rather than mega-cap technology, which managed just +0.33% on the Nasdaq 100. The bond market charged for it immediately, with the two-year up 4.7 bps to 4.232% against the ten-year’s 3.3 bps to 4.731%, a front-end-led move that prices a Federal Reserve with less room one week before Chair Warsh’s first Jackson Hole keynote. The VIX’s 5.50% collapse to 15.13 reflects Treasury’s buyback facility repairing long-end microstructure, not resolving the $40 trillion supply problem behind it. Eight of eleven sectors advanced; utilities fell 1.97%, the duration casualty of the same repricing.
• Flash composite PMI 56.0 vs 53.2 expected — a 52-month high, with services at 56.8 (20-month high) while manufacturing output slid to a 13-month low; the survey puts Q3 near 3% annualized against 1.5% in Q2, and Atlanta Fed GDPNow still tracks 4.0%.
• US-Canada talks collapsed — 50% Section 338 duties attach at 12:01 a.m. ET Saturday across 439 provisions covering roughly $20 billion of USMCA-qualifying Canadian goods; energy is carved out, autos and parts are the largest exposure by value.
• Gold +2.20% to $4,672 and Bitcoin +6.69% to $77,522 — with the dollar index flat at 98.84 and both Treasury yields higher, the hard-asset bid arrived without the falling-dollar, falling-real-yield mechanism it normally requires. Platinum added 2.86%, copper 1.74%.
• Tesla +5.14% to $362.86 on Nevada’s approval of the first paid US robotaxi permits (8,000 vehicles across Tesla, Waymo and Uber), while Marvell fell 5.56% — the session’s worst mega-cap — despite Jefferies raising its target 38% to $325. Oracle gained 3.10% on a $17 billion VA contract ceiling raise.
• The analyst tape sorted the consumer and marked down duration — fourteen firms cut Walmart targets and eight raised Ross Stores in the same session with zero rating changes either way, while Morgan Stanley cut all ten large-cap utilities it touched on the day the sector fell 1.97%.
• Oil rig count fell a third straight week to 452 against 456 expected — no US supply response six months into the Hormuz closure, with WTI at $86.69 and up roughly 5% on the week; sanctioned Russian and Iranian crude have both flipped to premiums over Brent.
1. Growth Reaccelerated and the Front End Sent the Bill — the two-year moving more than the ten-year on a 2.8-point PMI beat is the whole trade in one line: this was not a rate-cut rally, it was a growth-surprise rally that removed the case for cuts. Positioning built around a decelerating economy was on the wrong side of it, which is why materials, financials and small-caps led and mega-cap technology did not. The September meeting is now hostage to Wednesday’s core PCE rather than to the activity data, on a committee that already carried three dissents in favour of a hike in July.
2. The Hedge Bid Lost Its Usual Mechanism — and That Makes It More Durable, Not Less — gold, platinum, silver and Bitcoin all rallied hard on a session when the dollar was unchanged and yields rose, so neither the currency channel nor the discount-rate channel explains it. What is left is a straight preference shift: buyers accepting a higher opportunity cost to hold assets outside the sovereign balance sheet, in the same week the national debt crossed $40 trillion and the 30-year sat near 5.24%. Treat a 15-handle VIX accordingly — the buyback facility repaired long-end microstructure, it did not retire any debt, and equity volatility is now pricing a fiscal resolution that has not occurred.
3. Duration Is the Line Running Through the Equity Tape — utilities at -1.97% on the day and -8.70% over six months, ten Morgan Stanley target cuts with no downgrades, and semiconductors distributing into strength (Marvell -5.56%, Nvidia -0.97%) are the same trade seen from three angles: long-dated cash flows repricing against a higher curve while short-cycle cyclicals absorb the flow. The uncomfortable part is the timing — the rotation out of semis is happening in the week before Nvidia reports on August 26 and Marvell on August 27, which is to say ahead of the quarters that are supposed to justify the valuations being sold.
 — Leading economic indicators. Accurate market forecasts. Apply for membership at join.recessionalert.com
B. MARKET DATA -> TOP
Equities rallied broadly Friday as Treasury Secretary Bessent’s expanded long-bond buyback program continued to ease bond-market stress, sending the Dow up 0.98% while the VIX collapsed 5.50% to 15.13. Gains were broad — 8 of 11 sectors advanced, led by Basic Materials (+2.99%) and Healthcare (+1.25%) — even as Utilities (-1.97%) lagged on rate-sensitivity concerns. The standout divergence: gold surged 2.20% to $4,672/oz and Bitcoin leapt 6.69% to $77,522 even as the dollar index finished flat at 98.84 and both 10Y and 2Y yields ticked higher — a hard-asset bid arriving without the falling dollar or falling real yields such a move normally requires, and bonds not confirming the equity rally. Tesla (+5.14%) led mega-cap gainers on a Nevada robotaxi permit while Marvell (-5.56%) paced decliners on profit-taking after its recent AI-silicon run.
CLOSING PRICES – Friday, August 21, 2026:
MAJOR INDICES
Dow Theory bull confirmation re-emerges today, reversing yesterday’s neutral reading — both DJIA (1.4% off its 10-session high) and DJTA (1.6% off its own) sit within the 2% confirmation band, with the transports’ 0.88% gain broadly matching the industrials’ 0.98%. Breadth was constructive across caps: Russell 2000 (+0.85%) and NYSE Composite (+0.73%) advanced alongside the S&P and Dow, while the Nasdaq 100’s more modest 0.33% gain reflects mega-cap tech’s relative underperformance versus small- and mid-caps — a mild broadening rather than a narrow tech story.
| Index | Close | Change | %Move | Why It Moved |
|---|---|---|---|---|
| S&P 500 | 7,674.37 | +33.21 | +0.43% | Broad risk-on rally on Treasury bond-buyback intervention |
| Dow Jones | 53,277.01 | +517.80 | +0.98% | Blue-chips and financials led on bond-stabilization optimism |
| DJ Transportation | 21,570.26 | +188.01 | +0.88% | Confirmed industrials’ gain, restoring Dow Theory bull signal |
| Nasdaq 100 | 29,308.86 | +95.70 | +0.33% | Lagged broader market as rally broadened beyond mega-cap tech |
| Russell 2000 | 3,017.87 | +25.44 | +0.85% | Small-caps outperformed Nasdaq, broadening the rally |
| NYSE Composite | 24,728.59 | +180.33 | +0.73% | Broad-market breadth confirmed the headline index gains |
VOLATILITY & TREASURIES
VIX’s 5.50% plunge to 15.13 signals a sharp improvement in risk appetite, yet both Treasury yields rose (10Y +3.3bps to 4.731%, 2Y +4.7bps to 4.232%) — bonds are not fully confirming the equity rally. This reads as reflation/growth-optimism rather than fear receding: falling volatility alongside rising yields reflects easing acute stress from Treasury’s buyback intervention without erasing the week’s underlying fiscal-supply concerns. DXY was roughly flat (-0.06%), suggesting the yield backup is domestic technical repricing rather than a dollar story.
| Instrument | Level | Change | Why It Moved |
|---|---|---|---|
| VIX | 15.13 | -0.88 (-5.50%) | Sharp risk-appetite improvement on bond-stabilization intervention |
| 10-Year Treasury Yield | 4.731% | +3.3 bps | Long-end supply/fiscal concerns persist despite Treasury buybacks |
| 2-Year Treasury Yield | 4.232% | +4.7 bps | Tracked the 10Y higher; Fed seen on hold in September |
| US Dollar Index (DXY) | 98.84 | -0.06 (-0.06%) | Roughly flat; no directional dollar impulse either way |
COMMODITIES
Gold (+2.20%) and Bitcoin (+6.69%) rallied together, but without the mechanism a debasement trade requires — the dollar index finished flat at 98.84 (-0.06%) and both Treasury yields rose. Strip out the currency and discount-rate channels and what remains is a preference shift: buyers accepting a higher opportunity cost to hold non-yielding assets. Silver (+1.64%) and platinum (+2.86%) confirmed the precious-metals bid, while copper’s more modest +1.74% shows industrial demand participating but not leading. Bitcoin’s outsized gain took it to its best levels since May; no catalyst dated to the session could be verified.
| Asset | Price | Change | %Move | Why It Moved |
|---|---|---|---|---|
| Gold | $4,672.06/oz | $+100.66 | +2.20% | Hard-asset bid with the dollar flat and yields higher |
| Silver | $69.222/oz | $+1.117 | +1.64% | Tracked gold’s safe-haven bid |
| Copper | $6.5818/lb | $+0.1128 | +1.74% | Industrial demand participating in the broad-metals bid |
| Platinum | $1,891.70/oz | $+52.60 | +2.86% | Confirmed the precious-metals bid alongside gold and silver |
| Bitcoin | $77,522.0 | $+4,864.0 | +6.69% | Best levels since May; no catalyst dated to the session verified |
ENERGY
WTI (-0.16%) and Brent (+0.15%) were essentially flat and diverging in direction, with no discrete catalyst — a quiet session for crude after a volatile week. Henry Hub (+0.51%) and Dutch TTF (+1.68%) also decoupled from crude, each moving on its own regional balance rather than a shared driver. Oil’s non-participation in today’s broad risk rally is itself notable — with gold, Bitcoin and equities all higher, energy sat out, consistent with a liquidity/reflation story rather than a demand-driven one.
| Asset | Price | Change | %Move | Why It Moved |
|---|---|---|---|---|
| Crude Oil (WTI) | $86.69/bbl | $-0.14 | -0.16% | Flat, no discrete catalyst; sat out the broad risk rally |
| Crude Oil (Brent) | $93.92/bbl | $+0.14 | +0.15% | Marginal move; no discrete catalyst |
| Natural Gas (Henry Hub) | $2.747/MMBtu | $+0.014 | +0.51% | Decoupled from crude; regional balance driver |
| Natural Gas (Dutch TTF) | $22.723/MMBtu | $+0.375 | +1.68% | European gas balance; decoupled from US Henry Hub and crude |
S&P 500 SECTORS
Basic Materials (+2.99% today, +43.12% 12M) and Energy (12M leader at +45.68%) show a split: Materials extended its trend today while Energy, the year’s best-performing sector, was the session’s mild laggard (-0.07%) — a pause rather than a reversal. Utilities was the clear structural laggard across every horizon (-1.97% 1D, -7.44% 1M, -8.70% 6M), confirming persistent rate-sensitivity pressure. Technology’s modest +0.17% today masks its dominant 12-month run (+33.50%), consistent with today’s broadening beyond mega-cap tech.
| Sector | 1-Day | 1-Week | 1-Month | 3-Month | 6-Month | YTD | 12-Month |
|---|---|---|---|---|---|---|---|
| Basic Materials | +2.99% | +6.60% | +14.39% | +7.92% | +1.47% | +22.90% | +43.12% |
| Healthcare | +1.25% | +4.29% | +7.20% | +15.82% | +10.18% | +12.38% | +26.78% |
| Financial | +1.06% | -1.66% | +2.41% | +9.78% | +8.61% | +7.38% | +13.83% |
| Communication Services | +0.94% | -1.23% | +4.40% | -8.33% | -0.14% | -1.73% | +12.01% |
| Consumer Cyclical | +0.80% | +0.14% | +8.27% | -1.00% | +0.22% | -2.13% | +3.19% |
| Industrials | +0.60% | -3.67% | -0.06% | +0.42% | -1.91% | +12.94% | +17.76% |
| Consumer Defensive | +0.59% | -1.41% | +1.74% | -1.78% | -4.74% | +7.31% | +2.11% |
| Technology | +0.17% | -3.19% | +3.31% | +2.72% | +24.09% | +22.35% | +33.50% |
| Real Estate | -0.05% | -0.35% | -0.17% | +2.06% | +3.53% | +10.99% | +7.82% |
| Energy | -0.07% | +2.48% | +4.71% | +4.51% | +15.29% | +38.83% | +45.68% |
| Utilities | -1.97% | -3.50% | -7.44% | -6.08% | -8.70% | -0.68% | +0.74% |
TOP MEGA-CAP MOVERS:
GAINERS
| Company | Ticker | Close | Change | Why It Moved |
|---|---|---|---|---|
| Tesla Inc | TSLA | $362.86 | +5.14% | Nevada approved a 5,000-Cybercab robotaxi permit; Austin charging hub, Einride 500-truck Semi order |
| Goldman Sachs Group Inc | GS | $1,039.28 | +3.73% | Financials outperformed on bond-stabilization optimism; reported Anthropic IPO banking mandate |
| Palantir Technologies Inc | PLTR | $179.94 | +3.44% | No discrete same-day catalyst; continuation of the post-Aug 3 earnings rally |
| Morgan Stanley | MS | $214.20 | +3.25% | Financials outperformed on bond-stabilization optimism, same driver as GS |
| Oracle Corp | ORCL | $146.47 | +3.10% | VA raised its Oracle Health contract ceiling ~$17bn to nearly $27bn |
DECLINERS
| Company | Ticker | Close | Change | Why It Moved |
|---|---|---|---|---|
| Marvell Technology Inc | MRVL | $237.05 | -5.56% | Profit-taking after the AI-silicon rally (Google warrant deal, Aug 19); no fresh catalyst |
| Intel Corp | INTC | $90.07 | -2.24% | Continuation of post-dilution overhang ($20B follow-on, Aug 18) plus semis profit-taking |
| Philip Morris International Inc | PM | $188.23 | -1.72% | No discrete same-day catalyst; defensive laggard on a risk-on day, still digesting Jul 22 guidance cut |
| RTX Corp | RTX | $209.91 | -1.12% | Profit-taking after the Navy Tomahawk contract rally (Aug 17); valuation concerns |
| NVIDIA Corp | NVDA | $214.75 | -0.97% | No discrete same-day catalyst; modest de-risking ahead of Aug 26 earnings |
— Institutional-grade intelligence for serious investors. Apply for membership at join.recessionalert.comC. HIGH-IMPACT STORIES -> TOP
BULLISH
1. Flash Composite PMI Beats Consensus by 2.8 Points and Doubles the Q3 Growth Track — the Cyclicals Bought It and the Bond Market Charged for It
The core facts:S&P Global’s August flash composite reading landed at 56.0 against a 53.2 consensus — a 2.8-point beat and the strongest print since April 2022 — with the survey’s own commentary putting Q3 growth on a track near 3% annualized against the 1.5% recorded in Q2. Section E carries the index detail and the services-versus-manufacturing internals. What matters here is the tape’s response: the Dow closed up 0.98% to 53,277.01, Basic Materials led all sectors at +2.99%, the Russell 2000 added 0.85% and the NYSE Composite 0.73%, while the Nasdaq 100 managed only 0.33%. Goldman Sachs (+3.73%) and Morgan Stanley (+3.25%) were among the session’s largest mega-cap gainers.
Why it matters:The leadership pattern is the tell. Materials, financials and small-caps outperforming mega-cap technology is not what an AI-narrative rally looks like — it is what a growth-reacceleration trade looks like, and it means positioning built around a decelerating economy was on the wrong side of this print. The cost showed up immediately in rates: the 10-year rose 3.3 bps to 4.731% and the two-year 4.7 bps to 4.232%, so the front end moved more than the long end. That is the market pricing a Federal Reserve with less room, not more. It lands on a committee that already carried three dissents in favour of a hike at the July 28-29 meeting, and it lands one week before Chair Warsh delivers his first Jackson Hole keynote. A composite at a 52-month high removes the growth-scare argument for patience and leaves the September meeting hostage to the inflation data rather than the activity data.
What to watch:Core PCE for July prints Wednesday, August 26, with the prior at 0.1% month-over-month and 3.7% year-over-year. A firm core print on top of a 56.0 composite would make Warsh’s August 28 keynote the most consequential Fed communication of the quarter.
BEARISH
2. The US-Canada Deadline Expires With No Deal — 50% Duties on $20 Billion of USMCA-Qualifying Goods Attach Overnight
The core facts:A third consecutive day of negotiations at the USTR’s Washington offices ended Friday without an agreement, and the three-day pause Trump granted on Wednesday expired with it. Section 338 duties of 50% ad valorem attach at 12:01 a.m. ET Saturday, August 22, across 439 tariff provisions covering roughly $20 billion of Canadian imports — alcohol, dairy and cheeses, motor vehicles and auto parts, plus hockey equipment, wine, electronics, industrial machinery and furniture. Energy is explicitly carved out; oil, gas and potash are exempt. Canada’s trade minister Dominic LeBlanc, chief negotiator Janice Charette and PM chief of staff Marc-Andre Blanchard met USTR Jamieson Greer through the day; with under eleven hours remaining, Ottawa said only that it was still working to resolve outstanding trade issues. No agreement, extension or formal statement appeared through any institutional channel in the closing two hours of the session.
Why it matters:The consequential detail is which goods are covered. These duties fall on merchandise that otherwise qualifies for duty-free treatment under USMCA, which makes this a different instrument from the sectoral tariffs the market has spent two years absorbing. A trade agreement that can be overridden at 50% on 439 lines with three days’ notice is not functioning as a tariff schedule; it is functioning as a negotiating position. Every North American supply chain built on the assumption that USMCA-originating content is duty-free now carries a contingent liability that no contract prices. Autos and auto parts are the largest exposure by value, and the carve-out for energy tells you the administration knows precisely where the inflation-sensitive imports sit. Reporting has circulated on tentative terms — autos cut to 15%, steel and aluminium halved to 25% — but those rest entirely on unnamed sources and no proclamation or USTR document implements any of it. Treat nothing as agreed.
What to watch:Whether CBP issues implementation guidance over the weekend, and whether Proclamation 11056 — filed for public inspection at 11:15 a.m. ET Friday and scheduled to publish Monday, August 24 — is superseded before it appears. A last-minute reversal through Truth Social remains the live channel, as it was on Wednesday.
BULLISH
3. Bitcoin Adds 6.69% to $77,522 and Closes Its Best Week Since 2023 — With No Dated Catalyst That Survives Verification
The core facts:Bitcoin closed Friday at $77,522, up $4,864 or 6.69% on the session, having started the week near $62,800 — a weekly gain above 20% and the first sustained move above $75,000 since May. The daily move clears the 5% threshold at which crypto qualifies for coverage here on price action alone. The candidate explanations in circulation — Treasury’s expanded buyback program, ETF inflows, short liquidations, regulatory optimism following the White House meeting with crypto executives on August 19 — are all aggregator-sourced, and none could be tied to a dated, name-specific event originating on Friday. The move is reported here; the reason for it is not, because no reason held up.
Why it matters:A 20% weekly advance with no identifiable catalyst is itself the information. It says the marginal buyer is not responding to news but to a position — most plausibly a flow that has to be put somewhere, arriving in the same week gold rose 2.20% to $4,672 and the national debt crossed $40 trillion. The pairing matters more than either leg: Bitcoin and gold moving together on a day the dollar index was flat at 98.84 and Treasury yields rose is not a conventional debasement trade, because the conventional version requires a falling dollar and falling real yields. What it looks like instead is a bid for assets outside the sovereign balance sheet, funded by whoever no longer wants to hold the long end at 5.24%. For an equity book that is a hedging signal, not a risk signal — and it is worth noting that a bid this indiscriminate is also the kind that reverses without a catalyst.
What to watch:The Senate cloture vote on the motion to proceed on the Clarity Act is scheduled for September 15. That is the first dated, verifiable legislative event capable of validating or refuting the regulatory-optimism explanation this week’s move has been assigned.
UNCERTAIN
4. Gold Clears $4,600 and Platinum Adds 2.86% on a Day the Dollar Was Flat and Yields Rose — the Hedge Bid Arrived Without Its Usual Mechanism
The core facts:Gold rose $100.66 to $4,672.06 an ounce, up 2.20%. Platinum gained 2.86% to $1,891.70, silver 1.64% to $69.222 and copper 1.74% to $6.5818 a pound. Basic Materials was the best-performing S&P sector at +2.99%, extending a 12-month run of +43.12%. The mechanism usually invoked for a move of this size was absent: the dollar index finished at 98.84, down 0.06% and effectively unchanged, while both the 10-year and two-year Treasury yields rose. A precious-metals bid normally requires a falling dollar, falling real yields, or both. Neither was present.
Why it matters:Strip out the currency and the discount-rate channels and what remains is a straight preference shift — buyers accepting a higher opportunity cost to hold a non-yielding asset. That is a different and more durable signal than a dollar-driven rally, because it does not unwind when the dollar bounces. The breadth reinforces it: platinum and copper participating means this is not narrowly a monetary hedge but a broad hard-asset bid, and copper’s presence brings a genuine industrial-demand limb consistent with the day’s PMI beat. The complication for a US equity book is that Basic Materials leading the tape is a perfectly good reason to be long the sector while simultaneously being a poor advertisement for the quality of the equity rally underneath it. Gold at $4,672 with a 30-year yield above 5.2% and $40 trillion of federal debt is not a growth trade; it is a balance-sheet trade wearing a growth trade’s clothes.
What to watch:Whether gold holds above $4,600 if the dollar index recovers. A metals complex that keeps its gains through a dollar rally confirms the preference-shift reading; one that gives them back was a positioning move after all.
UNCERTAIN
5. The VIX Collapses 5.50% to 15.13 and Dow Theory Reconfirms Its Bull Signal — While Both Treasury Yields Rise and Refuse to Ratify Any of It
The core facts:Volatility broke down hard: the VIX fell 0.88 points to 15.13, a 5.50% decline, as Treasury Secretary Bessent’s expanded long-bond buyback program continued to drain acute stress out of the long end. The Dow Transportation Average rose 0.88% to 21,570.26 against the industrials’ 0.98%, putting both averages within 2% of their ten-session highs and restoring the Dow Theory bull confirmation that had lapsed to neutral on Thursday. Eight of eleven sectors advanced. And yet the 10-year yield rose 3.3 bps to 4.731% and the two-year 4.7 bps to 4.232%, with the 30-year still near 5.24% — the maturity Bessent himself described this week as having “very poor” liquidity.
Why it matters:Falling volatility alongside rising yields is a specific configuration and it is not the same as fear receding. It says the intervention has succeeded at the thing it was designed to do — restoring orderly two-way trading in long-dated Treasuries — while doing nothing whatsoever about why the yields are where they are. The buyback program is a liquidity facility, not a debt-reduction facility; it changes who holds the paper, not how much paper exists. That distinction was visible on Thursday, when the initial intervention was unwound inside a single session and Bessent responded by promising a larger one. Equity investors reading a 15-handle VIX as an all-clear are reading a market-microstructure repair as a fiscal resolution. The two-year moving more than the ten-year on the same day compounds it: the front end is repricing Fed risk upward at the same moment equity volatility prices it downward. One of those is wrong.
What to watch:The first expanded buyback operation is scheduled for September 9, with the program running to November 4. Whether the 30-year holds below 5.30% into that date is the cleanest available test of whether the facility is doing more than buying time.
UNCERTAIN
6. Iran’s President Calls for the War to End “Now” and His Armed Forces Chief Threatens a “Devastating” Response — the Same Session, in Opposite Directions
The core facts:President Masoud Pezeshkian said publicly on Friday that “it is better that we bring the war to an end now as we are in a position of power and dignity,” defending the June memorandum of understanding with Washington and noting that Supreme Leader Mojtaba Khamenei had approved it despite internal opposition. Hours apart, armed forces chief of staff Ali Abdollahi warned that Iran’s military would answer any new threats with “revolutionary, crushing, regret-inducing and devastating” measures. Separately, China’s foreign ministry rejected the US secondary-sanctions threat outright — spokesperson Lin Jian saying that “military means, sanctions and pressure tactics are not the solution” — while conspicuously declining to address whether China would curb its Iranian crude purchases. Treasury has said China takes more than 80% of Iran’s shipped oil. Crude finished the session close to flat: WTI at $86.69, down 0.16%, and Brent at $93.92, up 0.15%, after a week in which Brent gained roughly 6%.
Why it matters:Do not resolve the contradiction — price it. On day 174 of the Strait of Hormuz closure, the market’s central question is no longer whether the conflict escalates but whether Tehran’s leadership can deliver any outcome it negotiates, and a presidency and a general staff saying opposite things in one session is direct evidence on that question. It explains why crude went nowhere on a day it had every reason to move: a de-escalation signal and an escalation signal cancelled, leaving a 6% weekly gain intact and a Friday that priced neither. The Chinese response is the more actionable half. Beijing’s silence on crude purchases, in a statement that addressed everything else, is the market-relevant fact — a sanctions architecture aimed at Iranian exports has no economic bite without the buyer, and the buyer has just declined to say it will stop. Energy was the session’s mild laggard at -0.07% despite being the year’s best sector at +45.68%, which reads as a market unwilling to add to war premium it cannot underwrite.
What to watch:Bessent’s press conference on Monday, August 24, at which he has promised to detail the “toughest sanctions in history” package. Whether that text designates Chinese purchasers by name is the single variable that determines if the architecture has teeth.
— Quantifying recession risk so you don’t have to guess. Apply for membership at join.recessionalert.comD. MODERATE-IMPACT STORIES -> TOP
BULLISH
7. Nevada Issues the First Paid Robotaxi Permits in the US — 8,000 Vehicles Across Tesla, Waymo and Uber, and Tesla Leads the Mega-Cap Tape
The core facts:The Nevada Transportation Authority voted unanimously on Thursday evening, after the prior session’s close, to approve three commercial autonomous-taxi permits in Clark County: Tesla up to 5,000 vehicles, Waymo up to 1,000 and Uber up to 1,000 through Motional and Zoox partnerships — 8,000 authorized over the next twelve months. Tesla closed Friday at $362.86, up 5.14% and the session’s largest mega-cap gainer. Tesla’s Cybercab chief engineer Eric Early told the meeting that “the 5,000 has always been a ceiling for us” and that the company “would be extremely happy” to reach 2,500 within the year. The Livery Operators Association and local taxi operators opposed the applications.
Why it matters:The permitted number is not the deployable number, and Tesla’s own engineer said so on the record — a detail that will be absent from most coverage of the 5,000 figure. What actually changed is the regulatory category. Nevada has issued the first paid, commercial robotaxi authorizations in the country, which converts autonomy from a permitting question into a unit-economics question for the first time. That is a harder test, not an easier one, and it now applies to all three operators simultaneously in a single jurisdiction — which makes Clark County the first genuine head-to-head read on cost per mile between Tesla’s camera-only approach and Waymo’s sensor-heavy one. For Tesla specifically, a 5.14% move on a permit rather than a deployment tells you how thinly the autonomy option is currently priced into the stock.
What to watch:The first disclosed Clark County fleet count from any of the three operators. Against Early’s stated 2,500 aspiration, anything materially below four figures inside six months reframes the permit as an option rather than a plan.
UNCERTAIN
8. Fourteen Firms Cut Walmart and Eight Raise Ross Stores in the Same Session — the Street Just Repriced Trade-Down as a Positive
The core facts:At least fourteen firms reset price targets on Walmart on Friday, and every action was a cut with every rating left intact: Truist Buy $140 to $114, a 19% reduction; BMO Capital Buy $145 to $126; Evercore ISI Buy $140 to $125; Morgan Stanley Buy $140 to $125; Deutsche Bank Hold $120 to $113; Wells Fargo Buy $140 to $120; plus Argus, UBS, Piper Sandler and Baird among others. The same session, Ross Stores drew eight actions in the opposite direction, every one a raise: Truist Buy $290 to $310, Telsey Buy $200 to $280, Evercore ISI Buy $276 to $290, J.P. Morgan Buy $262 to $272, Deutsche Bank Buy $283 to $294, with Bernstein, Morgan Stanley and Jefferies also raising. No rating changed in either cluster. Three firms — Truist, Evercore ISI and Deutsche Bank — appear on both tapes, moving in opposite directions on the same morning.
Why it matters:The pairing is the story and neither cluster means much alone. Targets cut on the mass-market incumbent and raised on the off-price operator, by the same analysts on the same day, is the Street formally marking down its view of the mid-tier consumer while marking up the beneficiary of that same weakness. Twenty-two actions and zero rating changes is the signature of a valuation reset rather than a thesis change — the analysts still like both businesses, they have simply moved where the earnings accrue. For a US large-cap book this is a rotation instruction dressed as arithmetic: it argues the consumer is not weakening in aggregate so much as sorting, and that the sorting is now far enough along to be worth a target. The read-through extends to Burlington and TJX on one side and to grocery-anchored mass retail on the other.
What to watch:Burlington and Dollar General both report before the bell on Thursday, August 27, with Dollar Tree the same morning. Three off-price and discount comps in one session is the direct test of whether this repricing is right.
BEARISH
9. Jefferies Raises Marvell’s Target 38% and Citi Raises It 22% — and the Stock Falls 5.56%, the Worst Mega-Cap Move of the Session
The core facts:Citi’s Atif Malik lifted Marvell’s target from $225 to $275 and Jefferies’ Blayne Curtis from $235 to $325 — a 38% increase and the largest single revision in the day’s analyst tape — both maintaining Buy ratings. Marvell closed at $237.05, down 5.56%, the largest decline among mega-caps. Intel fell 2.24% to $90.07 on the same session. Technology as a sector managed only +0.17% against a market where eight of eleven sectors advanced and Basic Materials gained 2.99%. Marvell’s move follows the disclosure on August 19 of a warrant granted to Google over roughly 59 million shares; no fresh negative catalyst dated to Friday could be identified.
Why it matters:Price action that rejects the most bullish research of the day is a stronger signal than either the price or the research alone. Two firms told the market Marvell is worth 16% to 37% more than it was trading, and the market sold it 5.56%. The most economical reading is that the Google warrant news of two sessions ago was fully priced within hours and holders are now taking the AI-silicon gain rather than extending it — a distribution pattern, not a rejection of the thesis. That interpretation is supported by the sector shape: Technology at +0.17% on a broad risk-on day, with the Nasdaq 100 up 0.33% against the Russell 2000’s 0.85%, describes money leaving semiconductors for cyclicals rather than leaving the market. Nvidia’s own 0.97% decline ahead of its August 26 print fits the same pattern. The risk for anyone long the complex is that this rotation is happening before the quarter that is supposed to justify the valuation.
What to watch:Marvell reports after the bell on Thursday, August 27, with consensus at $0.93 on $2.71 billion. Options have been implying a move near 14%, which against a $325 street-high target is an unusually wide gap between what research says and what the tape is willing to pay.
BEARISH
10. Morgan Stanley Cuts Targets on Ten Large-Cap Utilities in a Single Sweep — Ten for Ten, Zero Rating Changes, on the Day the Sector Fell 1.97%
The core facts:Morgan Stanley reset price targets across at least ten large-cap utilities on Friday, cutting every one and changing no rating: NextEra $116 to $114; Duke $138 to $133; Southern $92 to $89; Dominion $71 to $68; Xcel $92 to $89; Sempra $108 to $104; Exelon $55 to $53; American Electric Power $139 to $135; Atmos $196 to $190; Ameren $118 to $114. Utilities was the worst-performing S&P sector on the day at -1.97%, and is the clear structural laggard across every horizon — down 7.44% over one month, 8.70% over six months and up just 0.74% over twelve, against a 10-year Treasury yield that rose again on Friday to 4.731%. No published same-session thesis for the sector call could be located.
Why it matters:Ten cuts and no downgrades is a discount-rate adjustment, not a fundamental call — the analyst has not changed what he thinks these companies will earn, only what those earnings are worth against a higher curve. That makes the sweep a clean read on how the sell side is now marking duration risk in equities, and it arrives on precisely the session when the two-year moved more than the ten-year. Utilities are the equity market’s most bond-like exposure, and a sector at -8.70% over six months while the S&P sits near highs is not a rotation, it is a repricing that has been running for two quarters. The uncomfortable part for anyone treating utilities as a defensive allocation is that the AI-datacenter demand story — the reason many funds added the sector in the first place — has now been overwhelmed by the rate channel for long enough that the thesis needs restating rather than repeating.
What to watch:Whether utilities can hold a bid if the 10-year breaks above 4.80%. The sector has now failed to rally on three separate growth-scare episodes this year, which suggests the rate sensitivity is dominating the demand story rather than sharing with it.
UNCERTAIN
11. Trump Waives Beef Tariffs on 300,000 Metric Tons for 90 Days and Cattle Futures Gap Lower — an Announced Intent With No Executive Order Behind It
The core facts:Trump announced on Friday morning that up to 300,000 metric tons of product for ground beef — roughly 661 million pounds — may enter over the next 90 days without the out-of-quota tariff, which runs at 26.4% ad valorem under the WTO beef tariff-rate-quota framework. He said the beef carries a commitment to be sold 25% below current market prices. Live cattle and feeder cattle futures gapped lower on the open, with declines reported in the $3 to $6 per hundredweight range. The National Cattlemen’s Beef Association responded that flooding the market with government-subsidized, below-market beef is not the way to rebuild the American cattle herd. Two material qualifications: Trump did not name the supplying countries, and the White House said the executive order will be signed within the next two weeks. The waiver is not in force.
Why it matters:The futures market repriced a legal instrument that does not yet exist, on a Truth Social post with no named counterparties, which is itself the most transferable fact here. The volume is real but bounded — 300,000 metric tons is roughly 44 days of US ground beef consumption, spread across a 90-day window — so this is a margin-compression event for cattle producers rather than a structural one. The asymmetry runs the other way for buyers: quick-service restaurants, packaged-food processors and grocers carry beef as one of the few input costs that has resisted disinflation, and a 25%-below-market tranche lands directly in their cost of goods. What is genuinely new is the mechanism. An administration that has spent two years raising tariffs to protect domestic producers has now waived one to lower a consumer price, against the explicit objection of the affected industry — which tells you food-price politics currently outrank producer protection, and that the same override is available on any other input.
What to watch:Whether the executive order is actually signed inside two weeks and which countries are named in it. If cattle futures have priced a waiver that never executes, the reversal will be as abrupt as the gap.
BULLISH
12. Oracle Gains 3.10% as the VA Raises Its Health Contract Ceiling by $17 Billion to Nearly $27 Billion — a Ceiling, Not a Booking
The core facts:The Department of Veterans Affairs raised the ceiling on its Oracle Health electronic-health-record modernization contract by roughly $17 billion, to nearly $27 billion, and added three optional one-year extensions that could run the agreement through May 2031. Oracle closed Friday at $146.47, up 3.10%, against a Technology sector that gained just 0.17%. Mizuho reiterated Outperform with a $320 target on the news. The contract modification documents cite unanticipated complexities and extensive site-specific customizations that exhausted the original ceiling ahead of schedule. Oracle does not receive $17 billion; the increase gives the VA headroom to award work as the rollout proceeds.
Why it matters:The distinction between a ceiling and a booking is where most of the coverage of this will go wrong, and it cuts both ways. A ceiling raise is not revenue and should not be modelled as such. But the stated reason for the raise — that customization complexity burned through the original authorization early — is a durable-revenue signal in its own right, because it means the deployment is consuming budget faster than planned in a program that cannot be abandoned midway. Federal EHR modernization is close to the definition of a captive contract. Set against Oracle’s broader position, where remaining performance obligations have been driven overwhelmingly by a small number of AI-infrastructure commitments with substantial concentration risk, an $27 billion government ceiling running to 2031 is the least correlated backlog the company has. Outperforming its own sector by nearly three points on a broad-market day suggests that is part of what was bought.
What to watch:The pace of VA site go-lives against the modification’s stated complexity problem. A ceiling raise driven by overruns is bullish for revenue and bearish for margin, and the next quarterly disclosure is where those separate.
BEARISH
13. Russian and Iranian Crude Both Flip to Premiums Over Brent — the Sanctions Discount Has Not Narrowed, It Has Inverted
The core facts:October-delivery Russian Urals for India was offered at premiums of up to $1 a barrel over dated Brent, against discounts of $1 to $2 for September-arrival cargoes — the first premium since May, per three trading sources. Iranian Light has moved from a $3.50 discount to a $3.50 premium to ICE Brent as the reinstated US naval blockade strands supply: Iranian crude sitting outside the Persian Gulf and Gulf of Oman has fallen to roughly 83 million barrels from over 100 million before the blockade resumed in mid-July, with about 40 million in floating storage near Singapore of which only two cargoes remain unsold. The EU froze its price cap at $44.10 a barrel for twelve months to July 15, 2027 in its 21st package. Chinese teapot refiners cut Iranian intake to roughly 534,000 barrels per day in August from about 823,000 in July.
Why it matters:A price cap set at $44.10 is inoperative when the capped barrel trades at a premium to the global benchmark near $94. The discount was the entire economic mechanism of the sanctions regime — it worked by forcing the seller to accept less, not by preventing the sale — and a discount that ran wider than $10 in early July has now inverted. That is not a policy under strain; it is a policy whose instrument has stopped functioning, and it happened in roughly six weeks. The transmission to US markets runs through two channels. First, the marginal buyer of sanctioned crude is now paying up rather than bargain-hunting, which puts a floor under the whole complex and argues the war premium in Brent at $93.92 is structural rather than speculative. Second, Chinese teapots cutting Iranian intake by 289,000 barrels per day while pivoting to Urals is the first sign of genuine demand destruction — and if those refiners cut throughput in the fourth quarter as inventories thin, that is the only credible relief valve currently visible on this complex.
What to watch:Whether Chinese refinery run rates fall in October. That is the specific event that would break the current price structure, and it is the one the trade is now openly forecasting rather than merely hoping for.
UNCERTAIN
14. The US Oil Rig Count Falls a Third Straight Week to 452 and Misses — Shale Is Not Responding to $87 Crude
The core facts:Baker Hughes reported at 13:00 ET Friday that the US oil rig count fell to 452 against 456 expected and 455 the prior week, a decline of three and the third consecutive weekly drop. Total rigs fell five to 588 from 593. WTI settled at $86.69, down 0.16% on the session but up roughly 5% on the week and more than 50% year to date; Brent finished at $93.92. Energy was the S&P’s mild laggard on the day at -0.07% despite leading all sectors over twelve months at +45.68%.
Why it matters:The signal is the non-response. Six months into a Hormuz closure, with WTI near $87 and refining margins historically wide, US shale is retiring rigs rather than adding them — three straight weeks of it, and a miss against an expectation that already assumed no growth. The pre-2020 playbook says a count this low at a price this high is a coiled spring. The post-2020 playbook says operators are running capital-return mandates that do not flex to spot prices, and three consecutive declines into a war premium is fairly strong evidence for the second reading. That has two consequences worth holding. For crude, it removes the US supply response that historically capped geopolitical rallies — there is no cavalry, which is why the premium in Brent looks structural rather than speculative. For oilfield services and the equipment complex, activity is contracting while the commodity rallies, which is precisely the configuration in which services underperform producers. Refiners, sitting on the widest cracks in the chain, remain the cleanest expression, though a sub-industry index running 41% above its 150-day moving average is not a comfortable entry.
What to watch:A fourth consecutive decline next Friday would confirm this as capital discipline rather than noise, and would materially raise the bar for any 2027 US supply growth assumption.
— Separating signal from noise since 2007. Apply for membership at join.recessionalert.comE. ECONOMY WATCH -> TOP
Growth signals firmed even as debt-market stress forced a policy response. The composite PMI vaulted to a 52-month high (56.0) on a services surge, while GDPNow held Q3 tracking at a still-robust 4.0% despite a month of deceleration from 6.2%. That resilience sits uneasily against Treasury’s move to double bond buybacks after 30-year liquidity turned “very poor,” Bessent said, days after the national debt crossed $40 trillion and reopened safe-haven doubts. Mortgage rates eased to 6.65% on the back of that support, and firms’ year-ahead inflation expectations slipped to 3.7% — a soft-landing surface with a debt-sustainability current underneath.
Flash Composite PMI Hits 52-Month High as Services Surge, Manufacturing Cools (S&P Global, Aug 21, 2026)
What they’re saying:The S&P Global Flash U.S. Composite PMI rose to 56.0 in August from 54.5 in July, the highest reading since April 2022, as the services business activity index jumped to 56.8 from 54.6 — a 20-month high. Manufacturing output fell to a 13-month low, with the headline factory PMI slipping to 53.2 from 53.9.
The context:The survey points to third-quarter GDP growth approaching 3% annualized, up sharply from the 1.5% pace recorded in Q2, driven almost entirely by the service sector. Supply-chain delays lengthened to one of their widest points in four years as safety-stock building fades — early signs that tariff-related front-loading dynamics are shifting.
What to watch:ISM Manufacturing and Services PMIs in early September for confirmation of the manufacturing/services divergence; final August S&P Global PMI revisions.
Atlanta Fed’s GDPNow Holds Q3 Growth Tracking at 4.0%, Down From Month’s Peak (Federal Reserve Bank of Atlanta, Aug 18, 2026)
What they’re saying:The GDPNow model’s Q3 2026 real GDP growth estimate stood at 4.0% as of August 18, down from 4.31% on August 14 and well off the 6.2% peak recorded August 3. The pullback was driven by a lower nowcast for real gross private domestic investment growth, which fell to 13.7% from 15.2%.
The context:Even after a month of steady downward revisions, the 4.0% tracking estimate remains more than double the economy’s roughly 2% trend rate, reinforcing today’s PMI signal of accelerating Q3 activity despite intra-month volatility in the model’s inputs.
What to watch:The next GDPNow update following fresh investment or trade data; the BEA’s Q2 GDP second estimate due August 26.
Treasury Doubles Bond Buyback Capacity as Bessent Flags “Very Poor” 30-Year Liquidity (Bloomberg/CNBC, Aug 19-20, 2026)
What they’re saying:The Treasury said Wednesday it would at least double the ceiling on its liquidity-support buybacks of 10-to-30-year debt, from $2 billion to $4 billion per operation, for a program running September 9 through November 4. Bessent said Thursday the size could go even higher, declining to give a cap, and described 30-year liquidity as “very poor” with yields not reflecting fundamentals.
The context:The 30-year yield last traded at 5.24%. The intervention briefly pulled yields lower, but the move was reported as “wiped out” as yields rebounded the next session — a sign investors are not fully convinced the buybacks resolve the underlying supply-demand imbalance in long-dated debt.
What to watch:30-year auction results and buyback operation sizes once the program begins September 9; whether long-end yields hold below 5.25%.
National Debt Tops $40 Trillion, Reviving Doubts Over Treasuries’ Safe-Haven Status (Multiple sources, week of Aug 18, 2026)
What they’re saying:The U.S. national debt has crossed $40 trillion, up from $30 trillion roughly two years ago, prompting strategists to question whether Treasuries retain their traditional risk-free designation. Sovereign reserve managers have continued trimming Treasury holdings in favor of gold and other diversified assets.
The context:The milestone lands directly alongside this week’s Treasury buyback expansion and elevated 30-year yields — the debt load is the structural backdrop the Treasury is now actively managing around, not a separate storyline.
What to watch:Foreign official Treasury holdings in the next TIC report; further reserve-diversification signals from major holders.
Mortgage Rates Fall for Second Straight Week to 6.65%, Tracking Treasury’s Buyback Push (Freddie Mac, Aug 20, 2026)
What they’re saying:Freddie Mac’s Primary Mortgage Market Survey put the average 30-year fixed rate at 6.65% for the week of August 20, down from 6.67% the prior week; the 15-year averaged 5.95%, down from 5.96%.
The context:The decline came despite a volatile week for bonds and was linked directly to the Treasury’s buyback expansion aimed at stabilizing longer-dated yields — a rare case this month of policy intervention translating into consumer-facing relief.
What to watch:Whether rates hold below 6.65% once the buyback program formally begins September 9; New Home Sales and Case-Shiller HPI data due August 25.
Atlanta Fed: Firms’ Year-Ahead Inflation Expectations Ease to 3.7% (Federal Reserve Bank of Atlanta, Aug 19, 2026)
What they’re saying:The Atlanta Fed’s Business Inflation Expectations survey showed firms expect their own prices to rise 3.7% over the next year, down from 4.1% in May, even as they reported average unit costs up 2.5% and sales running below normal levels.
The context:Business-level expectations easing alongside somewhat improved profit margins is a modestly encouraging disinflation signal, though firms flagged continued uncertainty from tariffs and the recent energy-cost spike as offsetting risks.
What to watch:September’s Business Inflation Expectations release; whether easing expectations show up in the Fed’s preferred PCE inflation gauge due August 26.
— Know the probability before the market prices in the risk. Apply for membership at join.recessionalert.comF. EARNINGS WATCH -> TOP
YESTERDAY AFTER THE BELL (Markets Reacted Today)
No major earnings yesterday after the bell from companies with >$100B market cap.
TODAY BEFORE THE BELL (Markets Already Reacted)
No major earnings before the bell from companies with >$100B market cap.
TODAY AFTER THE BELL (Markets React Tomorrow)
No major earnings after the bell from companies with >$100B market cap.
WEEK AHEAD PREVIEW:
Q2 2026 earnings season is 88% complete and Friday’s calendar was empty of mega-caps entirely — the largest US reporter of the session was Ubiquiti at a $33.83B market cap. Next week reverses that abruptly, with the quarter’s single most consequential print landing Wednesday and a five-name Canadian bank cycle running Tuesday through Thursday.
Bank of Montreal (BMO) — BMO, Tuesday, August 25 — consensus $2.71 EPS on $7.01B revenue against a $123.18B market cap. KBW’s David Konrad initiated coverage Friday at Buy with a $214 target, one of only two Buys in a five-name Canadian bank launch. Key focus: credit provisions on the US commercial book and any commentary on Section 338 tariff exposure across the Canadian corporate loan portfolio, given the duties attaching Saturday.
Bank of Nova Scotia (BNS) — BMO, Tuesday, August 25 — consensus $1.50 EPS on $7.17B revenue, $107.93B market cap. Also initiated Buy at KBW Friday with a $107 target. Key focus: international segment margins and whether Canadian mortgage renewal stress is stabilizing or still building.
Intuit (INTU) — AMC, Tuesday, August 25 — consensus $3.58 EPS on $4.27B revenue, $100.39B market cap, fiscal Q4 and full-year results. Key focus: the AI-driven expert platform launched in August, TurboTax Live customer and revenue growth, and execution against the $8 billion repurchase authorization and 15% dividend increase announced alongside it. Truist recently moved to Hold on softening growth, making guidance the swing factor.
NVIDIA (NVDA) — AMC, Wednesday, August 26 — consensus $2.09 EPS on $92.06B revenue against a $5,196.22B market cap. The most consequential print of the quarter. Key focus: data-center revenue trajectory, any commentary on the custom-silicon threat now that Google has taken a warrant position in Marvell and Broadcom is reportedly arranging tens of billions in Anthropic chip financing, and whether AI-capex guidance can absorb a market that sold semiconductors on Friday while buying cyclicals. NVDA closed Friday down 0.97% at $214.75.
CrowdStrike (CRWD) — AMC, Wednesday, August 26 — consensus $0.29 EPS on $1.44B revenue, $195.45B market cap. Key focus: net new ARR and module attach rates, plus whether federal and enterprise budget cycles are holding up alongside the AI-security product ramp.
Salesforce (CRM) — AMC, Wednesday, August 26 — consensus $3.27 EPS on $11.33B revenue, $171.31B market cap. Key focus: Agentforce seat conversion and pricing realization, current remaining performance obligation growth, and margin guidance against continued AI investment.
Royal Bank of Canada (RY) — BMO, Thursday, August 27 — consensus $2.93 EPS on $13.09B revenue, $284.57B market cap and the largest of the Canadian cohort. KBW initiated at Hold with a $229 target Friday; Barclays’ Brian Morton separately raised to Buy at $218 from $189 the same day. Key focus: capital markets revenue and the same tariff read-through as its peers.
Marvell Technology (MRVL) — AMC, Thursday, August 27 — consensus $0.93 EPS on $2.71B revenue, $207.59B market cap, with options implying a move near 14%. Key focus: custom-silicon design-win commentary following the Google warrant disclosed August 19, and whether the data-center ramp justifies the $275 and $325 targets Citi and Jefferies published on Friday — a session in which the stock fell 5.56%.
Toronto-Dominion (TD) — BMO, Thursday, August 27 — consensus $1.77 EPS on $10.80B revenue, $197.92B market cap. KBW initiated at Hold, $131 target. Key focus: progress on US anti-money-laundering remediation and the associated asset cap, which remains the binding constraint on the US retail franchise.
Canadian Imperial Bank of Commerce (CM) — BMO, Thursday, August 27 — consensus $1.81 EPS on $5.79B revenue, $107.94B market cap. KBW initiated at Hold, $135 target. Key focus: domestic mortgage book performance and commercial real estate provisions.
Also next week: PDD Holdings reports before the bell Monday, August 24 at a $125.80B market cap, and is excluded from individual coverage here solely because it trades as an ADR. Friday, August 28 carries no mega-cap reporters — the calendar’s only listed name is MINISO Group at $3.36B — but does bring Fed Chair Warsh’s first Jackson Hole keynote at 10:00 a.m. ET and the next FactSet earnings scorecard update.
— US market commentary trusted by family offices and institutions. Apply for membership at join.recessionalert.comG. WHAT’S NEXT -> TOP
UPCOMING RELEASES:
| Date | Event | Why It Matters |
|---|---|---|
| Sat, Aug 22 | 50% Section 338 duties attach on Canadian imports (12:01 a.m. ET) | 439 tariff provisions covering roughly $20 billion of goods that otherwise qualify duty-free under USMCA. Energy is carved out; autos and parts are the largest exposure. A reversal via Truth Social remains the live channel, as it was on Wednesday. |
| Mon, Aug 24 | Proclamation 11056 scheduled to publish; CBP implementation guidance; Bessent press conference on the Iran sanctions package | The first full session pricing the duties, and the first chance to see whether the reported auto and steel concessions exist in any document. Separately, whether Bessent’s “toughest sanctions in history” text designates Chinese purchasers by name determines if the Iran architecture has any economic bite — China takes over 80% of Iran’s shipped crude. |
| Mon, Aug 24 | Chicago Fed National Activity Index (prior -0.02) | An 85-indicator breadth check on the growth reacceleration the flash composite just signalled. A negative print against a 56.0 PMI would argue the survey is running ahead of the hard data. |
| Tue, Aug 25 | CB Consumer Confidence (exp 91.2, prior 90.8); New Home Sales (exp 0.62M, prior 0.628M); S&P/Case-Shiller Home Price YoY (prior 1.6%) | The direct test of the trade-down thesis the Street priced on Friday when it cut Walmart fourteen times and raised Ross Stores eight. Housing arrives with the 30-year mortgage at 6.65% after two weeks of declines tied to the Treasury buyback. |
| Tue, Aug 25 | Fed’s Barkin speaks twice (8:00 a.m. and 4:00 p.m. ET) | The first FOMC voice since the PMI beat and the last scheduled one before Jackson Hole. Any shift in tone on the September meeting matters more than usual on a committee that carried three hike dissents in July. |
| Wed, Aug 26 | Core PCE Price Index MoM (exp 0.2%, prior 0.1%) — HIGH IMPACT | The single most consequential number of the week. With the growth-scare argument for patience removed by a 52-month-high composite, September is now hostage to the inflation data. A firm core print two days before Warsh speaks changes the distribution of outcomes for the front end. |
| Wed, Aug 26 | Q2 GDP Growth Rate 2nd Estimate (exp 1.5%, prior 2.1%); Personal Income (exp 0.3%) and Personal Spending (exp 0.2%) MoM | The Q2 baseline against which the survey’s near-3% Q3 track and GDPNow’s 4.0% are measured. Spending is the swing variable in both, and a soft print would put the acceleration story entirely on the services survey. |
| Wed, Aug 26 | Durable Goods Orders MoM (exp 0.7%, prior 0.3%); ex-transport (exp 0.5%, prior 0.6%) | The capex read on a manufacturing sector whose output just fell to a 13-month low even as the composite hit a four-year high. This is where the services-versus-factory divergence either narrows or hardens. |
| Wed, Aug 26 | Jackson Hole Symposium opens (8:00 p.m. ET), running through Friday | Chair Warsh’s first symposium in the chair, arriving on top of a 56.0 composite and a fresh core PCE print. Positioning into it is being set by a market carrying a 15-handle VIX. |
| Thu, Aug 27 | Initial Jobless Claims (prior 206K); Advance Goods Trade Balance (exp -$99B, prior -$101.4B); Wholesale and Retail Inventories Adv | Claims at 206K remain the cleanest evidence that the labour market is not cracking underneath the growth reacceleration. The trade and inventory data now carry tariff distortion, with safety-stock building fading and supply-chain delays at four-year widths. |
| Fri, Aug 28 | Chair Warsh’s Jackson Hole keynote | The most consequential Fed communication of the quarter. It follows a 2.8-point PMI beat, a front-end-led yield backup, and Wednesday’s core PCE — and it is the first opportunity to hear how the new chair frames a committee where three members already voted to hike. |
| Fri, Aug 28 | Non-Farm Payrolls Annual Revision Preliminary (prior -911K); Michigan Consumer Sentiment Final (exp 51.0, prior 55.2); Chicago PMI (prior 57.6) | Last year’s preliminary benchmark revision cut 911,000 jobs; a second large downward revision would reframe the labour market sitting underneath a 3% growth track. Michigan at 51.0 against an accelerating activity survey is the sharpest contradiction currently in the data. |
KEY QUESTIONS:
1. If Wednesday’s core PCE prints at or above the 0.2% consensus on top of a 56.0 composite, does Warsh use Friday’s keynote to put a September hike back on the table — and is a market carrying a 15-handle VIX positioned for that answer?
2. Does the hard-asset bid hold through a dollar recovery? Gold and Bitcoin both rallied with the dollar flat and yields higher, so the usual mechanism was absent. Metals that keep their gains when the dollar index bounces confirm a genuine preference shift; metals that hand them back were a positioning move all along.
3. Do the Canadian duties survive first contact on Monday — and if the reported auto and steel concessions never appear in a proclamation, what does a USMCA that can be overridden at 50% on 439 lines with three days’ notice do to the way North American supply chains are contracted from here?
— US market commentary trusted by family offices and institutions. Apply for membership at join.recessionalert.comH. CHART OF THE DAY -> TOP
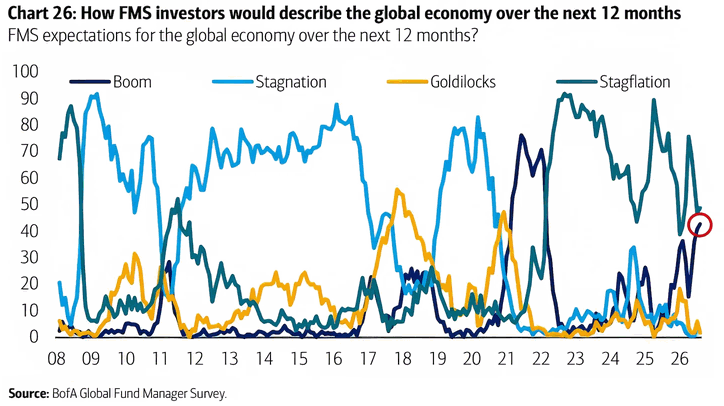
The most bullish equity book in five years is being underwritten by a coin flip. Global equity allocation sits net 56% overweight, the highest since November 2021, financed by a four-way survey that has quietly become one-way: Boom near 42 and Stagflation near 49, together capturing roughly nine in ten of 180 managers polled, while Goldilocks and Stagnation — the two cells built on below-trend inflation — sit at about 1 apiece. Managers have stopped arguing about prices. Boom and Stagflation share the same above-trend inflation call; the only thing separating them is growth, and growth is what a single speech can move. They have already positioned for that price call: consumer allocation sits net 31% underweight — staples at -19, discretionary at -12, the deepest sustained range since 2005-07 — a book built for households to wear it. Kevin Warsh gives his first keynote as Fed Chair at Jackson Hole in seven days, and a hawkish tone doesn’t need to touch anyone’s inflation view — it only needs to make growth look fragile, sliding Boom back toward Stagflation, which sat near 76 earlier this year before optimism cut it down. The net 39% bond underweight holds either way; the equity overweight pays out only in the Boom half. A hawkish Warsh doesn’t have to say a word about stocks — he just has to sound uncertain about growth, and the crowd’s biggest bet stops being consensus-sized and starts being minority-sized, in the space of one speech.
What it means: the market’s biggest shared bet only pays if the economy runs hot without stalling, and almost nobody is insured against the other outcome. The cheapest protection is usually whatever the crowd has abandoned — here, bonds and everyday consumer stocks. Watch the yellow Goldilocks line: it has not topped the stagflation line since mid-2021, and if it climbs back, this setup is wrong.
Market Intelligence Brief (MIB) Ver. 19.12
For professional investors only. Not investment advice.
© 2026 RecessionALERT.com

Comments are closed.