
MARKET INTELLIGENCE BRIEF (MIB)
Tuesday, August 18, 2026
A Wall Street Journal tally of $3 trillion in off-balance-sheet AI commitments gutted the memory complex — SNDK -9%, MU -7%, chips -5.4% — and dragged the Nasdaq 100 down 1.68%. Trump says no Iran talks; a bulk carrier was struck inside Hormuz and crude rose a third session. Housing starts collapsed 12.4%. Section 338 tariffs on Canada bite at midnight. GDPNow’s Q3 estimate has lost a third in a fortnight. Gold fell 1.79% anyway — the hedge failed.
TABLE OF CONTENTS
A. EXECUTIVE SUMMARY
B. MARKET DATA
C. HIGH-IMPACT STORIES (5)
D. MODERATE-IMPACT STORIES (6)
E. ECONOMY WATCH (5)
F. EARNINGS WATCH (1)
G. WHAT’S NEXT
H. CHART OF THE DAY
A. EXECUTIVE SUMMARY -> TOP
Equities fell on two separate impulses that happened to coincide: a Wall Street Journal tally of roughly $3 trillion in off-balance-sheet AI commitments at Big Tech, which stripped 5.4% from the semiconductor complex and 1.68% from the Nasdaq 100, and a Hormuz standoff in which Washington and Tehran described the same waterway in mutually exclusive terms while a bulk carrier was struck inside it. The combination — crude up a third session (WTI $84.32, +0.69%) with equities down and yields easing — is the stagflationary configuration, cost pressure without demand strength. Beneath it, the Atlanta Fed cut its Q3 nowcast to 4.03% from 6.2% in a fortnight, with private investment doing the cutting: the same variable the AI disclosure repriced, read from a different instrument. Breadth was narrow rather than broken — eight of eleven sectors lower, Technology -2.53%, but Healthcare +1.40%, Consumer Defensive +0.94% and Energy +1.09% closed green, and the Dow gave up just 0.22%.
• A concentrated tech unwind, not a market-wide flush — S&P 500 -0.69% to 7,691.76, Nasdaq 100 -1.68%, Dow -0.22%, Russell 2000 -1.30%, VIX +4.28% to 15.84. The six-point spread between the Dow and the Nasdaq 100 is not what a genuine risk-reduction event looks like.
• Memory and foundries led the AI de-rating — SanDisk -9.01%, Micron -7.02%, Intel -6.58%, Western Digital -5.3%, with SOXX off roughly 5.4%. United Microelectronics, GlobalFoundries and Tower fell 7-10% on no company-specific news of their own, which marks this as thesis-level repricing rather than a set of individual disappointments.
• Section 338 duties on roughly $20 billion of Canadian goods take effect at 12:01 a.m. ET Wednesday — the first presidential use of the statute in US history, permanent rather than time-limited, and USMCA qualification provides no shelter. Home Depot beat on both lines this morning but reaffirmed rather than raised full-year guidance.
• Housing starts collapsed 12.4% to 1.239 million against a 1.35 million consensus while permits beat at 1.443 million and pending home sales hit their lowest since January. The 30-year Treasury sits near 5.33%, a 19-year high — and Real Estate still fell 0.39% on a day the 10-year eased 1.9 bps.
• Rotation, not liquidation — the software ETF closed up 0.6% against chips at -5.4%, a six-point divergence inside one sector, while Healthcare and Consumer Defensive took the top gainer slots: Eli Lilly +3.60%, AbbVie +3.43%, Johnson & Johnson +3.33%. Netflix rose 2.30%.
• Gold fell 1.79% to $4,393.65 and silver 4.00% on a risk-off session — with the VIX up, yields down and the dollar flat at 99.67, there was no currency move to blame. The hedge failed on exactly the kind of day it is held for.
1. The AI trade split rather than broke — the $3 trillion disclosure contained no new information about demand or orders; it revealed that contracted spending sits outside the balance-sheet metrics investors were using to size the risk. What repriced was the discount rate, not the cash flows, and the tape sorted accordingly: memory and foundries down 7-10%, software up, and KKR bidding a 21% premium for a gas and power distributor. Owning the physical assets AI capital expenditure requires is now valued differently from supplying them.
2. Two instruments, one variable — the Atlanta Fed’s nowcast cut came from real gross private domestic investment, which is precisely where data-centre construction and equipment spending land in the national accounts. That the model marked down investment in the same session an accounting analysis de-rated the semiconductor complex is not coincidence of timing. The ambiguity is genuine: 4.03% is still an exceptional growth rate, and deceleration from an unsustainable 6.2% is the path that lets the Fed hold. Positioning, not direction, is the live question.
3. The risk is the book, not the news — a record 56% of fund managers expect a “no landing” outcome and just 4% a hard landing, readings BofA’s own strategists call a sell signal. Today supplied the test in clean form: one analysis, no new demand data, 5.4% off the chips. That asymmetry is what a one-sided book produces, and it argues for rotating within risk assets rather than adding to them — which is what the tape did.
 — Leading economic indicators. Accurate market forecasts. Apply for membership at join.recessionalert.com
B. MARKET DATA -> TOP
Escalating US-Iran tensions and swelling AI-valuation anxiety drove a broad risk-off session, with the Nasdaq 100 (-1.68%) and Russell 2000 (-1.30%) leading a decline the blue-chip Dow (-0.22%) mostly shrugged off. The selloff was concentrated in semiconductors — Sandisk (-9.01%), Micron (-7.02%) and Intel (-6.58%) — while Healthcare and Consumer Defensive led a defensive rotation into safer ground. Crude oil rose alongside falling yields as fading hopes for a US-Iran deal lifted the whole energy complex, a stagflationary combination that pressured risk sentiment further. Gold’s -1.79% slide despite the risk-off backdrop was the day’s standout anomaly — profit-taking, not a flight-to-safety signal.
CLOSING PRICES – August 18, 2026:
MAJOR INDICES
Nasdaq 100’s -1.68% drop dwarfed the Dow’s -0.22% slip — a concentrated tech/semis unwind rather than a market-wide flush, echoed by NYSE Composite’s milder -0.36% breadth read. Despite today’s synchronized pullback, DJIA and DJTA both remain within 2% of their 10-session highs, extending Dow Theory bull confirmation into a third session — though DJTA’s steeper -1.60% decline signals fraying momentum beneath that still-intact technical backdrop.
| Index | Close | Change | %Move | Why It Moved |
|---|---|---|---|---|
| S&P 500 | 7,691.76 | -53.30 | -0.69% | Iran-tension risk-off plus AI-valuation selloff in tech |
| Dow Jones | 53,343.40 | -116.38 | -0.22% | Blue-chip resilience; smallest index decline of the session |
| DJ Transportation | 21,495.23 | -349.20 | -1.60% | Underperformed alongside broad industrial weakness |
| Nasdaq 100 | 29,490.96 | -504.42 | -1.68% | Concentrated AI/semiconductor valuation selloff |
| Russell 2000 | 3,017.89 | -39.65 | -1.30% | Tracked the broader risk-off tape |
| NYSE Composite | 24,629.14 | -88.67 | -0.36% | Broad-market decline, milder than tech-heavy gauges |
VOLATILITY & TREASURIES
VIX’s 4.28% spike alongside falling yields (10Y -1.9bps, 2Y -0.9bps) is a clean flight-to-safety signature — bond demand rising with equity fear, not an inflation scare. DXY’s flat +0.04% move means the dollar isn’t capturing the safe-haven bid this time; gold’s -1.79% slide is the session’s odd disconnect, more consistent with profit-taking after its 2026 run than genuine risk aversion.
| Instrument | Level | Change | Why It Moved |
|---|---|---|---|
| VIX | 15.84 | +0.65 (+4.28%) | Spiked on geopolitical plus AI-valuation anxiety |
| 10-Year Treasury Yield | 4.705% | -1.9 bps | Eased on a flight-to-safety bid |
| 2-Year Treasury Yield | 4.173% | -0.9 bps | Eased in step with the 10Y |
| US Dollar Index (DXY) | 99.67 | +0.04 (+0.04%) | Roughly flat; not absorbing the safe-haven bid |
COMMODITIES
Gold (-1.79%) and silver (-4.00%) sold off together despite the risk-off tape — a pairing that reads as broad precious-metals profit-taking rather than fear unwinding, with platinum (-3.73%) confirming the PGM-wide retreat. Copper’s -2.40% drop tracked dimming US-Iran deal prospects even as tightening global supply provides a floor. Bitcoin’s flat +0.41% shows no fear-driven flight into or out of crypto today.
| Asset | Price | Change | %Move | Why It Moved |
|---|---|---|---|---|
| Gold | $4,393.65/oz | -$80.05 | -1.79% | Fell despite risk-off — profit-taking after 2026 rally |
| Silver | $63.580/oz | -$2.651 | -4.00% | Tracked gold, amplified by industrial-demand exposure |
| Copper | $6.4575/lb | -$0.1585 | -2.40% | Dimming US-Iran deal prospects; tight supply floor |
| Platinum | $1,722.15/oz | -$66.75 | -3.73% | PGM-complex selloff alongside gold and silver |
| Bitcoin | $64,681.0 | +$261.0 | +0.41% | Roughly flat, decoupled from equity/commodity moves |
ENERGY
WTI (+0.69%) and Brent (+0.33%) moved in tandem as fading hopes for an extended US-Iran deal lifted the whole crude complex — a geopolitical risk premium, not a regional disruption. Natural gas rode the same energy-wide bid, with Henry Hub (+3.79%) and Dutch TTF (+3.45%) both up sharply. Oil rising alongside falling equities is the stagflationary read: cost pressure, not demand strength.
| Asset | Price | Change | %Move | Why It Moved |
|---|---|---|---|---|
| Crude Oil (WTI) | $84.32/bbl | +$0.58 | +0.69% | Rose on fading US-Iran deal prospects |
| Crude Oil (Brent) | $91.17/bbl | +$0.30 | +0.33% | Tracked WTI; a global not regional risk premium |
| Natural Gas (Henry Hub) | $2.792/MMBtu | +$0.102 | +3.79% | Rode the broader energy-complex bid |
| Natural Gas (Dutch TTF) | $21.68/MMBtu | +$0.72 | +3.45% | Rode the broader energy-complex bid; European exposure |
S&P 500 SECTORS
A clear defensive rotation is underway — Healthcare (+1.40%) and Consumer Defensive (+0.94%) led while Energy (+1.09%) rode the oil rally; 8 of 11 sectors closed lower, led by Technology’s -2.53% AI-valuation unwind. Real Estate’s -0.39% decline despite falling yields is the odd one out — risk-aversion overriding the rate tailwind REITs would normally get.
| Sector | 1-Day | 1-Week | 1-Month | 3-Month | 6-Month | YTD | 12-Month |
|---|---|---|---|---|---|---|---|
| Healthcare | +1.40% | +0.89% | +5.62% | +15.04% | +6.78% | +9.32% | +24.33% |
| Energy | +1.09% | +3.18% | +7.68% | +1.92% | +17.53% | +38.12% | +44.74% |
| Consumer Defensive | +0.94% | +0.65% | +0.56% | -3.25% | -4.65% | +8.23% | +5.11% |
| Financial | -0.13% | -0.13% | +3.05% | +11.48% | +9.97% | +8.15% | +15.00% |
| Real Estate | -0.39% | +1.10% | -1.86% | +2.85% | +1.95% | +10.13% | +8.17% |
| Consumer Cyclical | -0.45% | -2.64% | +1.01% | -0.74% | -0.15% | -3.71% | +0.30% |
| Utilities | -0.52% | +0.15% | -2.59% | -1.18% | -6.67% | +1.92% | +3.77% |
| Communication Services | -0.57% | -1.35% | -3.63% | -10.13% | +1.84% | -2.50% | +8.65% |
| Basic Materials | -1.49% | -2.22% | +9.32% | +0.67% | -2.84% | +14.31% | +32.04% |
| Industrials | -1.81% | -0.33% | +4.34% | +3.19% | +1.53% | +15.62% | +20.52% |
| Technology | -2.53% | -0.41% | +5.57% | +5.68% | +26.29% | +23.17% | +31.05% |
TOP MEGA-CAP MOVERS:
GAINERS
| Company | Ticker | Close | Change | Why It Moved |
|---|---|---|---|---|
| Lilly (Eli) & Co | LLY | 1,225.73 | +3.60% | Defensive-rotation leader in Healthcare |
| AbbVie Inc | ABBV | 258.92 | +3.43% | Healthcare rotation bid |
| Johnson & Johnson | JNJ | 271.11 | +3.33% | Healthcare rotation bid |
| ExxonMobil Holdings Corp | XOM | 165.56 | +2.54% | Rode the crude-oil rally on Iran-deal risk premium |
| Netflix Inc | NFLX | 77.77 | +2.30% | Bill Ackman’s Pershing Square disclosed a new stake |
DECLINERS
| Company | Ticker | Close | Change | Why It Moved |
|---|---|---|---|---|
| Sandisk Corp | SNDK | 1,625.78 | -9.01% | Led the AI-valuation semiconductor unwind |
| Micron Technology Inc | MU | 940.76 | -7.02% | AI-valuation semiconductor selloff |
| GE Vernova Inc | GEV | 1,004.53 | -6.90% | AI-capex power-demand names caught in the unwind |
| Intel Corp | INTC | 96.68 | -6.58% | AI-valuation semiconductor selloff |
| KLA Corp | KLAC | 194.79 | -5.33% | Semiconductor-equipment weakness alongside chipmakers |
— Institutional-grade intelligence for serious investors. Apply for membership at join.recessionalert.comC. HIGH-IMPACT STORIES -> TOP
BEARISH
1. Trump Declares There Are No Talks With Iran While Tehran Sets Conditions to Reopen Hormuz — and a Bulk Carrier Is Struck Inside the Strait
The core facts:President Trump posted today that there are “no talks or conversations going on, or scheduled, with the Islamic Republic of Iran,” and separately claimed the Strait of Hormuz is open and operating with all water mines removed or detonated, while confirming the US naval blockade remains in full force. Iran’s parliament speaker Mohammad Bagher Ghalibaf issued a direct same-day contradiction, restating that the Strait will not reopen until Washington ends the blockade, lifts sanctions on Iranian oil and unfreezes Iranian assets held abroad. Hours earlier, at 01:35 UTC — 21:35 ET Monday — the Greek-owned, Liberia-flagged bulk carrier Minoan Dignity was struck by an unidentified projectile in its engine room during an outbound transit; UKMTO logged the report from the vessel’s company security officer and the chief engineer was killed. Crude extended a third consecutive session of gains, with WTI up 0.69% to $84.32 and Brent up 0.33% to $91.17, while the VIX rose 4.28% to 15.84 and Energy was one of only three S&P 500 sectors to close higher, at +1.09%.
Why it matters:Two governments described the same waterway in mutually exclusive terms on the same day, and a fatal strike occurred inside it — which means the risk premium is not resolving toward either reopening or formal closure, but persisting in a contested middle state that markets price worst. Transit traffic has fallen to a five-day average of roughly ten crossings, the lowest since May, against approximately 130 per day before the war. The configuration matters more than the level: crude rising while equities fall and Treasury yields ease is the stagflationary combination, cost pressure arriving without demand strength to justify it. This is also the mechanism by which a distant geopolitical standoff reaches a US portfolio — not through direct exposure, but through an energy input that raises costs across every sector simultaneously while the growth outlook is being marked down elsewhere in the same session.
What to watch:The API crude stock change at 4:30 p.m. ET today and the EIA Weekly Petroleum Status Report at 10:30 a.m. ET Wednesday, August 19. A sustained Brent break above $92 would signal the market pricing prolonged closure rather than a negotiated reopening.
BEARISH
2. A Wall Street Journal Tally Puts $3 Trillion of AI Commitments Off Big Tech’s Balance Sheets, and the Memory Complex De-Rates Within Hours
The core facts:A Wall Street Journal analysis of footnote disclosures found that nine of the largest technology companies carry roughly $3 trillion in off-balance-sheet commitments tied to AI infrastructure, against approximately $600 billion of combined reported capital expenditure over their most recent twelve-month periods. The total divides into two buckets: unstarted leases of roughly $904 billion to $1.2 trillion, covering data-centre space contracted but not yet occupied and therefore not recognised as a liability under current accounting rules; and purchase commitments of roughly $1.52 trillion to $1.9 trillion, covering long-term agreements for chips, data-centre construction and energy procurement. The report circulated midday and drove SanDisk down 9.01%, Micron down 7.02% and Western Digital down 5.3%, with the iShares Semiconductor ETF falling roughly 5.4%. Foundries fell on no company-specific news of their own: United Microelectronics down 7%, GlobalFoundries down 7% and Tower Semiconductor down 10%. Technology was the weakest S&P 500 sector at -2.53%, and the Nasdaq 100’s -1.68% was the worst showing among the major indices.
Why it matters:The analysis does not disclose new spending. It discloses that spending already contracted sits outside the balance-sheet metrics investors have been using to size AI capital-expenditure risk — which means the exposure was never mispriced so much as unmeasured. Coverage consistently frames today’s move as a rate-and-expectations reset rather than evidence of demand deterioration, and the distinction carries real consequences: an expectations reset reprices the same cash flows at a higher discount rate, while a demand break would reduce the cash flows themselves. With the 30-year Treasury at a 19-year high, the discount rate applied to multi-year commitments rose in the same week their true scale became visible. That the selling reached foundries with no company-specific catalyst confirms this was a thesis-level repricing rather than a set of individual disappointments.
What to watch:Analog Devices reports before the open Wednesday, August 19, with the options market implying a 5.8% move. It is the first large semiconductor print since the de-rating and the cleanest available test of whether order books contradict the valuation reset.
BEARISH
3. US-Canada Talks End Without a Deal, and the First Presidential Use of Section 338 in American History Takes Effect at Midnight
The core facts:Negotiations ran to the close of today’s session with no agreement, no extension and no withdrawal of the July 20 proclamations. An additional 50% ad valorem duty on roughly $20 billion of listed Canadian products takes effect at 12:01 a.m. ET Wednesday, August 19, applying to goods entered for consumption or withdrawn from warehouse on or after that time. The three proclamations represent the first presidential use of Section 338 of the Tariff Act of 1930 in US history. Covered goods remain dutiable even when they qualify under the USMCA. The named sectors are motor vehicles, alcoholic beverages and dairy, but the annexes reach cement, plywood, furniture, glassware, textiles, leather, printed circuit boards and industrial machinery. Carve-outs cover energy products, potash, certain fish and seafood, critical minerals, goods already subject to Section 232 duties, and WTO civil-aircraft goods other than unmanned aircraft. The duties are permanent rather than time-limited. The Canadian Federation of Independent Business released survey data today finding that 40% of small exporters to the US have products directly captured by the list; of those, 77% expect revenue to decline, 35% expect a drop of at least half, and 5% expect revenues to fall to zero.
Why it matters:Permanence is the market-relevant feature, and it is the one most easily lost in coverage focused on the deadline. A time-limited tariff is a negotiating instrument that importers can wait out by drawing down inventory; a permanent one forces supply-chain relocation decisions with capital attached to them. That USMCA qualification provides no shelter removes the principal hedge North American manufacturers constructed after 2020, which means the exposure is not confined to firms that failed to plan. For US investors the transmission runs through input costs in building products, packaging, machinery and food and beverage — sectors where the duty lands on a component rather than a finished good, and therefore surfaces in margin rather than in shelf prices. Home Depot’s decision this morning to reaffirm rather than raise full-year guidance despite beating on both lines is the first visible corporate response to the cliff.
What to watch:Whether Canada announces a formal retaliation package, none having been announced as of today, and the unresolved Section 232 vehicle-tariff formula — specifically whether the duty is calculated after deducting US content only, as Washington proposes, or all North American content, as Ottawa seeks.
BEARISH
4. Housing Starts Collapse While the 30-Year Sits at a 19-Year High — and Real Estate Fell on a Day Yields Eased
The core facts:July housing starts fell 12.4% to 1.239 million against expectations near 1.35 million, while building permits beat at 1.443 million and pending home sales fell 2.3% to their lowest level since January. Section E carries the data in full. The market-relevant frame is the financing backdrop against which those numbers landed: the 30-year Treasury yield sits at roughly 5.33%, its highest since 2007, and the 30-year fixed mortgage averaged about 6.67% as of August 13. Lennar and D.R. Horton both traded lower over the past week. Toll Brothers reported after today’s close with EPS of $2.97 against $2.93 expected on revenue of $2.66 billion. Real Estate closed down 0.39% even though the 10-year Treasury yield eased 1.9 basis points on the session.
Why it matters:Real estate declining on a day the 10-year fell is the signal worth extracting. REITs and builders normally receive a mechanical bid when the belly of the curve eases; that it failed to arrive means risk aversion overrode the rate tailwind, and the sector is no longer trading as a rates derivative. The permits beat set against the starts miss carries its own message: builders are still pulling entitlements while declining to break ground, which is an option being preserved rather than exercised, and it is what a sector does when it expects conditions to improve but not yet. The binding constraint is the long end rather than the front end — and the 30-year is precisely the part of the curve that a September Fed decision does least to control, which is why rate-cut expectations have provided the complex with so little relief.
What to watch:Whether the 30-year Treasury holds above 5.30%. Lowe’s reports before the open Wednesday, August 19, and with Home Depot’s comparable sales already in hand the pair will separate genuine repair-and-remodel demand from company-specific execution.
UNCERTAIN
5. The Atlanta Fed’s Q3 Nowcast Has Shed a Third of Its Growth Estimate in Two Weeks, and Investment Is Doing the Cutting
The core facts:The Atlanta Fed’s GDPNow model cut its Q3 2026 estimate to 4.03% today from 4.31% on August 14, a 0.28 percentage-point reduction driven by real gross private domestic investment being revised to 13.7% annualised growth from 15.2%. The two-week path is the story rather than the single revision: 6.2% on August 3, 5.8% on August 6, 4.31% on August 14 and 4.03% today — roughly a third of the projected growth rate removed in a fortnight. GDPNow is a mechanical model that updates as source data arrives and embeds no judgemental overlay, so the decline reflects incoming data rather than a change of view.
Why it matters:The component doing the damage is the one most exposed to today’s other dominant story. Gross private domestic investment is where data-centre construction and equipment spending land in the national accounts, so a nowcast cutting investment in the same session that a $3 trillion off-balance-sheet commitment tally de-rates the semiconductor complex is not a coincidence of timing — the two are readings of the same underlying variable from different instruments. The ambiguity here is genuine rather than rhetorical: 4.03% remains an exceptionally strong absolute growth rate, and deceleration from an unsustainable 6.2% is precisely the disinflationary path that would allow the Fed to hold rather than tighten. September hike odds have already fallen from near-certainty in late July to roughly one-third. The bearish reading and the bullish reading draw on the same number, which is why positioning rather than direction is the live question.
What to watch:The July FOMC minutes at 2:00 p.m. ET Wednesday, August 19. Three regional presidents dissented hawkishly at that meeting, and the minutes will show whether the investment strength they were reacting to was already fading when they voted.
— Quantifying recession risk so you don’t have to guess. Apply for membership at join.recessionalert.comD. MODERATE-IMPACT STORIES -> TOP
UNCERTAIN
6. Money Left Semiconductors for Software and Defensives — the Software ETF Closed Higher While Chips Fell 5.4%
The core facts:The iShares Expanded Tech-Software ETF closed up 0.6% while the iShares Semiconductor ETF fell roughly 5.4% — a divergence of about six percentage points between two segments of the same sector in a single session. Netflix rose 2.30% and Adobe rallied alongside it, both drawn from a group of beaten-down large-cap software names: Netflix is down 19% year to date, Salesforce 28% and Adobe 27%, in each case without a corresponding collapse in fundamentals. Running simultaneously was a defensive rotation, with Healthcare up 1.40% and Consumer Defensive up 0.94% the only sectors besides Energy to close green; Eli Lilly gained 3.60%, AbbVie 3.43% and Johnson & Johnson 3.33%, taking the top three places among mega-cap gainers. Eight of eleven S&P 500 sectors closed lower.
Why it matters:This was rotation rather than liquidation, and the distinction determines whether today was a warning or a reshuffle. Capital moved within equities rather than out of them, which is why the Dow fell only 0.22% while the Nasdaq 100 lost 1.68% — a spread that would not exist in a genuine risk-reduction event. Two distinct trades ran at once and should not be conflated: a valuation rotation out of AI hardware into software names whose earnings have not deteriorated, which is a bet that the AI theme continues but the winners change; and a defensive rotation into healthcare and staples, which is a bet that it does not. That both found buyers on the same afternoon is the clearest evidence that the market has not settled on which reading of the AI capex disclosure is correct.
What to watch:Whether the software bid survives a semiconductor bounce. If the software ETF holds its gains while chips recover, this was durable repositioning; if it gives them straight back, it was a one-session hedge.
UNCERTAIN
7. Gold Fell 1.79% and Silver 4% on a Risk-Off Day — the Session’s Cleanest Contradiction
The core facts:Gold fell $80.05 to $4,393.65 an ounce, a decline of 1.79%. Silver fell 4.00% to $63.58, platinum 3.73% to $1,722.15 and copper 2.40% to $6.4575 a pound. All of it occurred on a session when the VIX rose 4.28%, equities fell across eight of eleven sectors and Treasury yields eased at both the two-year and ten-year points. The dollar was effectively unchanged, with the DXY up 0.04% at 99.67, and Bitcoin was flat at +0.41%.
Why it matters:The flight-to-safety trade ran cleanly in Treasuries and the VIX but not in metals, and the dollar’s flatness eliminates the most common explanation for that divergence — there was no currency move to work against the complex. What remains is a position-driven read: gold has run hard through 2026, and a crowded long is vulnerable to profit-taking precisely when other assets are being marked down and cash is needed elsewhere. No verified catalyst was identified for the move and none is asserted here; the divergence itself is the reportable fact. Copper is the one member of the group with a separate and sufficient explanation, since it trades on growth expectations and those were cut today. The practical implication is that gold’s usefulness as an equity hedge failed on exactly the kind of day it is held for.
What to watch:Whether the decline extends through the week. A single session of profit-taking inside an uptrend is indistinguishable from the first session of a trend break; only the following few sessions separate them.
BULLISH
8. KKR Bids Roughly $9 Billion for UGI at a 21% Premium — Power Distribution Is Now Priced as an AI Asset
The core facts:The Wall Street Journal reported that KKR has made an approximately $9 billion takeover approach for UGI Corporation at $42.50 per share, a 21.1% premium to UGI’s August 17 closing price of $35.09. UGI’s businesses span natural gas and electric utilities, propane distribution and energy infrastructure. Shares rose more than 6% before trading was halted for a volatility pause, subsequently trading up roughly 12% to about $39.41. Neither KKR nor UGI has confirmed the approach and both declined to comment; the reported proposal does not guarantee a transaction. KKR shares fell about 1% on the session.
Why it matters:The bid values a regulated distribution utility as a scarce strategic asset rather than as a yield instrument, which is a repricing of the category and not merely of one company. Data-centre electricity demand has converted generation and distribution capacity into infrastructure with genuine option value, and private capital is now willing to pay a control premium to own it outright rather than contract for it. This is the constructive counterpart to today’s semiconductor de-rating, and the pairing is instructive: the same AI thesis that cost memory names 7% to 9% is what makes a gas and power distributor worth a 21% premium. That GE Vernova fell 6.90% in the same session confirms the AI-power trade is not moving in one direction — the market is discriminating between exposure to AI capital expenditure and ownership of the physical assets that capital expenditure requires.
What to watch:Whether UGI’s board engages or rejects, and whether a competing bidder emerges. A second approach would confirm the asset class is being repriced rather than one company being opportunistically targeted.
BULLISH
9. Citi Unveils Custody+ and Confirms Native Bitcoin Custody This Year, Placing Digital Assets Inside the Securities Stack
The core facts:Citigroup unveiled Custody+ today, a modular custody suite forming part of a multi-year rebuild of its post-trade infrastructure, offering near- and real-time settlement services, cash and liquidity management, on-demand FX and AI-driven market intelligence. The bank confirmed it expects to launch digital-asset custody later in 2026 for institutional clients, beginning with Bitcoin, delivered inside the same framework used for traditional securities rather than as a separate operational stack. Citi is the fourth-largest US bank by total assets. The move places it alongside BNY Mellon, State Street, US Bank and Standard Chartered among large custodians offering native custody, as distinct from routing exposure through ETFs or third-party providers.
Why it matters:This is a bank-infrastructure story rather than a crypto-price story, and it should be read as such — Bitcoin closed up 0.41% and did nothing today that would make it market-moving on its own. The significance is that custody, not conviction, has been the binding constraint on institutional allocation: mandates that prohibit third-party custodians have been structurally excluded from the asset class regardless of what their managers believed about it. Collapsing digital and traditional assets into a single operating model removes a cost and control objection rather than a directional one, which is the sort of change that alters flows quietly and over quarters. For Citi specifically it is a fee-income story attached to the post-trade franchise, not a balance-sheet bet. Financials closed down 0.13%, so none of this was priced today.
What to watch:The confirmed launch date and the initial supported asset list. Extension beyond Bitcoin to Ethereum or tokenised Treasuries would signal Citi is building for tokenised settlement generally rather than accommodating a single asset.
BEARISH
10. A Record 56% of Fund Managers Expect “No Landing” — and BofA’s Own Strategists Call It a Sell Signal
The core facts:BofA’s August Global Fund Manager Survey found a record 56% of respondents expecting a “no landing” outcome for the US economy and 43% expecting a boom, the highest reading since February 2022, against just 4% expecting a hard landing. Section E carries the survey data in full. BofA’s own strategists flagged the readings as a contrarian sell signal, with the firm’s Bull & Bear indicator elevated, and recommended that investors rotate within risk assets rather than add to them.
Why it matters:The survey measures positioning rather than forecasting outcomes, and its value to a portfolio manager is inverse to its optimism. Record consensus around a benign outcome means the marginal buyer has already bought, which leaves a tape with no reserve of incremental demand to absorb a surprise. Today supplied the test in unusually clean form: a single accounting analysis, containing no new data about demand or orders, removed roughly 5.4% from the semiconductor complex and 1.68% from the Nasdaq 100. That is the signature of stretched positioning — the reaction function becomes asymmetric because there is dry powder on only one side. The recommendation to rotate rather than reduce is also worth noting, since it is precisely what the tape did today, and it suggests the sell signal is being read as a warning about concentration rather than about direction.
What to watch:The September survey’s “no landing” share. A sharp retreat would confirm today’s de-rating changed minds rather than merely prices.
BEARISH
11. Nokia Will Close Almost All Mainland China Sites by Year End, Ending Four Decades in the Market
The core facts:The South China Morning Post reported that Nokia will cut most of its mainland China workforce and close its sites there in stages by year end. A Nokia spokesperson confirmed the direction of travel, stating that the company is adjusting its operational footprint in China to reflect a business that has steadily declined in recent years. Nokia employed roughly 7,200 staff across mainland China, Hong Kong and Taiwan at the end of 2025, with sites in Beijing, Shanghai, Hangzhou, Chengdu and Qingdao, and the redundancies span both the mobile networks and network infrastructure divisions. China revenue has fallen from approximately EUR 2.2 billion in 2018 to EUR 913 million in 2025, a decline of 58%. A separate closure of the Hangzhou radio R&D facility, with roughly 1,600 job cuts, was communicated to employees on August 13 within a EUR 350 million China restructuring programme. Nokia’s US-listed shares fell about 4% in premarket trade.
Why it matters:A Western infrastructure vendor conceding the world’s second-largest telecom equipment market is a data point about market access, not about cost discipline, and the difference matters for how it should be extrapolated. Domestic competitors have taken share under procurement conditions that no amount of restructuring reverses, which makes this an exit rather than a retrenchment. For US investors the read-through runs to Cisco, Ciena and the optical supply chain already under pressure in today’s session: if the addressable market for Western network equipment is being partitioned geographically, the scale economics that justify large R&D budgets compress for every participant, not just the one announcing today. A 58% revenue decline over seven years is the measure of how long this has been underway.
What to watch:Whether Ericsson follows. It faces the same market and the same competitors, and a second exit would convert a company decision into a structural change in the industry.
— Separating signal from noise since 2007. Apply for membership at join.recessionalert.comE. ECONOMY WATCH -> TOP
Today’s data undercut the market’s own optimism: housing starts collapsed 12.4% to a 1.239M pace — the sharpest miss of the summer — while pending home sales fell to their lowest level since January as 30-year mortgage rates hold near 6.55%. Building permits beat expectations and industrial production cooled to 0.2% growth, and import/export prices both fell in July, offering the Fed some disinflationary room even as trade volumes soften. The disconnect is stark against BofA’s August survey, where a record 56% of fund managers now expect “no landing” and just 4% see a hard landing — sentiment running well ahead of the hard data. GDPNow held near 4.0% for Q3, but the housing-led softening bears watching into next week’s FOMC minutes.
Housing Starts Plunge 12.4% to 1.239M as Building Permits Beat Estimates at 1.443M (Census Bureau, Aug 18, 2026)
What they’re saying:July housing starts fell 12.4% month-over-month to a seasonally adjusted annual rate of 1.239 million, badly missing the 1.35 million consensus and down 13.5% year-over-year. Building permits, a forward-looking gauge, rose 5.0% to 1.443 million, topping the 1.37 million estimate.
The context:The divergence signals planned construction remains healthy even as actual building activity weakened sharply, coming against a backdrop of the 30-year Treasury yield pushing above 5.3% — its highest since 2007. Elevated financing costs are pressuring builders to pull back on starts even as they bank permits for future projects.
What to watch:August housing starts and permits data due mid-September; the 20-year bond auction on August 19 for a read on long-end demand.
Pending Home Sales Fall 2.3% in July to Lowest Level Since January (National Association of Realtors, Aug 18, 2026)
What they’re saying:NAR’s Pending Home Sales Index fell 2.3% in July and is down 2.2% year-over-year, the lowest reading since January 2026, with contract signings declining in all four major U.S. regions. Chief Economist Lawrence Yun attributed the pullback to mortgage rates hitting their highest level of the year in mid-July.
The context:The 30-year fixed rate hit 6.55% the week of July 16 and has held above 6.5% for nine weeks, keeping a lid on contract activity even as pending sales remain roughly 30% below pre-pandemic 2019 levels. Yun noted payroll employment is 5% above 2019 levels, pointing to pent-up demand that could unlock once affordability improves.
What to watch:The 30-year mortgage rate release (Aug 20) and existing home sales data for confirmation of the slowdown.
Import and Export Prices Both Decline in July as Energy Costs Ease (Bureau of Labor Statistics, Aug 18, 2026)
What they’re saying:U.S. import prices fell 0.4% in July, the largest monthly drop since May 2025, driven by a 7.2% slide in fuel import prices. Export prices fell 1.3%, extending June’s 0.7% decline. Nonfuel import prices still rose 0.4% on higher capital goods and auto costs.
The context:The pullback in energy-driven import costs offers the Fed some disinflationary room even as prices remain up 5.9% (imports) and 8.2% (exports) year-over-year, underscoring the gap between easing energy costs and still-elevated core trade prices.
What to watch:August CPI and PPI prints for whether the energy relief feeds through to headline inflation.
Industrial Production Growth Slows to 0.2% in July, Missing Estimates (Federal Reserve, Aug 18, 2026)
What they’re saying:Industrial production rose 0.2% in July, below the 0.3% consensus; manufacturing production grew a modest 0.2%, in line with estimates. Capacity utilization held steady at 76.3%.
The context:The soft print adds to today’s broader theme of decelerating hard data even as permits and sentiment surveys point to resilience, reinforcing the GDPNow model’s recent step-down in investment growth estimates for Q3.
What to watch:August ISM Manufacturing PMI and the Philadelphia Fed Manufacturing Index (Aug 20) for confirmation of the factory-sector trend.
Record 56% of Fund Managers Now Expect “No Landing” as BofA Warns of Stretched Positioning (BofA Global Research, Aug 18, 2026)
What they’re saying:BofA’s August Global Fund Manager Survey found a record 56% of respondents now expect a “no landing” scenario and 43% foresee an economic “boom” — the most since February 2022 — while only 4% anticipate a hard landing. 72% of investors don’t expect the Fed to hike before the November midterms.
The context:BofA’s own strategists flagged the extreme consensus as a contrarian warning, recommending investors “retreat or rotate within risk assets rather than reload” given how one-sided positioning has become; BofA’s Bull & Bear indicator is flashing a sell signal.
What to watch:Whether incoming data (today’s housing and production misses) begins to challenge the survey’s near-unanimous optimism.
— Know the probability before the market prices in the risk. Apply for membership at join.recessionalert.comF. EARNINGS WATCH -> TOP
YESTERDAY AFTER THE BELL (Markets Reacted Today)
No major earnings yesterday after the bell from companies with >$100B market cap. Recorded exclusion: BHP Group Limited ADR (BHP), $226.32B, reported after Monday’s close with EPS of $2.76 against $2.67 expected and revenue of $31.16B against $30.21B expected — excluded solely because it is an ADR, not because it was overlooked. The largest qualifying non-ADR reporter on Monday was Fabrinet (FN) at a $17.29B market cap, well below the threshold.
TODAY BEFORE THE BELL (Markets Already Reacted)
UNCERTAIN
12. Home Depot (HD): -0.12% | Best Comparable Sales in Fifteen Quarters, and Guidance Held Anyway
The Numbers:Released BMO. Revenue $47.86B against $47.24B expected, a beat of 1.31% and growth of 5.7% year over year. Adjusted EPS $4.92 against $4.73 expected, a beat of 4.04% and growth of 5.1%; GAAP EPS $4.79 against $4.65 expected. Comparable sales rose 1.7%. Full-year fiscal 2026 guidance was reaffirmed rather than raised: comparable sales flat to up 2%, total sales growth of approximately 2.5% to 4.5%. Market cap $336.52B.
The Problem/Win:The win is breadth rather than magnitude. A 1.7% comparable-sales figure is the strongest since Q3 fiscal 2022 — roughly fifteen quarters — and 13 of 16 merchandising departments posted positive comps, with professional customers outperforming DIY shoppers. The problem is what management declined to do with it. Guidance was reaffirmed despite a beat on both lines, and the quarter also included $730 million of tariff refunds, of which $685 million was applied to reduce cost of goods sold. Those refunds were described as the vast majority of what the company expects to receive, which makes them a material and explicitly non-recurring contributor to the reported margin.
The Ripple:Consumer Cyclical closed down 0.45%. The stock’s -0.12% response to a two-line beat carrying the best comps in nearly four years is the sector’s read-through in miniature: the market discounted the quarter and priced the guidance decision instead. Lowe’s reports before the open Wednesday, August 19 into an identical setup, and the home-improvement pair now frames the read on financed renovation demand with the 30-year mortgage near 6.7%.
What It Means:A clean beat that management declined to extrapolate, delivered one day before 50% Section 338 duties on Canadian goods take effect. Treat the reaffirmation as information about the tariff outlook rather than about second-half demand.
What to watch:Lowe’s comparable sales Wednesday morning against Home Depot’s +1.7%. A similar print confirms genuine repair-and-remodel demand; a divergence makes this a Home Depot execution story.
TODAY AFTER THE BELL (Markets React Tomorrow)
No major earnings after the bell from companies with >$100B market cap. The largest after-the-bell reporter today was Keysight Technologies (KEYS) at a $58.28B market cap, followed by Toll Brothers (TOL) at $13.35B — both well below the threshold, and no ADR above $100B reported after the close.
WEEK AHEAD PREVIEW:
Q2 2026 earnings season is 88% reported and effectively complete. The remaining calendar is dominated by August-quarter retailers, a single large semiconductor print and the Canadian banks.
Analog Devices (ADI) — BMO, Wednesday, August 19 — $183.45B market cap; consensus $3.34 EPS on $3.92B revenue. Key focus: whether industrial, data-centre and automotive strength is durable enough to support a projected 59.4% full-year EPS increase. The options market implies a 5.8% move, and this is the first large semiconductor report since today’s de-rating.
TJX Companies (TJX) — BMO, Wednesday, August 19 — $166.64B market cap; consensus $1.19 EPS on $15.16B revenue, roughly 5% sales growth. Key focus: traffic, merchandise margin, and whether off-price continues to capture trade-down as tariffs raise full-price retail costs.
Lowe’s (LOW) — BMO, Wednesday, August 19 — $120.91B market cap; consensus $4.22 EPS on $26.13B revenue. Key focus: comparable sales measured against Home Depot’s +1.7% today, and whether the 30-year mortgage near 6.7% is deferring financed renovation projects.
Walmart (WMT) — BMO, Thursday, August 20 — $916.77B market cap; consensus $0.74 EPS on $186.62B revenue. Key focus: the widest available read on trade-down behaviour, grocery pricing and tariff pass-through, arriving one day after the Section 338 duties take effect.
Deere (DE) — BMO, Thursday, August 20 — $158.92B market cap; consensus $4.69 EPS on $10.81B revenue. Key focus: steel and aluminium tariff costs against margin, continued weakness in large agriculture, and whether lower dealer inventories support the expected cyclical upturn.
Bank of Montreal (BMO) — BMO, Tuesday, August 25 — $128.93B market cap; consensus $2.69 EPS on $6.99B revenue. Key focus: credit provisions against rising Canadian unemployment and a soft Greater Toronto Area housing market, with the Section 338 duties now a live input to the commercial book.
Bank of Nova Scotia (BNS) — BMO, Tuesday, August 25 — $111.09B market cap; consensus $1.49 EPS on $7.15B revenue. Key focus: 90-day delinquencies, which rose last quarter across credit cards, unsecured lines of credit, mortgages and auto loans, and the flat dividend against peers that raised.
No company above $100B market capitalisation reports on Friday, August 21 or Monday, August 24. Two ADRs above the threshold are excluded by scope rather than omitted: Alibaba Group Holding ADR ($307.16B, Thursday) and PDD Holdings ADR ($124.22B, Monday). Q3 2026 earnings season begins mid-October, large banks first.
— US market commentary trusted by family offices and institutions. Apply for membership at join.recessionalert.comG. WHAT’S NEXT -> TOP
UPCOMING RELEASES:
| Date | Event | Why It Matters |
|---|---|---|
| Wed, Aug 19 | Section 338 duties on ~$20B of Canadian goods take effect (12:01 a.m. ET) | First presidential use of the statute in US history, permanent rather than time-limited, and USMCA qualification provides no shelter. Transmission runs through input costs in building products, packaging, machinery and food and beverage — margin, not shelf price. |
| Wed, Aug 19 | FOMC Minutes, July meeting (2:00 p.m. ET) | Three regional presidents dissented hawkishly at that meeting. The minutes will show whether the investment strength they were reacting to was already fading when they voted — directly relevant now that GDPNow has cut Q3 to 4.03% from 6.2% in a fortnight. |
| Wed, Aug 19 | EIA Weekly Petroleum Status Report (10:30 a.m. ET); prior crude build 17.422M, gasoline -0.968M | First inventory read since the Minoan Dignity strike inside Hormuz. Transit traffic has fallen to roughly ten crossings a day against about 130 before the war; a build would argue the risk premium is running ahead of physical disruption. |
| Wed, Aug 19 | 20-Year Treasury Bond Auction | A direct test of long-end demand with the 30-year near 5.33%, its highest since 2007. The long end is the part of the curve a September Fed decision does least to control, and it is what is binding on housing. |
| Wed, Aug 19 | MBA 30-Year Mortgage Rate (prior 6.77%) | Rates have held above 6.5% for nine weeks, which is what Lawrence Yun attributed July’s 2.3% pending-sales drop to. Any relief here is the first condition for starts recovering from the 12.4% collapse. |
| Thu, Aug 20 | Initial Jobless Claims (expected 212K, prior 209K) | The labour market is the one hard series that has not yet joined the deceleration showing up in starts, industrial production and the GDPNow investment component. A break above trend would change the September framing quickly. |
| Thu, Aug 20 | Philadelphia Fed Manufacturing Index (expected 25, prior 41.4) | The consensus already implies a sharp step-down. Coming two days after industrial production missed at 0.2%, it tests whether the factory softening is a single month or a trend — and it lands with the Canadian tariff cliff one day old. |
| Mon, Aug 24 | Chicago Fed National Activity Index (prior -0.02) | A broad 85-indicator composite that aggregates the hard data individually missing this month. A reading below zero confirms growth running under trend regardless of what the nowcast’s headline still says. |
| Tue, Aug 25 | CB Consumer Confidence (prior 90.8) | The first sentiment read taken with tariffs on Canadian consumer goods actually in force. The gap between soft-survey resilience and hard-data deterioration is the month’s central tension. |
| Tue, Aug 25 | New Home Sales (prior 0.628M) | Builders are pulling permits while declining to break ground — an option preserved rather than exercised. New home sales show whether the demand side justifies that patience or argues against it. |
| Tue, Aug 25 | S&P/Case-Shiller Home Price YoY (prior 1.6%) | Price growth at 1.6% is already close to flat. With financing costs at multi-decade highs, a move toward zero would remove the equity cushion that has kept existing owners out of the market rather than in it. |
KEY QUESTIONS:
1. Do Wednesday’s July FOMC minutes already read as stale? Three presidents dissented hawkishly on the strength of an investment picture that GDPNow has since marked down by a third — if the minutes show that softening was visible at the meeting, the September debate moves from hike to hold faster than the 72% who expect no move before the midterms are positioned for.
2. Was the semiconductor de-rating a discount-rate reset or the first sign of a demand question? Analog Devices reports Wednesday before the open with the options market implying a 5.8% move — the first large chip print since the disclosure, and the cleanest available test of whether order books contradict the valuation reset.
3. Can the long end stabilise, and does housing get anything from it if it does? With the 30-year near a 19-year high, Wednesday’s 20-year auction is the test — but Real Estate fell on a day the 10-year eased, which suggests the sector has stopped trading as a rates derivative and may not respond even to a good result.
— US market commentary trusted by family offices and institutions. Apply for membership at join.recessionalert.comH. CHART OF THE DAY -> TOP
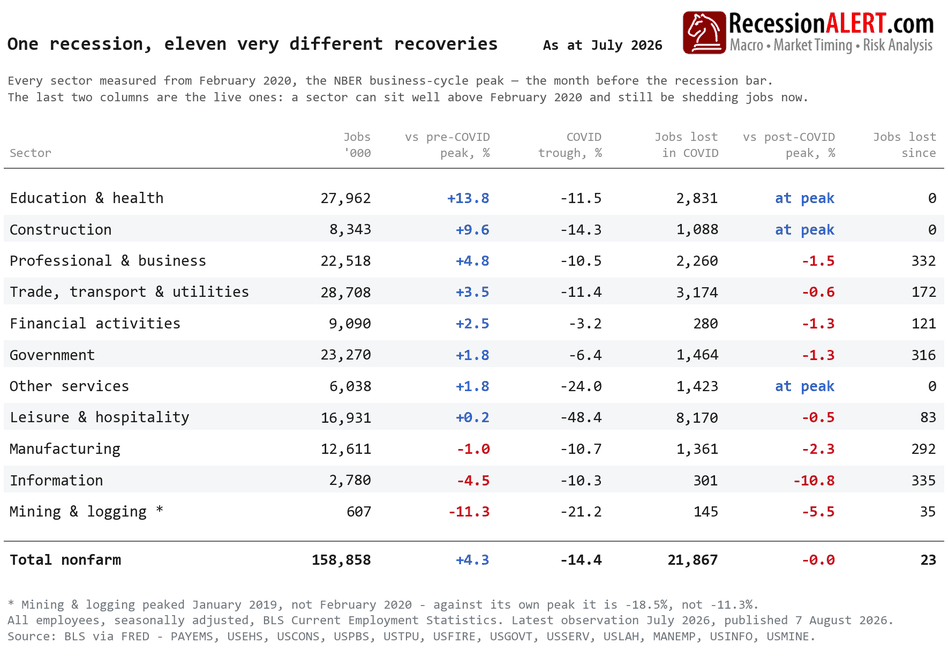
“Recovered” and “growing” have quietly become different claims, and this table is built to let you conflate them: eight of eleven supersectors sit above their February 2020 level, but only three — education & health, construction, other services — are still sitting at their own post-COVID high, all three setting it in July. That gap, until July, lived only inside the sector rows. Total nonfarm itself peaked at 158,881,000 in June and slipped to 158,858,000 in July, a 23,000 loss — small, plausibly revised away — but the same reversal eight of eleven sectors have already lived through. Those three still-climbing sectors are barely 26.7% of employment yet supplied 64.6% of every job added back since February 2020, education & health alone accounting for 51.8%, so the climb from the 130,376,000 April 2020 trough to June’s peak has long run through a narrow channel. Information shows what the same imbalance looks like once it runs the other way: 335,000 jobs lost since its own November 2022 high, against 301,000 lost in the entire COVID collapse, the newer loss spread over 44 months rather than three — duration risk rather than depth risk, harder to underwrite because it never produces one dateable low. The figure to watch isn’t July’s 23,000; it’s whether education & health, construction, and other services keep setting new highs. When the last three engines idle, there’s nothing left underneath to catch the fall.
What it means: cyclical exposure — staffing, freight, consumer discretionary — carries more downside than a payroll count this narrow can show. Watch for a fourth sector reaching its own high; that, not the next monthly print, would change the read.
Market Intelligence Brief (MIB) Ver. 19.00
For professional investors only. Not investment advice.
© 2026 RecessionALERT.com

Comments are closed.