
MARKET INTELLIGENCE BRIEF (MIB)
Thursday, August 6, 2026
Iran’s restrictive Hormuz draft blew up the reopening trade — Brent +4.72% to $83.20, Energy the lone sector gainer. Banks dragged the Dow down 464 points; Goldman and Citi each off more than 2.5%. Q2 unit labour costs came in at 1.3% against 2.1% expected and claims held below 200K for a third week — yields rose anyway. SpaceX doubled its float and still closed up 6.14%. Williams says AI isn’t a bubble; tech steadied, Microsoft +2.54%. July payrolls Friday, 80K expected.
TABLE OF CONTENTS
A. EXECUTIVE SUMMARY
B. MARKET DATA
C. HIGH-IMPACT STORIES (5)
D. MODERATE-IMPACT STORIES (5)
E. ECONOMY WATCH (5)
F. EARNINGS WATCH (8)
G. WHAT’S NEXT
H. CHART OF THE DAY
A. EXECUTIVE SUMMARY -> TOP
MARKET SNAPSHOT
Equities eased in a narrow, blue-chip-led decline after Iran published a restrictive draft plan for Strait of Hormuz transit, unwinding a reopening trade that had cut crude roughly 8% earlier in the week: Brent added 4.72% to $83.20 while the Dow fell 0.85% to 53,885.16 against the S&P 500’s 0.18% slip. The more consequential development was a collision of inflation channels — Q2 unit labour costs rose just 1.3% against a 2.1% consensus, yet yields rose across the curve (10Y +5.8bp to 4.675%) while September hike odds fell to roughly 48%, meaning the bid came from imported energy rather than the policy path. Breadth argues against reading the decline broadly: the NYSE Composite fell only 0.12%, and the Dow’s damage concentrated in two high-priced banks, Goldman -2.62% and Citigroup -2.78%. Energy was the lone meaningful gainer at +1.56%, while Real Estate (-0.91%) and Utilities (-0.48%) — the longest-duration groups — lagged.
TODAY AT A GLANCE
• Brent +4.72% to $83.20 and WTI +3.60% to $77.93 after Iran’s Hormuz draft imposed tighter transit conditions than the market had positioned for; Energy was the only sector meaningfully higher at +1.56%, with ExxonMobil +2.12% and Chevron +1.51%.
• The Dow fell 463.96 points on bank weakness — Goldman Sachs -2.62% to $1,032.58 and Citigroup -2.78% to $133.82 — yet the NYSE Composite slipped just 0.12% and the VIX fell 4.24% to 15.14, marking a compositional decline rather than a risk event.
• The domestic cost data was uniformly soft: Q2 unit labour costs rose 1.3% against a 2.1% estimate on 1.4% productivity growth, initial claims held at 199K for a third straight week below 200,000 — the longest streak since 1969 — and Challenger July job cuts fell 27% to a two-year low of 33,429.
• Yields rose across the curve with the front end leading (10Y +5.8bp to 4.675%, 2Y +6.4bp to 4.243%, DXY +0.29% to 99.96) even as Polymarket odds of a September hike fell to roughly 48% from 57% — inflation compensation, not policy repricing.
• SpaceX closed +6.14% at $114.92 despite its first post-IPO lock-up releasing up to 911.5 million shares, lifting the float to 11.8% of shares outstanding from 4.9%; the stock printed a new low of $105.11 intraday before reversing, and remains ~15% below the $135 IPO price.
• Two forward markers: July payrolls land Friday with consensus near +80K and unemployment at 4.2%, and 50% Section 338 tariffs on Canadian goods take effect Wednesday, August 19 with no USMCA-origin carve-out.
KEY THEMES
1. Two Inflation Channels Now Point in Opposite Directions — The cleanest domestic cost print in months arrived on the same session crude jumped nearly 5%, and the market chose energy. That split matters more than either datapoint: a committee facing wage-driven inflation has a working instrument, while one facing an imported supply shock does not — tightening into it trades an inflation overshoot for a growth undershoot. It explains the day’s apparent contradiction of falling hike odds alongside rising yields. Portfolios should treat the disinflation trade as intact but no longer in control of the curve; the Hormuz talks, not the labour data, now set the near-term rate path.
2. A Narrow Decline Wearing a Broad One’s Clothes — The Dow fell roughly five times as hard as the S&P 500, but the NYSE Composite outperformed both for a second consecutive session and the VIX fell. Strip two high-priced bank declines and most of the 464-point drop disappears. The bank move itself is the signal worth holding: a curve that firms should help net interest margin, so Goldman and Citigroup selling off says the market is discounting capital-markets volumes an energy-driven inflation impulse would compress — a read corroborated by Real Estate and Utilities finishing weakest. This is a duration and rate-sensitivity rotation, not a de-risking.
3. The AI Trade Sorts by Balance Sheet, With the Fed’s Blessing on the Credit Channel — Dell -5.41% and Arista -2.53% gave back parabolic runs on no company news while Microsoft added 2.54% on 43% Azure growth, extending the discrimination between hardware assembly at thin margins and recurring cloud consumption. New York Fed President Williams then addressed the systemic question directly, declining to call a bubble and saying he is not worried about the leverage funding the buildout. That is a financial-stability judgement, not a valuation one: it argues an AI de-rating stays contained in equity multiples rather than transmitting into credit. Multiple risk remains fully live.
 — Leading economic indicators. Accurate market forecasts. Apply for membership at join.recessionalert.com
B. MARKET DATA -> TOP
Crude surged sharply — WTI +3.60%, Brent +4.72% — even as US equities eased, a supply-shock signature that lifted Energy to today’s only meaningful sector gain (+1.56%) despite its worst weekly showing (-1.82%). The pullback was blue-chip led: the Dow fell 0.85% versus the S&P’s 0.18% dip, while NYSE Composite breadth held up better at -0.12%. Treasury yields firmed across the curve (10Y +1.26%, 2Y +1.53%) alongside a modestly stronger dollar, while gold and copper sat essentially flat. The mix — oil up, stocks down, yields higher — points to mild stagflationary cost-pressure concerns rather than a growth scare.
CLOSING PRICES – August 6, 2026:
MAJOR INDICES
The Dow’s -0.85% decline outpaced the S&P’s -0.18% slip, a blue-chip-led pullback rather than a broad selloff — NYSE Composite’s smaller -0.12% dip confirms breadth held up better than headline blue-chip weakness suggests. Dow Theory flags a fresh non-confirmation emerging today: the Industrials sit within 2% of a 10-session high while the Transports remain more than 5% below their own high, the transport index failing to confirm industrial strength. Small-caps (Russell -0.57%) and mega-cap growth (Nasdaq 100 -0.39%) moved in a similarly narrow band, showing no clear rotation signal.
| Index | Close | Change | %Move | Why It Moved |
|---|---|---|---|---|
| S&P 500 | 7,709.98 | -13.57 | -0.18% | Modest pullback as financials weakness and profit-taking in AI hardware offset an Energy-led oil rally amid a heavy earnings day |
| Dow Jones | 53,885.16 | -463.96 | -0.85% | Underperformed on broad-based bank weakness (GS, C) amid hawkish Fed repricing after Kashkari’s rate-hike remarks |
| DJ Transportation | 21,424.10 | -153.20 | -0.71% | Fell alongside broader transports weakness, failing to confirm the Dow’s proximity to a 10-session high (Dow Theory non-confirmation) |
| Nasdaq 100 | 29,373.33 | -114.46 | -0.39% | DELL and ANET profit-taking pullbacks offset MSFT’s continued post-earnings Azure/AI-driven gains |
| Russell 2000 | 3,001.85 | -17.34 | -0.57% | Small-caps eased in line with the broader modest risk-off tone |
| NYSE Composite | 24,484.06 | -29.75 | -0.12% | Marginal decline; broader breadth held up better than headline blue-chip indices |
VOLATILITY & TREASURIES
Yields rose across the curve (10Y +1.26%, 2Y +1.53%) while VIX fell 4.24% to 15.14 — a mild reflationary signature, not a fear signal, even as equities eased slightly. The 2Y’s faster climb than the 10Y flattens the curve modestly, hinting at near-term hawkish repricing after Kashkari’s rate-hike comments rather than growth alarm. DXY’s modest +0.29% gain is consistent with a front-end-led yield move, not a broad safe-haven bid.
| Instrument | Level | Change | Why It Moved |
|---|---|---|---|
| VIX | 15.14 | -0.67 (-4.24%) | Fear gauge eased despite the modest equity pullback, consistent with a reflationary rather than risk-off read |
| 10-Year Treasury Yield | 4.675% | +5.8 bps | Firmed alongside the front end on hawkish Fed commentary and a stronger dollar |
| 2-Year Treasury Yield | 4.243% | +6.4 bps | Led the curve higher after Minneapolis Fed’s Kashkari said “now is the time” to start raising rates |
| US Dollar Index (DXY) | 99.96 | +0.29 (+0.29%) | Firmed modestly in line with the front-end-led yield move |
COMMODITIES
Precious and industrial metals moved together in a narrow band — gold and copper essentially flat, silver and platinum off a modest 0.6-0.7% — signaling no distinct safe-haven or industrial-demand divergence today. Bitcoin’s -0.54% slide tracked the broader modest risk-off tone in equities rather than diverging on crypto-specific news.
| Asset | Price | Change | %Move | Why It Moved |
|---|---|---|---|---|
| Gold | $4,301.62/oz | -$3.58 | -0.08% | Essentially flat; no distinct safe-haven bid today |
| Silver | $61.86/oz | -$0.43 | -0.70% | Modest pullback in line with broader metals |
| Copper | $6.72/lb | -$0.00 | -0.04% | Essentially flat; no industrial-demand signal today |
| Platinum | $1,736.10/oz | -$10.80 | -0.62% | Modest pullback in line with broader metals |
| Bitcoin | $64,504 | -$347.00 | -0.54% | Tracked the broader modest equity pullback rather than moving on crypto-specific news |
ENERGY
Brent’s +4.72% gain outpacing WTI’s +3.60% points to a global rather than US-centric supply disruption tied to renewed Iran/Strait of Hormuz tension. Henry Hub fell 1.93% even as Dutch TTF surged 5.87% — Europe’s gas market is decoupled from both crude and the US gas complex, its own geopolitical story. Crude rallying sharply while equities eased is a supply-shock signature, a mildly stagflationary read for portfolios.
| Asset | Price | Change | %Move | Why It Moved |
|---|---|---|---|---|
| Crude Oil (WTI) | $77.93/bbl | +$2.71 | +3.60% | Surged on renewed Iran/Strait of Hormuz supply-risk tension |
| Crude Oil (Brent) | $83.20/bbl | +$3.75 | +4.72% | Outpaced WTI on the same Iran-linked supply-risk tension, underscoring the global scope of the disruption |
| Natural Gas (Henry Hub) | $2.64/MMBtu | -$0.05 | -1.93% | Decoupled from the crude rally, reflecting US-specific supply/demand dynamics |
| Natural Gas (Dutch TTF) | $18.79/MMBtu | +$1.04 | +5.87% | Surged well beyond Henry Hub, a distinct European supply-risk dynamic |
S&P 500 SECTORS
Energy’s reversal is the session’s clearest signal — today’s only sector gainer (+1.56%) was also the worst performer over the past week (-1.82%), a sharp bounce inside an entrenched YTD/12-month leadership position. Consumer Cyclical shows the mirror image: the week’s top performer (+5.84%) sits near the bottom today (-0.60%).
| Sector | 1-Day | 1-Week | 1-Month | 3-Month | 6-Month | YTD | 12-Month |
|---|---|---|---|---|---|---|---|
| Energy | +1.56% | -1.82% | +4.80% | +0.46% | +12.56% | +30.03% | +35.26% |
| Healthcare | +0.21% | +0.05% | -0.29% | +10.47% | +4.88% | +6.10% | +24.58% |
| Technology | +0.03% | +5.11% | +2.95% | +7.22% | +28.62% | +23.09% | +34.24% |
| Industrials | -0.19% | +3.68% | -1.10% | -2.16% | +3.79% | +14.19% | +18.21% |
| Consumer Defensive | -0.20% | -0.55% | +0.68% | -1.45% | -3.28% | +8.24% | +7.10% |
| Financial | -0.31% | +1.22% | +4.84% | +10.99% | +7.86% | +8.74% | +18.40% |
| Utilities | -0.48% | -2.43% | -3.97% | -6.98% | -0.87% | +1.80% | +3.76% |
| Communication Services | -0.54% | +5.13% | -1.10% | -7.87% | -0.13% | +0.54% | +16.64% |
| Consumer Cyclical | -0.60% | +5.84% | +3.06% | -2.46% | -2.25% | -2.07% | +7.06% |
| Basic Materials | -0.68% | +3.73% | +7.49% | -4.29% | -2.62% | +13.51% | +35.42% |
| Real Estate | -0.91% | -1.49% | +0.99% | +0.88% | +7.06% | +10.38% | +7.78% |
TOP MEGA-CAP MOVERS:
GAINERS
| Company | Ticker | Close | Change | Why It Moved |
|---|---|---|---|---|
| Space Exploration Technologies Corp | SPCX | $114.92 | +6.14% | Extending its post-earnings rally (Q2 EPS and revenue beat, Aug. 4) even as a 911.5M-share lock-up expiration hit the float today |
| Microsoft Corp | MSFT | $499.86 | +2.54% | Extending its Azure/AI-driven post-earnings rally (Azure revenue +43% YoY reported Aug. 3) |
| ExxonMobil Holdings Corp | XOM | $154.84 | +2.12% | Tracked the crude oil rally on renewed Iran/Strait of Hormuz supply-risk tension |
| Lilly (Eli) & Co | LLY | $1,191.94 | +1.89% | Extending a beat-and-raise Q2 rally on strong Mounjaro/Zepbound demand (reported Aug. 5) |
| Chevron Corp | CVX | $189.23 | +1.51% | Tracked the crude oil rally on renewed Iran/Strait of Hormuz supply-risk tension |
DECLINERS
| Company | Ticker | Close | Change | Why It Moved |
|---|---|---|---|---|
| Dell Technologies Inc | DELL | $437.65 | -5.41% | Profit-taking after a near-9% single-session surge on Aug. 4 left it close to its 52-week high, with no new earnings catalyst until Aug. 27 |
| Citigroup Inc | C | $133.82 | -2.78% | Pressured with the broader financials pullback amid hawkish Fed repricing (Kashkari’s rate-hike remarks) and higher front-end yields |
| Goldman Sachs Group Inc | GS | $1,032.58 | -2.62% | Pressured with the broader financials pullback amid hawkish Fed repricing (Kashkari’s rate-hike remarks) and higher front-end yields |
| Arista Networks Inc | ANET | $192.32 | -2.53% | Profit-taking pullback after a 5-session, ~25% AI-networking-driven rally to record highs |
| UnitedHealth Group Inc | UNH | $403.97 | -2.13% | No fresh company-specific catalyst identified; eased in a mixed session for managed-care names |
— Institutional-grade intelligence for serious investors. Apply for membership at join.recessionalert.comC. HIGH-IMPACT STORIES -> TOP
BEARISH
1. Iran Publishes a Restrictive Draft Plan for Hormuz Transit and the Reopening Trade Unwinds — Brent Adds 4.72% to $83.20
The core facts:Iranian state news agency Fars published an initial draft plan governing transit through the Strait of Hormuz that placed materially more restrictive conditions on ship traffic than the market had been positioned for. Brent crude rose $3.75, or 4.72%, to $83.20 a barrel and WTI rose $2.71, or 3.60%, to $77.93. Brent’s larger move points to a global rather than US-centric supply disruption. The draft lands against a very different expectation set: crude had fallen roughly 8% earlier in the week after Treasury Secretary Scott Bessent told CNBC on Tuesday that a deal to open Hormuz with freedom of movement could come as soon as Wednesday. Iran and Oman remain in talks to define transit routes, and reports of attacks on Saudi tankers in the Red Sea and Gulf of Aden compounded the supply tension. Energy was the only S&P sector to post a meaningful gain, up 1.56%, with ExxonMobil adding 2.12% to $154.84 and Chevron 1.51% to $189.23. Hormuz has been largely blocked by Iran since February 28.
Why it matters:Yesterday this report described a market that had explicitly subordinated Bab el-Mandeb escalation to the prospect of Hormuz reopening — a Houthi missile strike that set a Saudi tanker on fire lifted Brent above $80 intraday and the entire gain was surrendered by the close. Today the same ranking ran in reverse and did far more damage. The market was not long a de-escalation headline; it was short energy risk on the expectation of a specific outcome, and Iran’s draft repriced that outcome rather than cancelling it. That distinction is what makes a 4.72% single-session move possible in an asset where the underlying physical situation did not change at all. Nothing was blockaded today that was not blockaded yesterday. What changed is the terms on which the chokepoint might reopen, and the market discovered it had been pricing a clean reopening rather than a negotiated one. The transmission into US portfolios is unfavourable in a specific way. Crude rallying 3.6% while equities decline and Treasury yields rise across the curve is a supply-shock signature, not a growth signal — it raises input costs and inflation breakevens simultaneously without any offsetting demand improvement. That is the configuration that damages equity multiples and bond prices at once, and it removes the disinflationary tailwind this report has tracked through two consecutive EIA inventory builds. The constraint on reading this too darkly is that a draft is not a final agreement and the negotiating process continues; Iran has an obvious incentive to open from a maximalist position. But the asymmetry now sits against the market. A reopening on restrictive terms is worth far less than the reopening that was priced, and a failure of the talks is worth considerably less again.
What to watch:Whether Brent holds above $83 into next week, which would confirm the market has repriced the terms of any reopening rather than reacted to a single headline. Watch for the Iran-Oman talks producing a signed routing agreement — the specific detail that matters is whether transit conditions apply to all flags or only to designated corridors.
BEARISH
2. The Curve Firms Across the Board and the Banks Lead the Dow Down 464 Points — Goldman and Citigroup Each Fall More Than 2.5%
The core facts:Treasury yields rose across the curve, the 10-year up 5.8 basis points to 4.675% and the 2-year up 6.4 basis points to 4.243%, with the front end leading. The dollar index firmed 0.29% to 99.96. The Dow Jones Industrial Average fell 463.96 points, or 0.85%, to 53,885.16 — the worst performance among the major averages and roughly five times the S&P 500’s 0.18% decline. Financials fell 0.31% as a sector, with the damage concentrated in the money-centre and investment banks: Goldman Sachs dropped 2.62% to $1,032.58 and Citigroup 2.78% to $133.82, both among the five largest mega-cap decliners of the session. The VIX fell 4.24% to 15.14 despite the equity decline. Real Estate was the weakest sector at -0.91%, and Utilities fell 0.48% — the two most rate-sensitive groups in the index.
Why it matters:The instinctive explanation is hawkish Fed repricing, and it is worth being precise about why that explanation is incomplete. Rate-hike rhetoric was yesterday’s event, not today’s, and prediction markets did not move toward a September increase — Polymarket showed roughly 48% for a 25 basis-point hike, below the 57% this report documented yesterday and well below the 67% of two sessions ago. Yields nonetheless rose. When the front end firms while the priced probability of tightening falls, the move is coming from inflation compensation rather than from the policy path, and Story 1 supplies the mechanism directly: a 4.72% jump in Brent lifts breakevens across the curve on the same session. The bank selloff is the part that deserves the most attention, because it cuts against the textbook. Higher yields and a steeper cost of funds are conventionally read as favourable for net interest margin, and financials have been among the year’s better sectors. Goldman and Citigroup falling more than 2.5% on a day the curve firmed says the market is not trading the margin — it is trading the capital-markets franchise, which depends on issuance, advisory and trading volumes that a genuine energy-driven inflation impulse would compress. That reading is corroborated by the sector pattern rather than resting on the banks alone: Real Estate and Utilities, the two groups with the most duration in their cash flows, were the weakest and third-weakest sectors respectively. The mitigating evidence is real and should temper the conclusion. The VIX fell 4.24%, credit showed no stress, and the S&P’s decline was only 0.18% — this was a rotation with a rate input, not a risk event. But a market that reprices duration, discounts the capital-markets complex and leaves volatility sellers untroubled is one that has decided the inflation problem is a cost problem rather than a crisis.
What to watch:The 10-year at 4.675% for a break above 4.70%, which would take yields to their highest of this cycle’s recent range and put the August 11-13 refunding auctions into a materially worse setup. Watch whether the banks recover if crude stabilises — a failure to do so would isolate a capital-markets concern from the energy trade.
UNCERTAIN
3. Unit Labour Costs Undershoot Consensus by Nearly a Full Point on the Same Session Crude Adds 4.72% — Two Inflation Channels Move in Opposite Directions
The core facts:The Bureau of Labor Statistics released preliminary second-quarter productivity and costs data showing unit labour costs rising well below consensus while productivity beat expectations; Section E carries the reading and its composition in full. The market-relevant layer is that the print was unambiguously disinflationary on the domestic cost channel and arrived on the same morning that Brent crude rose 4.72% and WTI 3.60% on the Hormuz draft in Story 1. The market resolved the conflict in favour of energy: Treasury yields rose across the curve rather than falling, the 10-year up 5.8 basis points to 4.675% and the 2-year up 6.4 basis points to 4.243%, and the dollar firmed 0.29%. Gold was essentially unchanged at $4,301.62, down 0.08%, and the VIX fell 4.24% to 15.14. Prediction-market odds of a September Federal Reserve rate hike stood at roughly 48% on Polymarket, below the 57% of the prior session.
Why it matters:Unit labour costs are the single cleanest measure of whether wage growth is being financed by output or by prices, and a print this soft alongside stronger productivity is the configuration the Federal Reserve has spent two years asking for. The market gave it almost nothing. That is the observation worth carrying forward, and it has a defensible explanation: the domestic cost channel and the imported energy channel are now pushing in opposite directions, and on any single session the one with the larger daily variance wins the tape. Crude moved 4.72% today; unit labour costs are a quarterly series that is heavily revised and, as practitioners routinely note, rarely a market mover precisely because measuring it is so variable. The deeper point is what this split does to the Federal Reserve’s problem. A committee facing wage-driven inflation has a clear instrument — restrictive policy compresses labour demand. A committee facing energy-driven inflation does not; raising rates does not produce barrels, and tightening into a supply shock trades an inflation overshoot for a growth undershoot. Today’s data says the first problem is receding while today’s price action says the second is arriving. That is precisely the configuration in which a central bank that has held the funds rate at 3.50%-3.75% for five consecutive meetings finds its options narrowing rather than widening, and it explains why hike odds fell even as yields rose — the market is pricing higher inflation compensation and a less able Federal Reserve at the same time. The reason this reads uncertain rather than bearish is that the disinflationary evidence is genuine and cumulative, not a single print, and if the Hormuz talks produce a workable agreement the energy channel reverses quickly while the labour-cost improvement persists. That is a materially better outcome than today’s tape implies.
What to watch:The 10-year breakeven inflation rate rather than the nominal yield — a widening breakeven alongside a stable real yield would confirm this is an energy repricing rather than a policy repricing. Watch whether the next CPI print shows services disinflation consistent with today’s labour-cost data, which would isolate the energy contribution cleanly.
UNCERTAIN
4. SpaceX’s First Lock-Up Since the June IPO Releases Roughly $100 Billion of Stock and More Than Doubles the Float — the Shares Close Up 6.14%
The core facts:Up to 911.5 million SpaceX Class A shares — worth roughly $100 billion, with some estimates near $116 billion — became eligible for sale today, the first unlock since the company’s June initial public offering. Freely tradable stock rose to 11.8% of shares outstanding from 4.9%, taking the tradable count to approximately 1.55 billion from the 639 million that changed hands at the IPO. Elon Musk’s 6.4 billion shares remain locked until June 2027. A further 319 million shares unlock on August 12, with additional tranches in September and October; more than 4 billion shares are expected to be tradable by year-end. The stock traded to a new low of $105.11 in early dealing before reversing hard to close at $114.92, up 6.14% and the largest mega-cap gainer of the session. That close still leaves it roughly 15% below the $135 IPO price and about 49% below the June 16 peak of $225.64. The company reported second-quarter results on August 4 showing revenue of $7.81 billion growing 92%, alongside $18.4 billion of quarterly capital expenditure.
Why it matters:Lock-up expiries are mechanically bearish and usually resolve that way: supply arrives, the marginal holder is a seller who has been waiting months for an exit, and the price clears lower. The intraday action followed that script exactly, to a new all-time low. What happened next did not. A stock that more than doubles its float and closes up 6.14% has demonstrated that demand at these levels exceeds the supply the unlock released — and it did so on a session when the broad market fell and the Nasdaq 100 declined 0.39%. That is genuine information about the buyer base, and it is the first clean read available since the June listing, because until today the float was too small for price to say anything reliable about depth. The case for restraint is equally strong and rests on arithmetic rather than sentiment. Today released the first tranche, not the last: another 319 million shares come free in six days, further tranches follow in September and October, and more than 4 billion shares — several times today’s release — become tradable by year-end. A float that absorbs 911.5 million shares in one session tells you relatively little about absorbing four times that over five months, particularly with the stock still roughly half its June peak and every pre-IPO holder above water only if they entered early. The structural fact underneath is that this is a company spending $18.4 billion a quarter against $7.81 billion of quarterly revenue, which means the equity is the funding instrument and dilution pressure is a permanent feature rather than a calendar event. Today’s reversal is a real and encouraging signal about depth of demand. It is not a resolution of the supply overhang, and treating it as one would be reading a single session as though it settled a question that runs to June 2027.
What to watch:The August 12 unlock of 319 million shares — a second absorption without a new low would establish that today was depth rather than a squeeze. Watch whether the stock can reclaim the $135 IPO price, which is the level at which the remaining locked holders shift from underwater to profitable and the supply calculus changes.
BULLISH
5. New York Fed’s Williams Rejects the AI-Bubble Framing — “I Don’t See This as a Bubble Kind of Situation” — and Technology Steadies After Yesterday’s Rout
The core facts:New York Federal Reserve President John Williams told Reuters that he does not view current artificial-intelligence valuations as a bubble, describing the environment instead as “a very high level of excitement, enthusiasm around new technology, around AI.” On financial stability specifically, Williams acknowledged that borrowing to fund AI infrastructure has risen but said it is being carried by companies with high earnings, adding that he is “not as worried about the financial stability from the leverage right now.” He did concede that investors are still trying to size the eventual benefits of AI and that the unresolved question will itself generate volatility. Williams is a permanent voter on the Federal Open Market Committee and vice chair of the committee by virtue of his position. The remarks landed the session after the AI-infrastructure complex sold off broadly on capital-intensity concerns. Technology closed marginally higher at +0.03%, and Microsoft rose 2.54% to $499.86, the second-largest mega-cap gainer.
Why it matters:Yesterday this report documented the market beginning to discriminate between AI revenue and the capital required to produce it, with the selling reaching names that had no reporting event of their own — Lam Research and Palantir each fell on no company-specific catalyst — and argued that a theme re-rating is more durable than a single disappointing print. The most senior Federal Reserve official with a permanent vote has now addressed that exact question in public and come down on the other side, and the specific ground he chose is the one that matters. Williams did not argue that valuations are justified; he argued that the leverage funding the buildout sits on balance sheets that generate the earnings to carry it. That is a financial-stability judgement rather than a valuation judgement, and it is the judgement that determines whether an AI de-rating stays contained in equity multiples or transmits into credit. A repricing that stays in the equity market costs investors money; one that reaches the credit channel costs the economy growth. Williams is saying the second transmission is not currently live. This carries genuine weight for two reasons beyond his seniority. Central bankers have institutional incentives to warn rather than reassure — the asymmetry of being wrong runs heavily against complacency — so an explicit refusal to call a bubble from a sitting vice chair is a costlier statement than the reverse would be. And the tape corroborated it: Technology closed marginally positive after yesterday’s decline, and Microsoft added 2.54% while the broad market fell. The important limitation is that Williams himself flagged it. He conceded the benefit side of the AI equation remains unsized and said that uncertainty will generate volatility, which is a warning about the path even while offering comfort about the system. An assurance that the leverage is survivable is not an assurance that the multiples are.
What to watch:Whether other Federal Reserve officials echo or contradict the framing in coming speeches — a divergence between the New York Fed and the Board on AI financial stability would be the more market-relevant development. Watch investment-grade spreads for the technology and utility issuers funding data-centre construction, which is the channel Williams is implicitly saying remains healthy.
— Quantifying recession risk so you don’t have to guess. Apply for membership at join.recessionalert.comD. MODERATE-IMPACT STORIES -> TOP
UNCERTAIN
6. The Dow Falls Five Times as Hard as the S&P and the Transports Fail to Confirm — a Dow Theory Non-Confirmation Reopens Two Sessions After It Closed
The core facts:The Dow Jones Industrial Average fell 0.85% to 53,885.16 while the S&P 500 declined only 0.18% to 7,709.98 — a gap of nearly five to one. The NYSE Composite, the broadest available gauge, fell just 0.12% to 24,484.06, outperforming both. The Nasdaq 100 declined 0.39% to 29,373.33 and the Russell 2000 0.57% to 3,001.85. The Dow Jones Transportation Average fell 153.20 points, or 0.71%, to 21,424.10. The Industrials now sit within 2% of a ten-session high while the Transports remain more than 5% below their own, a divergence that reopens the Dow Theory non-confirmation this report tracked through late last week and which appeared to resolve on Tuesday. Only two of eleven S&P sectors advanced. The VIX fell 4.24% to 15.14.
Why it matters:Yesterday this report described the mirror image of today’s tape — a Dow record on a session when every other major average fell — and argued that the price-weighted index was capturing a rotation into pharmaceutical earnings that the cap-weighted index was not. Today the arithmetic ran the other way and confirms the underlying point: this index divergence is compositional, not directional. Goldman Sachs trades above $1,000 a share and Citigroup fell 2.78%; in a price-weighted construction two bank declines of that size do more damage than the S&P’s entire financial sector weighting would suggest. Strip the banks and the Dow’s 464-point decline is largely absent. The genuinely useful signal is the NYSE Composite, which fell only 0.12% and outperformed both headline gauges for a second consecutive session. The average stock is holding up materially better than the blue-chip averages, which means the selling is concentrated in specific large weights rather than distributed across the market — a narrow decline is a very different thing from a broad one. What keeps this uncertain is the transport reading, which cuts the other way and does so on inconvenient evidence. This report argued last week that the Transports were constrained by expected fuel costs rather than freight demand, and that a sustained crude decline would resolve the divergence. Crude has now reversed hard — WTI up 3.60% today — and the Transports fell again, which is at least consistent with the fuel-cost thesis. But the non-confirmation has now opened, closed and reopened inside four sessions, and a signal that oscillates that quickly is describing noise rather than a trend. Dow Theory is a multi-week framework and reading single sessions through it risks exactly the over-interpretation that made Tuesday’s resolution look convincing before it failed.
What to watch:Whether the NYSE Composite continues to outperform the S&P 500 — a third and fourth consecutive session would confirm the decline is genuinely narrow rather than a two-day artefact. Watch the Transports for a close above their ten-session high while crude stays above $77, which would decisively break the fuel-cost explanation.
UNCERTAIN
7. Dell Gives Back 5.41% and Arista 2.53% While Microsoft Adds 2.54% — the AI Trade Sorts Itself by Balance Sheet Rather Than by Theme
The core facts:Dell Technologies fell 5.41% to $437.65, the largest mega-cap decline of the session, unwinding part of a near-9% single-session surge on August 4 that had carried it close to its 52-week high. Dell has no scheduled earnings catalyst until August 27. Arista Networks fell 2.53% to $192.32 after a five-consecutive-session rally of roughly 25% — adding some $50 billion of market capitalisation — to an all-time closing high of $197.31 on August 5, driven by second-quarter revenue growth of 37.7% and raised 2026 guidance on AI and data-centre demand. Neither decline had a company-specific catalyst. Against them, Microsoft rose 2.54% to $499.86, extending its post-earnings advance on Azure revenue growth of 43% year over year reported August 3. Technology as a sector closed marginally higher at +0.03%, and the Nasdaq 100 fell 0.39%.
Why it matters:Yesterday this report characterised the AI selloff as a discrimination event rather than a capitulation, noting that NVIDIA rose 3.43% against a falling complex and reading that as rotation toward the one name whose margin structure was not in question. Today provides a second observation on the same axis and it lands the same way. The two names that fell hardest are the two that had run furthest on the least differentiated economics: Dell assembles AI servers at hardware margins, and Arista sells networking equipment into the same buildout, and both had gone nearly vertical into the decline — 9% in a session and 25% in five sessions respectively. The name that rose is the one that owns the customer relationship and books the revenue as recurring cloud consumption. That is not a market exiting AI; it is a market re-sorting AI exposure by where the durable economics sit. The reason this reads uncertain rather than constructive is that the same pattern is equally consistent with a much more mundane explanation, and the honest reading has to hold both. Dell and Arista rose 9% and 25% in a handful of sessions on no earnings event of their own in Dell’s case; giving part of that back is what parabolic moves do regardless of what the market believes about business models. Profit-taking after a vertical run and a considered re-rating of capital intensity produce identical tape, and a single session cannot separate them. Two facts argue mildly for the more benign reading. Technology closed positive on the session, which is inconsistent with a sector-wide de-rating. And Arista’s underlying results were strong enough to support a third guidance raise this year, meaning the fundamental case did not deteriorate — only the price did.
What to watch:Whether the hardware names stabilise while the hyperscalers hold their gains, which would confirm a quality rotation inside AI rather than a broad unwind. Watch Applied Materials’ report on August 13 for the first clean read on whether semiconductor capital equipment orders reflect the spending the hyperscalers have guided to.
UNCERTAIN
8. European Gas Jumps 5.87% While Henry Hub Falls 1.93% on a Heavy Storage Build — the Transatlantic Gas Market Splits in Two
The core facts:Dutch TTF, the European gas benchmark, rose 5.87% to an estimated $18.79 per MMBtu while US Henry Hub fell 1.93% to $2.64 — a sharp decoupling on the same session that crude rallied more than 3.6%. The US decline followed the Energy Information Administration reporting a net injection of 33 billion cubic feet for the week ended July 31, against a consensus of 31 Bcf and a prior week of 28 Bcf. Working gas in storage stands at 3,117 Bcf, 12 Bcf below year-ago levels but 195 Bcf, or 6.7%, above the five-year average of 2,922 Bcf. NYMEX gas futures fell at midday as the heavy build weighed on sentiment. European gas moved on its own supply and geopolitical dynamic, distinct from both the crude rally and the US complex. Utilities were the fourth-weakest S&P sector at -0.48%.
Why it matters:A 7.8-percentage-point spread between the European and US gas benchmarks on a single session is unusual and it isolates something the crude rally obscures. Oil is a global market where a chokepoint disruption transmits to every consumer simultaneously, which is why Brent and WTI both rallied hard today. Gas is not — it is a regional market bridged only by liquefaction capacity, and that bridge is fixed in the short run. Today’s split says the supply anxiety driving crude is landing on Europe specifically rather than on the industrial world generally, and that US gas is being governed by its own inventory picture rather than by the geopolitics. For a US portfolio the direct read is favourable and worth stating plainly: American industrial and power-generation input costs fell today while European equivalents rose nearly 6%. That is a competitiveness transfer, and with US storage 6.7% above the five-year average it has an inventory foundation rather than resting on a single weekly print. The second-order read is where the caution belongs. Cheap domestic gas alongside expensive European gas widens the arbitrage that pulls US molecules toward export terminals, and sustained wide spreads are precisely what draws down the domestic surplus over subsequent months. The mechanism is slow — it works through cargo scheduling and terminal utilisation rather than through the weekly storage report — which is why today’s divergence is a signal about the next quarter rather than the next week. The other constraint on reading this too positively is that a build running above both consensus and the prior week can reflect weak demand as easily as strong supply, and a 33 Bcf injection in the hottest part of the cooling season is not obviously a demand endorsement.
What to watch:Whether the TTF-Henry Hub spread holds above current levels for several sessions, which would begin pulling US cargoes toward export and eroding the domestic storage surplus. Watch next week’s EIA storage report for a second above-consensus injection, which would confirm the surplus is building rather than reflecting one week’s weather.
BEARISH
9. Carney Calls Canada’s Tone “Quite Firm” With Thirteen Days to the Section 338 Deadline — and Washington Floats Interim USMCA Arrangements
The core facts:Canadian Prime Minister Mark Carney said his government’s posture toward Washington is already “quite firm” while describing negotiations as “constructive,” with 50% Section 338 tariffs on a wide range of Canadian goods — signed July 20 and effective August 19 — now thirteen days away. The three proclamations respond to provincial bans on US alcohol, a dairy quota-eligibility rule and Canada’s surtax on US-made cars, and carry no exemption for USMCA-originating goods, the statute’s first invocation since the 1940s. Energy, potash, Section 232 goods, fish and critical minerals are carved out. The measures raise Canada’s average US tariff to 6.27%, covering roughly $20 billion across 554 tariff lines, and run alongside a 35% Canada tariff already effective August 1. Separately, US Trade Representative Jamieson Greer told a Senate committee he hopes to present options for potential interim arrangements on USMCA to President Trump, President Sheinbaum and Prime Minister Carney before year-end; Greer was in Mexico City this week for bilateral talks. USMCA was not renewed at the July 1 joint review.
Why it matters:The market has largely stopped pricing tariff headlines and on most days that habit is defensible, because most tariff news is announcement rather than implementation. This is the opposite case: the proclamations are signed, the date is fixed, the carve-outs are defined, and the only remaining variable is whether negotiation removes them in the next thirteen days. Carney’s language is the fresh information and it points the wrong way. A leader describing his own position as already firm two weeks before a deadline is signalling that the concessions required to avert the tariffs have been identified and declined, not that a deal is forming. The specific structural feature that makes this more consequential than the headline rate is the absence of a USMCA carve-out. A 50% duty that applies without regard to origin rules removes the principal mechanism by which North American manufacturers have organised cross-border supply chains for three decades — the certainty that regionally-sourced content moves duty-free. Firms cannot re-source around a rule that ignores sourcing. That is why a $20 billion trade-flow number understates the disruption: the affected volume is small, but the planning assumption it invalidates is not. Greer’s testimony is the genuinely two-sided element and deserves weight. An administration exploring interim USMCA arrangements before year-end is an administration that recognises the current arrangement is unstable, and interim mechanisms are how these disputes typically de-escalate. But the timelines do not meet. Greer is describing something for before year-end; Section 338 bites on August 19. Whatever relief the USMCA track eventually produces arrives months after the tariffs have already changed behaviour, and cross-border capital commitments made in the interim will have been made under the harsher regime.
What to watch:Any announcement before August 19 that Canada has withdrawn the provincial alcohol bans, the dairy quota rule or the auto surtax — those three specific actions are the stated trigger, and reversing them is the only fast path to suspension. Watch North American auto and rail names for the first clean read on whether the market believes the deadline holds.
UNCERTAIN
10. Five Downgrades for Insulet and Six for HubSpot — the Analyst Tape Turns on Enterprise Software and Med-Tech While Healthcare and Financials Get Upgraded
The core facts:A broad set of ratings changes landed. Upgrades: Argus raised Bristol Myers Squibb to Buy with a $75 target on turnaround signs as growth products and new launches lift margins — the firm’s second upgrade of the name in two sessions; Morgan Stanley raised Humana to Equal Weight and lifted its target to $370 from $249; JPMorgan raised Charles River to Overweight; Wolfe Research raised Global Payments to Outperform; Argus raised Roper to Buy; TD Cowen raised TPG to Buy. Downgrades: Jefferies cut Best Buy to Hold, target $85 from $89, citing a “clear downshift” in July consumer purchase intentions; Stifel cut TransDigm to Hold, $1,405 from $1,525; Citi cut Burlington to Neutral at $380; UBS cut FIS to Neutral, $49 from $63, on reduced 2026 revenue and profitability guidance; Insulet was hit with five separate downgrades, HubSpot with six, Zillow with two, and Summit Insights cut Western Digital to Hold. Consumer Cyclical closed down 0.60% and Healthcare up 0.21%.
Why it matters:The individual calls matter less than the clustering, and today’s clustering has moved. Yesterday’s tape concentrated its downgrades in discretionary retail and auto suppliers, and this report read that as a coherent sell-side judgement on goods demand. Retail is still there — Best Buy and Burlington were cut again — but the weight has shifted to two groups that were not part of yesterday’s pattern: enterprise software and medical devices. Five downgrades on one name and six on another in a single session is not a set of independent analytical judgements arriving by coincidence; it is the sell side responding to a disclosed event and revising in a herd. Those two names are where the day’s genuine information sits, and the read-through is that recurring-revenue software and device franchises are being marked down on growth durability at the same time the market is re-rating AI capital intensity. That is the same question asked of a different part of the technology stack. The Best Buy downgrade carries a datapoint worth extracting from the ratings framing entirely: a “clear downshift” in July consumer purchase intentions is a demand observation, and it corroborates the goods-demand weakness this report has now tracked from three independent directions across two sessions. The upgrades sit consistently on the other side of that line — Bristol Myers, Humana and Charles River are healthcare, and Global Payments and TPG are financials, none of which depend on discretionary goods volume. The standing limitation applies with full force and is why this reads uncertain. Ratings changes are lagging indicators presented as forward calls, and the Bristol Myers upgrade is the second on the same name in two sessions from the same firm, which tells you more about where the stock has been than where it is going. A cluster of five or six downgrades after a disclosure is the sell side catching up to a price move, not anticipating one.
What to watch:Whether enterprise-software downgrades broaden beyond single names into sector calls next week, which would mark the sell side moving from event response to a view on software growth durability. Watch retail commentary for corroboration of the July purchase-intention downshift Jefferies cited — that datapoint matters well beyond Best Buy.
— Separating signal from noise since 2007. Apply for membership at join.recessionalert.comE. ECONOMY WATCH -> TOP
Labor data reinforced resilience across the board: claims held below 200K for a third week, Q2 productivity rose 1.4% while unit labor costs rose just 1.3% versus a 2.1% estimate — a disinflationary combination — and Challenger’s July layoffs fell to a two-year low, though AI displacement remained the top cited cause for a fifth month. That strength sits against a Fed moving toward less predictability: Warsh is weighing cutting FOMC meetings from eight to six, a shift strategists warn concentrates rather than reduces volatility. Hughes Satellite’s Chapter 11 filing, tied to $1.5B in matured debt, underscores credit stress beneath the aggregate strength. Hard data argues against near-term recession risk; Fed communication policy is the wildcard to watch.
Q2 Productivity Rises 1.4%, Unit Labor Costs Miss at 1.3% vs. 2.1% Estimate (BLS, August 6, 2026)
What they’re saying:Nonfarm business sector productivity rose 1.4% in Q2 2026 (preliminary), reflecting a 2.7% increase in hourly compensation, while unit labor costs increased just 1.3% — well below the 2.1% consensus estimate. Year-over-year productivity is up 2.2%.
The context:The combination of accelerating output per hour and restrained cost growth is disinflationary at the margin, offering the Fed cover to view underlying cost pressures as contained even as headline inflation debates continue. Unit labor costs are historically volatile quarter to quarter, so the miss carries more signal alongside the claims and Challenger data below than in isolation.
What to watch:Q3 preliminary productivity data, due in early November, for confirmation the cost restraint is durable rather than a one-quarter print.
Initial Jobless Claims Hold Below 200K for Third Straight Week (Labor Department/Bloomberg, August 6, 2026)
What they’re saying:Initial claims for the week ended August 1 rose modestly to 199,000, below the 202,000 consensus and roughly in line with the prior week’s 198,000. The four-week moving average fell to 198,750, its lowest since September 2022. Continuing claims rose to 1.801 million, in line with estimates.
The context:The streak below the 200,000 threshold is the longest since 1969 and confirms layoffs remain historically rare even as hiring has cooled — reinforcing a “low-fire, low-hire” labor market rather than one at risk of a sharp downturn.
What to watch:Friday’s July nonfarm payrolls report, expected to show roughly 80,000 jobs added with the unemployment rate holding at 4.2%.
Challenger Job Cuts Fall to Two-Year Low in July, AI Leads Causes for Fifth Straight Month (Challenger, Gray & Christmas, August 6, 2026)
What they’re saying:Employers announced 33,429 job cuts in July, down 27% from June’s 45,849 and the lowest monthly total in two years. Year-to-date cuts of 477,033 are down 41% from the same period in 2025. AI was cited as the leading cause for a fifth consecutive month, accounting for 10,970 cuts, with technology (9,867 cuts) and financial services (3,157) the most-affected sectors.
The context:The sharp pullback in overall layoff announcements is a clear positive for aggregate labor demand, but the persistence of AI as the top-named driver signals the displacement pressure is structural rather than cyclical, concentrated in tech and white-collar roles even as headline volumes fall.
What to watch:August’s Challenger report, due early September, for whether the AI-cut share continues to climb as a proportion of total layoffs.
Fed’s Warsh Weighs Cutting FOMC Meetings From Eight to Six as Markets Brace for Volatility (CNBC, August 5, 2026)
What they’re saying:Chair Kevin Warsh raised the idea of reducing the Fed’s annual rate-setting meetings from eight to six during last week’s FOMC session, part of a broader push to scale back forward guidance and reduce market reliance on Fed signaling. Fixed-income strategists, including DWS’s George Catrambone, warned the change would concentrate volatility into fewer, higher-stakes decisions rather than reduce it.
The context:The proposal extends Warsh’s shift toward “strategic opacity” — shorter post-meeting statements and reduced dot-plot detail — a reversal of the transparency-focused era under his predecessor. Markets have historically priced in a steady cadence of Fed communication; fewer scheduled checkpoints raises the risk of outsized repricing around each remaining meeting.
What to watch:Any formal FOMC calendar announcement for 2027, and the MOVE index heading into the next scheduled meeting.
Hughes Satellite Systems Files Chapter 11 With $1.5 Billion in Matured Debt (GlobeNewswire/Via Satellite, August 3, 2026)
What they’re saying:Hughes Satellite Systems Corporation and several U.S. subsidiaries, including Hughes Network Systems, filed voluntary Chapter 11 petitions in the Southern District of Texas on August 3, citing approximately $1.5 billion in debt that matured August 1 and could not be repaid. The filing excludes Hughes’ international subsidiaries and has no impact on parent EchoStar’s other operations, including DISH TV, Sling TV, and Boost Mobile.
The context:The filing reflects a structural decline in consumer satellite broadband subscribers amid competition from low-earth-orbit providers like Starlink; management intends to reorganize around enterprise, government, and defense customers. At $1.5B, the liability size clears the systemic-relevance bar for Section E coverage even though the parent entity remains unaffected.
What to watch:Bankruptcy court proceedings and any read-through for EchoStar’s credit profile or the broader satellite broadband competitive landscape.
— Know the probability before the market prices in the risk. Apply for membership at join.recessionalert.comF. EARNINGS WATCH -> TOP
YESTERDAY AFTER THE BELL (Markets Reacted Today)
UNCERTAIN
11. Sandisk (SNDK): -10.26% | A 372% Revenue Quarter Undone by the Guide
The Numbers:Released: AMC August 5. Fiscal fourth-quarter revenue of $8.965 billion, up 372% year over year and roughly 6.5% ahead of consensus; non-GAAP EPS of $39.25, beating by approximately 13.5%. Non-GAAP gross margin reached 84.6% against 26.4% a year earlier. Data-centre revenue surged 103% sequentially to $2.98 billion on AI demand. The board authorised a $14 billion buyback. Current-quarter guidance came in below analyst expectations.
The Problem/Win:Nothing in the reported quarter was the problem. A 5,800 basis-point gross-margin expansion and a tripling of data-centre revenue in three months is an extraordinary operating result, and the $14 billion authorisation signals management confidence in the cash generation behind it. The stock fell because the forward guide did not extend the trajectory, and after a roughly 500% advance across 2026 the shares were priced for continued acceleration rather than continuation.
The Ripple:The entire US storage complex fell together. Western Digital dropped roughly 14% premarket before closing down about 11%, and the memory group traded lower as a bloc on the read-across that peak flash pricing is being guided rather than discovered. Summit Insights cut Western Digital to Hold on the back of it.
What It Means:Memory names have re-rated on the assumption that AI demand converts flash pricing into a structural rather than cyclical margin story; a soft guide against an 84.6% gross margin is the market testing that assumption for the first time. The operating result argues the cycle is intact — the multiple argues it was already fully paid for.
What to watch:Whether the 84.6% gross margin holds through the guided quarter, which is the single number that separates a structural repricing of flash from a cyclical peak. Watch Applied Materials on August 13 for whether memory capital-equipment orders corroborate the demand picture.
UNCERTAIN
12. Western Digital (WDC): -11% | Beat, Raised, Downgraded and Sold
The Numbers:Released: AMC August 5. Beat on both revenue and earnings per share, with margins expanding, and guided first-quarter fiscal 2027 above consensus. Summit Insights subsequently downgraded the shares to Hold.
The Problem/Win:A beat-and-raise that lost 11% is a positioning outcome rather than an operating one. The shares had advanced roughly 200% across 2026, and the guide delivered continuation where the price required acceleration. The company also underperformed peer Seagate on the comparison investors care most about, which converted a good quarter into a relative disappointment.
The Ripple:Western Digital and Sandisk together dragged the storage complex down as a group, with the decline reaching memory names that had no reporting event. The pairing matters: two companies beat, both raised or held guidance, and both fell double digits — that is the market repricing the group, not judging the companies.
What It Means:When beats and raises produce double-digit declines across an entire sub-sector, the constraint is valuation rather than fundamentals. Storage remains operationally strong; the question is what multiple a cyclical business earns when the cycle is acknowledged to be near its peak.
What to watch:Whether further sell-side downgrades follow Summit Insights, which would confirm the group is being de-rated rather than digesting a run. Watch the Seagate comparison next quarter — relative share is now the metric the market is grading.
BEARISH
13. AppLovin (APP): -19% | A One Percent Miss Costs a Fifth of the Market Cap
The Numbers:Released: AMC August 5. Revenue of $1.92 billion, up 53% year over year, missed consensus by roughly 1%. EPS of $3.76 fell well short of the $4.21 estimate. Third-quarter guidance came in approximately 0.6% below consensus. Piper Sandler cut the stock to Neutral and slashed its price target to $385 from $665; Wells Fargo cut to Equal Weight.
The Problem/Win:The revenue miss was one percent and the guidance shortfall six-tenths of a percent — magnitudes that would be immaterial for most companies. The earnings miss was the real damage, at roughly 11% below estimate, indicating cost growth outrunning a still-rapid 53% revenue expansion. Piper Sandler’s target cut of 42% in a single action is the more telling number: it is a wholesale revision of the forward multiple, not an adjustment to the model.
The Ripple:This was the largest single-name rating-driven drawdown of the session. The read-across runs to high-multiple advertising-technology and platform names where growth is priced as an entitlement — a 53% grower losing a fifth of its value on a marginal miss recalibrates what a miss costs across that cohort.
What It Means:The asymmetry is the lesson. When a stock is priced for flawless execution, the downside from a rounding-error miss is not proportional to the miss — it is proportional to the multiple. That arithmetic applies well beyond this name.
What to watch:Whether the EPS shortfall reflects one-off cost timing or a durable margin compression — the third-quarter print is the resolution. Watch whether other high-multiple ad-tech names de-rate in sympathy over the coming week.
BULLISH
14. McKesson (MCK): AH: n/a | Beat and Raised Full-Year Guidance
The Numbers:Released: AMC August 5. Non-GAAP EPS of $9.93 beat consensus by $0.39. Full-year fiscal 2027 EPS guidance was raised to $44.20-$45.00. A verified regular-session price move for August 6 was not available at the time of writing.
The Problem/Win:A clean beat paired with a raised full-year outlook is the least ambiguous result in this section. Pharmaceutical distribution is a high-volume, thin-margin business where earnings leverage comes from mix and cost control rather than from pricing, so a guidance raise of this kind reflects operating execution rather than a favourable market backdrop.
The Ripple:Healthcare was one of only two S&P sectors to advance today, up 0.21%, and the ratings tape reinforced the same direction with upgrades to Bristol Myers Squibb, Humana and Charles River. Distribution results feed the read on prescription volumes and specialty drug mix across the sector.
What It Means:Distributors are a defensive earnings stream with visible volume drivers, and a raised full-year guide from one of the largest is a constructive signal for the healthcare complex at a moment when goods-facing sectors are being marked down.
What to watch:Whether the specialty and oncology distribution mix that drove the raise holds through the fiscal year, which is where the incremental margin sits. Watch peer distributors for confirmation that the volume trend is industry-wide rather than share gain.
TODAY BEFORE THE BELL (Markets Already Reacted)
BULLISH
15. ConocoPhillips (COP): +1.50% | A Permian Record on the Day Crude Rallied 3.6%
The Numbers:Released: BMO. Adjusted EPS of $3.24 beat the $2.90 estimate by 11.69%; revenue of $19.52 billion beat $18.79 billion by 3.91%. GAAP earnings of $3.9 billion, or $3.23 per share, against $2.0 billion and $1.56 a year earlier. Production reached 2.248 million barrels of oil equivalent per day, above the high end of guidance, with the Permian Basin setting a company record above 900,000 BOE/d. Total realised price was $62.33 per BOE, up 36% year over year. Cash from operations was $7.2 billion. Shareholder distributions totalled $3.0 billion, comprising $2.0 billion of buybacks and $1.0 billion of dividends. Third-quarter production is guided to 2.29-2.32 million BOE/d, with all full-year guidance items unchanged.
The Problem/Win:The win is the combination rather than either component. Production above the top of guidance with a company-record Permian quarter demonstrates that volume growth is being delivered on plan, while a 36% increase in realised price per barrel shows the macro is amplifying it. That pairing is what doubled earnings year over year, and the sequential guide of 2.29-2.32 million BOE/d points to further volume growth ahead.
The Ripple:Energy was the only S&P sector to post a meaningful gain, up 1.56%, though the driver was the crude rally in Story 1 rather than this print. ExxonMobil added 2.12% and Chevron 1.51%, both outpacing ConocoPhillips’s own 1.50% — an unusual outcome for a company that beat on every line, and a sign the sector traded the barrel rather than the results.
What It Means:Delivering record volumes at unchanged full-year guidance while returning $3.0 billion in a quarter is the profile of a producer whose capital discipline survived the price recovery. If Hormuz keeps a risk premium in the barrel, that operating leverage is now attached to a materially higher strip than the plan assumed.
What to watch:Whether the Permian sustains production above 900,000 BOE/d next quarter, which is the number that determines whether the record was a peak or a new base. Watch whether full-year guidance is raised at the third-quarter print now that two consecutive quarters have exceeded it.
BULLISH
16. Parker-Hannifin (PH): +7.31% | Record Backlog and a Fiscal 2027 Guide Above Consensus
The Numbers:Released: BMO. Fiscal fourth-quarter adjusted EPS of $9.27 beat the $8.26 estimate by 12.17% and rose 21% year over year; GAAP EPS of $8.54 beat $7.23 by 18.14% and rose 19%. Revenue of $5.76 billion beat $5.57 billion by 3.25% and grew 9.8%. Full-year revenue rose 8.3% to a record $21.5 billion with net income up 3% to $3.6 billion, and segment operating margins expanded 150 basis points to 24.5%. Backlog reached a record $12.8 billion with increases across all segments; aerospace backlog alone stands at $8.5 billion. Fiscal 2027 EPS guidance was set at $34.25-$35.25 with aerospace revenue growth of 13.4%. The shares hit a 52-week high.
The Problem/Win:Record backlog is the number that carries the move. A $12.8 billion book with growth in every segment converts a good quarter into visible forward revenue, and the $8.5 billion aerospace component — two-thirds of the total — attaches that visibility to the industrial end-market with the longest order cycles and the least sensitivity to near-term GDP. The 150 basis-point full-year margin expansion says the backlog is being converted profitably rather than bought with price.
The Ripple:The result cuts directly against the session’s industrial tape. Industrials closed down 0.19%, Stifel downgraded TransDigm to Hold, and Honeywell’s aerospace unit fell sharply on a guidance cut — yet Parker-Hannifin rose 7.31% to a 52-week high on the strength of the same aerospace end-market. That divergence points to company-specific execution rather than a sector tide.
What It Means:Aerospace demand is not the problem for industrial names right now; converting it is. Parker-Hannifin is being rewarded for demonstrating that its backlog translates into margin, on a day peers were marked down for failing to do so.
What to watch:Whether the aerospace backlog keeps growing through fiscal 2027 or begins converting faster than it replenishes — the ratio of orders to shipments is the leading indicator. Watch the 13.4% aerospace revenue growth guide against peer results for whether this is share gain or market growth.
BULLISH
17. Howmet Aerospace (HWM): -0.58% | A Beat-and-Raise That Moved Nothing
The Numbers:Released: BMO. Revenue of $2.55 billion beat the $2.43 billion estimate by 4.91% and grew 24.1% year over year; EPS of $1.33 beat $1.24 by 6.84%. Operating margin expanded 250 basis points to 27.9%, adjusted EBITDA rose 39% to $817 million, operating cash flow rose 31% to $583 million and free cash flow jumped 39% to $479 million. Full-year 2026 EPS guidance was raised to $5.23-$5.31 against a $5.06 consensus, with revenue guided to $10.0-$10.1 billion on gas-turbine demand.
The Problem/Win:On the numbers this is the strongest result in the section: 24% revenue growth, 250 basis points of margin expansion and 39% free-cash-flow growth simultaneously, with guidance raised above consensus. The stock closed down 0.58%. That gap between result and reaction is the story — a beat-and-raise of this quality producing no move means the outcome was already in the price after a strong run into the print.
The Ripple:Read alongside Parker-Hannifin’s 7.31% gain, the two results confirm aerospace and gas-turbine demand as the genuine bright spot in an industrial sector that closed lower. The specific call-out of gas-turbine demand is a second-order read on power generation for data centres, connecting this print to the AI-infrastructure question running through Sections C and D.
What It Means:Operating momentum is not in doubt; the valuation already reflects it. For holders the raise protects the downside, but the flat reaction signals that further gains now require exceeding the newly raised bar rather than meeting it.
What to watch:Whether the 27.9% operating margin holds as revenue scales toward the $10.0-$10.1 billion guide — margin at that level is the whole investment case. Watch gas-turbine order commentary as a read on data-centre power procurement.
TODAY AFTER THE BELL (Markets React Tomorrow)
BULLISH
18. Cloudflare (NET): +15% AH | Beat and Raise Sends the Shares Sharply Higher After the Close
The Numbers:Released: AMC. Adjusted EPS of $0.29 beat the $0.27 estimate; revenue of $696.06 million beat the $664.67 million estimate by roughly 4.7%. Current-quarter guidance came in ahead of expectations and the company lifted its full-year forecasts for both revenue and earnings. Class A shares jumped approximately 15% in after-hours trading.
The Problem/Win:The win is that every layer moved in the same direction — a top-line beat, a bottom-line beat, forward guidance above consensus and raised full-year forecasts. That combination removes the ambiguity that punished Sandisk and Western Digital, where strong quarters met soft guides. Cloudflare delivered acceleration where the storage names delivered continuation.
The Ripple:This is the most direct available read on whether the software layer monetising AI capacity is being repriced alongside the hardware that builds it — the specific question this report flagged yesterday. The answer, at least for edge and network infrastructure, is no. It also cuts against the session’s enterprise-software ratings tape, where HubSpot absorbed six downgrades and FIS was cut at UBS.
What It Means:Software that sits between AI compute and the end user is still compounding, and is being valued on consumption growth rather than on capital intensity. That is the distinction now separating winners from losers inside the AI complex.
What to watch:Whether the 15% after-hours gain holds through tomorrow’s regular session — after-hours moves of this size frequently give back half. Watch whether other infrastructure-software names rally in sympathy, which would confirm a sub-sector re-rating rather than a single-name result.
WEEK AHEAD PREVIEW:
Q2 2026 earnings season is past the midpoint at 61% of the S&P 500 reported, and the heavy mega-cap calendar has now cleared. Friday, August 7 carries no reporters above $100 billion in market capitalisation — the largest names on the calendar are well below the threshold this section covers, so tomorrow is a genuine lull before the next cluster.
Vistra Corp (VST) — BMO, Friday August 7 — the largest reporter on tomorrow’s calendar at $47.7 billion, consensus $1.61 EPS on $5.46 billion of revenue. Independent power producers are the most direct listed read on data-centre electricity demand, the same theme Howmet flagged today through gas-turbine orders.
Take-Two Interactive (TTWO) — BMO, Friday August 7 — $43.5 billion market capitalisation, consensus $0.33 EPS on $1.36 billion of revenue. A discretionary-spending read at a moment when Jefferies has just flagged a downshift in July consumer purchase intentions.
PPL Corp (PPL) — BMO, Friday August 7 — $26.1 billion market capitalisation, consensus $0.34 EPS on $2.19 billion of revenue. Regulated utility results carry added weight with Utilities down 0.48% today and the sector the weakest performer over the past month.
Applied Materials (AMAT) — AMC, Thursday August 13 — the next confirmed mega-cap reporter, with the company having scheduled its fiscal third-quarter call for 4:30 p.m. ET that day. Key focus: wafer-fabrication equipment orders and memory capital spending, which is the cleanest available test of whether the storage guidance wobble at Sandisk and Western Digital reflects a cycle peak or a single soft quarter.
Reporters for the balance of the week of August 10 were not yet confirmed in the earnings calendar at the time of writing and will be carried forward as dates are verified.
— US market commentary trusted by family offices and institutions. Apply for membership at join.recessionalert.comG. WHAT’S NEXT -> TOP
UPCOMING RELEASES:
| Date | Event | Why It Matters |
|---|---|---|
| Fri, Aug 7 | Nonfarm Payrolls, July (expected +80K) | The single most consequential release of the week. A print near consensus corroborates the “low-fire, low-hire” reading built from three straight weeks of sub-200K claims and a two-year low in Challenger cuts. A material undershoot would put labour-market deterioration back in play just as energy is pushing inflation compensation higher — the configuration in which the Fed’s options narrow fastest. |
| Fri, Aug 7 | Unemployment Rate, July (expected 4.2%) | The stability check on the payroll headline. Holding at 4.2% would confirm cooled hiring is being absorbed without rising joblessness; a move to 4.3% or higher shifts the labour-market debate from normalisation to contraction and would reprice the front end sharply against today’s yield move. |
| Fri, Aug 7 | Average Hourly Earnings, July (expected +0.3% m/m, +3.5% y/y) | The monthly read on the same wage channel today’s unit labour cost miss addressed quarterly. Earnings growth at or below 3.5% year over year alongside 1.4% productivity keeps the domestic cost impulse consistent with target inflation, isolating energy as the sole source of upside pressure. |
| Fri, Aug 7 | Fed’s Barkin speaks | The first opportunity for another Federal Reserve official to respond to the split between soft labour costs and a 4.72% crude move. Markets will read for whether the committee treats an energy shock as a headline pass-through to look through or as a broadening inflation risk to lean against — the distinction that determines whether September hike odds resume falling. |
| Fri, Aug 7 | Consumer Inflation Expectations (expected 3.7%) | The measure most directly exposed to the crude rally, because gasoline prices dominate household inflation perceptions. A reading above 3.7% would suggest the Hormuz repricing is already reaching expectations rather than staying confined to futures markets — the transmission the Fed cares most about. |
| Fri, Aug 7 | Consumer Credit Change, June (expected $10.5B) | A direct test of the goods-demand weakness flagged in today’s ratings tape, where Jefferies cited a “clear downshift” in July consumer purchase intentions. Accelerating revolving credit alongside softening intentions would point to households borrowing to sustain spending rather than spending from income. |
KEY QUESTIONS:
1. If Friday’s payrolls confirm the low-fire, low-hire labour market, does the soft unit labour cost print reassert itself as the dominant input to the rate path — or does Brent above $83 keep inflation compensation, rather than policy expectations, in control of the curve?
2. Does the Iran-Oman process produce a routing agreement that applies to all flags, or only to designated corridors? The reopening the market had priced was a clean one; a negotiated reopening on restrictive terms is worth materially less, and today’s 4.72% move suggests very little of that distinction was in the price before this week.
3. With Section 338 tariffs on Canadian goods effective Wednesday, August 19 and no USMCA-origin carve-out, will Ottawa withdraw the provincial alcohol bans, dairy quota rule or auto surtax that triggered them — and if not, do North American auto and rail names begin pricing the deadline as real?
— US market commentary trusted by family offices and institutions. Apply for membership at join.recessionalert.comH. CHART OF THE DAY -> TOP
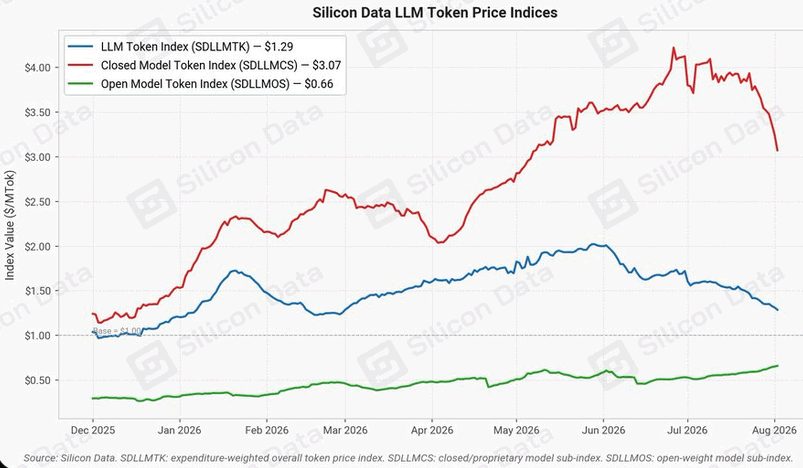
The blue line looks like a price. It is really a purchase order. Read it the obvious way and AI got 35% cheaper since June. But closed models are down only 27%, and open-weight prices sit at a record high. Almost nothing got cheaper. Buyers moved. Closed models carried about 78% of tokens in December. Today they carry 26%, and still take 62% of spend. Enterprises hit budget walls and routed routine work to open models. Inside that cheap tier, buyers keep trading up — small models, then large, then reasoning-grade. That is why open prices rise. The commodity tier gained pricing power. The frontier lost it. This line is not demand. Spend is price times volume, and volume is compounding. What broke instead is frontier pricing power. But the $700bn already spent depreciates whatever a token fetches. Volume must outrun a falling price. The model sellers own that risk. Watch the next frontier launch. A lower high means the premium was never a moat. It was a queue.
Market Intelligence Brief (MIB) Ver. 18.50
For professional investors only. Not investment advice.
© 2026 RecessionALERT.com

Comments are closed.