
For two years, our comprehensive U.S monthly Leading Index (USMLEI) has been deteriorating, more recently to worrisome levels, with exactly half of the 23 components now in recession territory:
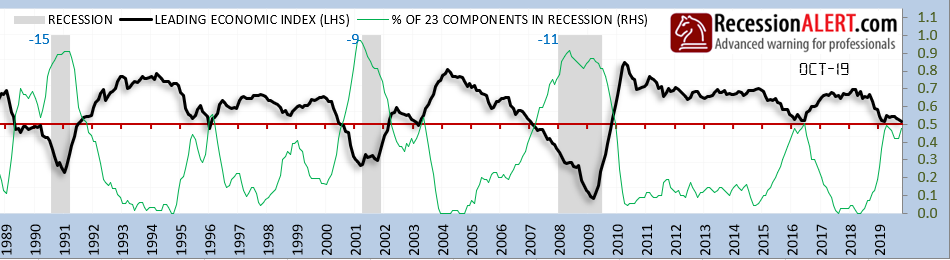
What was really alarming was that this was occurring against the background of elevated RAVI local stock market valuations, an inverted yield curve, a deteriorating Global LEI, a US housing market recession and a global trade recession.
We think the worst is likely over however. Notwithstanding a likely de-escalation in the US-China trade war and a massive $465Bn jump in liquidity via upcoming FED Open Market Repo Operations, all the other concerning factors bar valuations seemed to have turned corners.
Let us get to the elephant in the room first however – US stock market valuations. Our most accurate 1-year ahead forecast on the SP500 total return comes from the average annualized RAVI forecasts from the 1,2 and 3-year forecast models. This is forecasting muted short-run gains ahead for the SP-500:
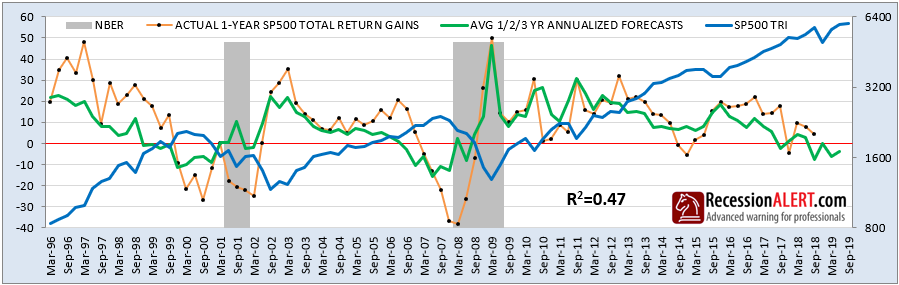
This is the only model remaining bearish – however if you look at the prelude to the last two recessions you can see that a r-squared of 0.47, whilst remarkable for such a short run indicator, does not preclude the actual outcomes from diverging from the forecast for 1-3 quarters. The Sept ’06 scenario is a case in point. But for now, we have to be prudent and acknowledge that the current RAVI valuation model is not supporting favorable US stock market outcomes in the year ahead.
Next up is the yield curve inversion, which has for all intents and purposes UN-inverted after a short 10-week stay below zero:
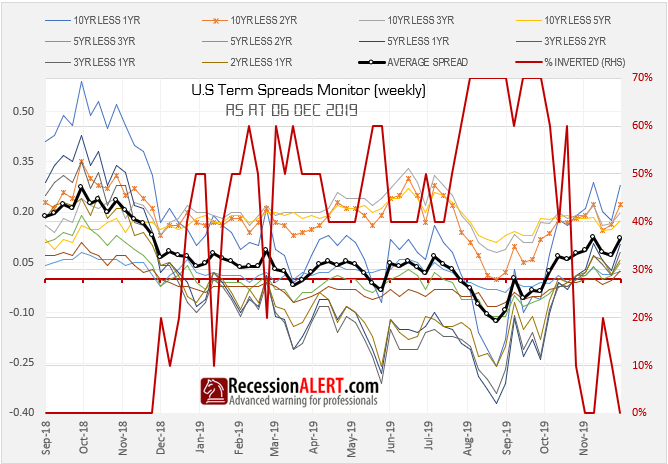
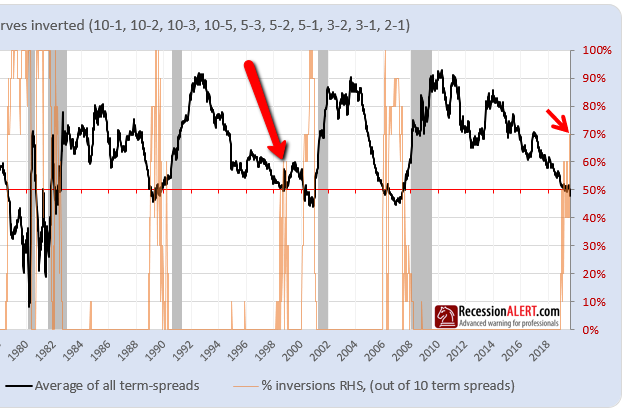
As we have stated several times in the recent past, we were never convinced at the completeness of this inversion since at most 70% of the term-spreads inverted and history has shown that 90-100% need to invert before we can be assured it is a proper recession signal. Most importantly, the 10’s LESS 2’s failed to invert at all. We remain behind the hypothesis that we could likely be witnessing a false (incomplete) inversion as witnessed in 1999 as depicted in the chart below:
Next up is the all important Global LEI, more specifically the percentage of OECD countries with rising LEI’s, which improved considerably in October:
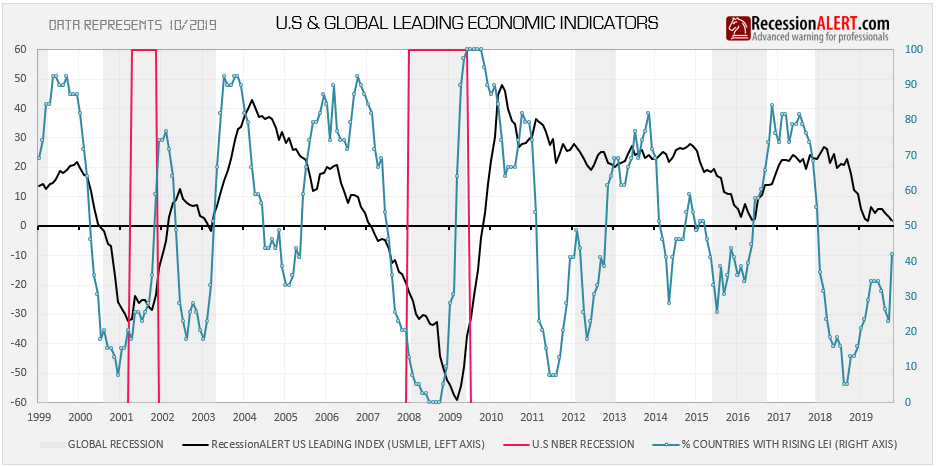
The hypothesis is that the direction of the blue line dictates the direction of the USMLEI and that the collective direction of LEI’s of countries outside the US can lead direction of the US leading data (see this note). We would be seeking a further improvement in the blue line for the month of November, potentially even a rise above 50% to signal a rebound in the leading US index.
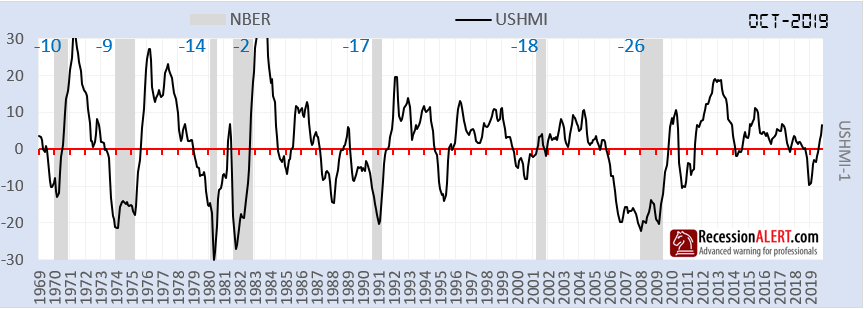
Next up is the US Housing market which has staged a sharp recovery from a short recession and is a long leading indicator for the US economy. The theory is that there is no better barometer on the health of the U.S. economy than residential housing. It’s an industry that encompasses many vital sectors of the economy such as banking, manufacturing, commodities, construction, durable goods, international trade, transportation and, of course, consumer spending:
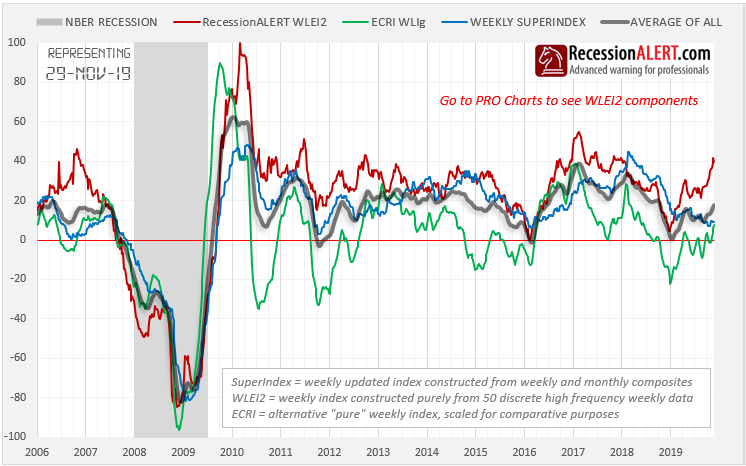
Finally, we can take some encouragement from the high-frequency leading data, where our Weekly Leading US index has been rising sharply of late – the theory being that this almost always leads to the Weekly Leading Super-index and Monthly Leading Index following suite:
There are very few guarantees in this business, just probabilities and likelihoods – and a betting man might conclude that things will be improving for the leading US economic data in the near future. There are a lot of tailwinds to support this theory at this juncture.
It is probably safer to be betting for the economy rather than against it right now.
Comments are closed.