
PART-1
There are currently 4 mainstream models used to forecast 10-year total returns on the SP-500 (dividends re-invested)
- The Shiller CAPE ratio (PE10)
- The Warren Buffet Indicator
- Tobin’s Q-Ratio
- Average Investor allocation to stocks
The non-linear quarterly correlations between these four models (x-axes) and achieved 10-year future total returns (y-axes) on the SP-500 since 1970 are shown below:
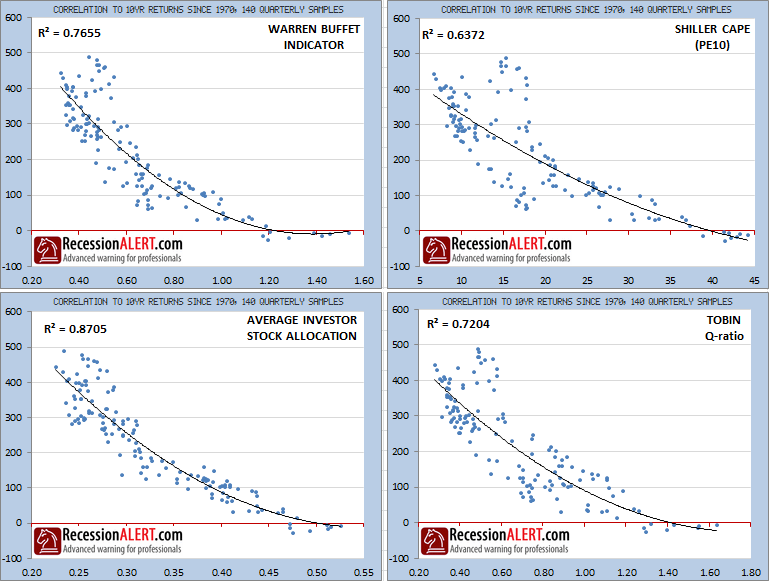
Whilst there have been successful variations that improve long-run 10-year return correlations slightly (such as John Hussmanns’ Peak Earnings version of the Shiller CAPE and Jeremy Siegel’s NIPA version of CAPE) these models form the main themes available for stock market valuation models.
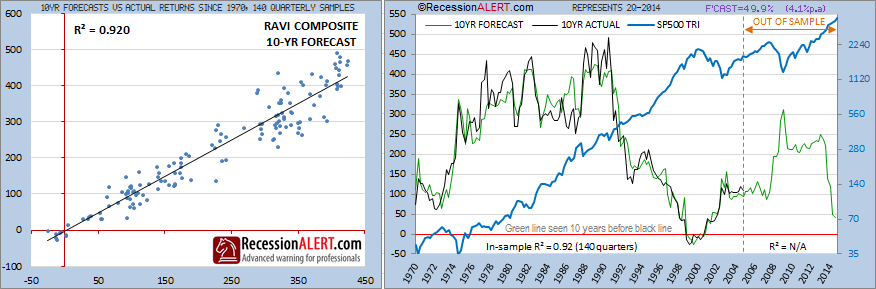
Whilst the above correlation examples run from 1970, there is much public literature showing the correlations hold (and even improve) all the way back to 1929. We have chosen 1970 as reference point since this is the point from which we have the most reliable SP500 Total Return data and from which we have built our own RecessionALERT Valuation Model (RAVI) which has the following correlation statistics:
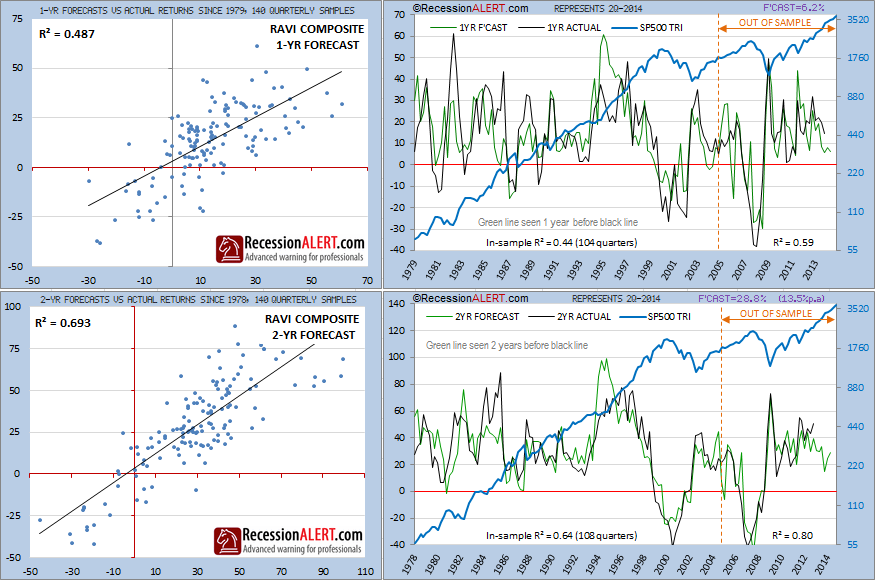
Whilst 10-year forecasted returns are somewhat useful for long-term market participants wishing to manage valuation risks, we have designed the RAVI to offer 1,2,3 and 5 year total return forecasts in addition to the 10-year forecasts. The longer the forecast horizon the tighter the correlations, but as we show below, even the 1 and 2 year forecast models provide useful informational content. It is also interesting to note that the out-of-sample forecasts have been improving over the last decade with an astonishing 0.8 r-squared for the 2-year look-ahead model since 2004:
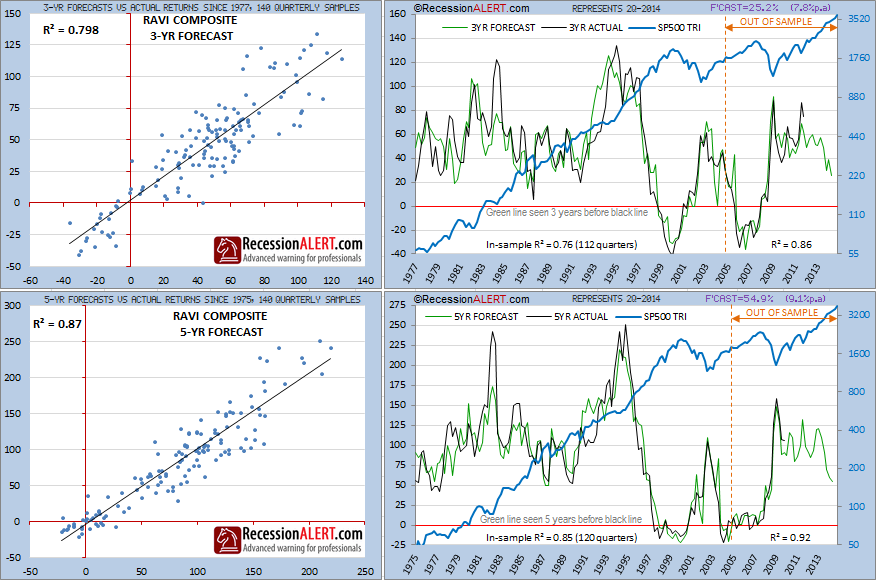
Correlations improve substantially when we examine the 3 and 5-year forecast horizons, and they too have been tightening out-of-sample:
Since the 1-year forecast “looks ahead” 4 quarters, we can average it by 4 quarters to attempt to obtain a “co-incident” view which warns of bear markets upon dipping below zero. We apply the same logic to the 8-quarter average of the 2-year forecast and the 12-quarter average of the 3-year forecast. Indeed, they all provide similar co-incident warnings of stock market corrections and 2-3 quarter warnings to recessions as displayed below. It is interesting to note that the rise of these “smoothed” indicators above zero also provide for good stock market re-entry signals.
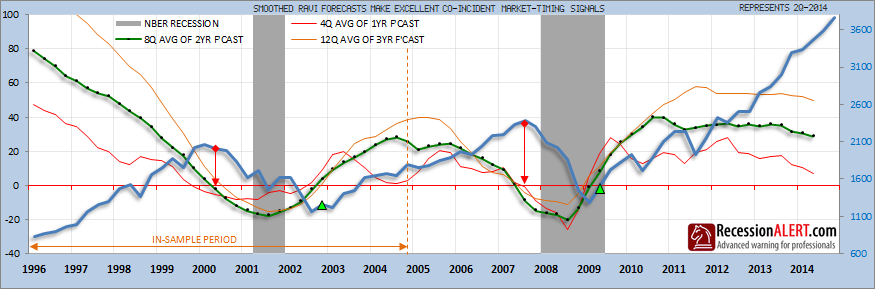
Of course it needs to be pointed out that the quarterly data displayed above is lagged by one quarter with regards to publication, reducing the timing benefits depicted above, but not detracting from its general usefulness. In addition, we have managed to extract monthly components from RAVI that correlate with an r-squared of 0.94 with the subsequent quarterly RAVI prints, reducing the effects of the quarterly data-publication lags.
It would be unwise to rely entirely upon this mechanism to attempt to gauge stock market risk and we recommend using it together with our existing Composite Market Health Index (CMHI) in the foreseeable future.
RecessionALERT subscribers can obtain quarterly updates of all the above charts in the CHARTS>MACRO>RAVI menu tab. The 1,2,3 and 5-year forecasts also appear on the CHARTS>HOME>DASHBOARD tab, to the top-right of the right-hand panel as shown below, where forecasts can be viewed in target (real-time upside remaining), annualized or absolute terms (just click on the tab you desire.)
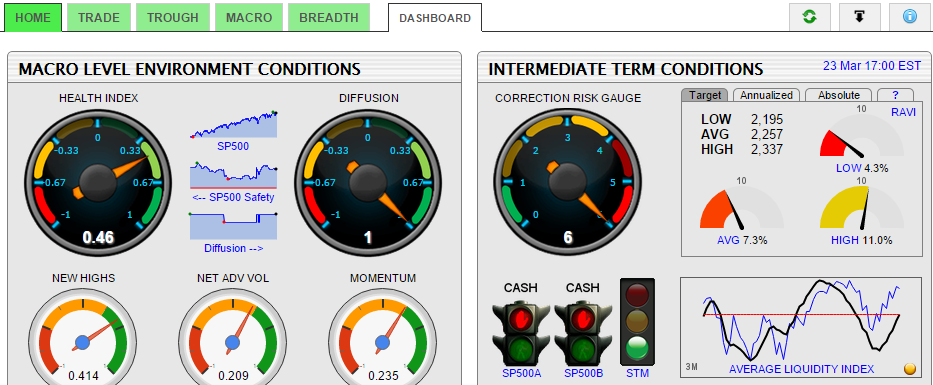
Clicking on the small tab with the “?” will display the RAVI Gauges User-Guide to assist you with interpretation of the various tabs.
PART-2
For more in-depth explanation on the mechanics of the RAVI methodology, please review the March 2016 BLOG posting “How can we forecast 30% upside for 2016 with RAVI?“
Excellent!