
According to many market watchers, there is no better barometer on the health of the U.S. economy than residential housing. It’s an industry that encompasses many vital sectors of the economy such as banking, manufacturing, commodities, construction, durable goods, international trade, transportation and, of course, consumer spending.
So it’s not surprising the Federal Reserve closely monitors housing trends in the course of setting monetary policy.Sound economic growth in the U.S. is not possible without a robust residential real-estate market and in fact 7 of the last 11 declines in the residential housing market has led to economic recession. Also with 11 U.S recessions since the end of World War II, all but two were preceded by a big decline in the residential housing market.
Even though housing does not account for all that much of the economy, its role in recessions is huge, because it is highly cyclical and sensitive to interest rates. Housing has never accounted for more than 7 percent of total US GDP, but it has on average accounted for about a quarter of the weakness in recessions since World War II, according to a 2007 paper by Mr. Leamer titled “Housing IS the Business Cycle.” In six of the last ten recessions, residential investment was the greatest contributor to weakness prior to the recession. Only twice of ten did residential investment not contribute significantly to weakness prior to the recession: the 1953 and 2001 oddballs.
After housing, the sector that has historically been second most important to recessions is consumer durables, or expensive purchases like cars, furniture and appliances. Those are often connected to the housing market’s prosperity because people usually buy other things when they purchase a home.
The most recent recession, from 2007 to 2009, offered one of the more exaggerated examples of housing’s guiding role in downturns. A recent report from the Federal Reserve Bank of St. Louis found that the residential construction sector accounted for a little over a third of the decline in output in the past recession, and about half of the job losses.
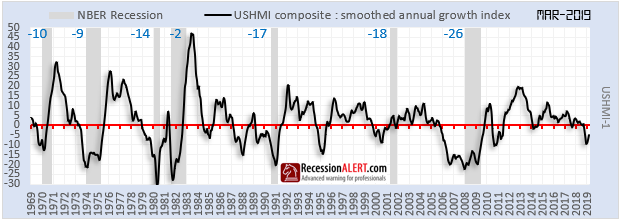
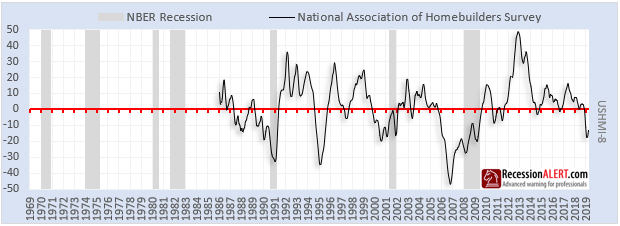
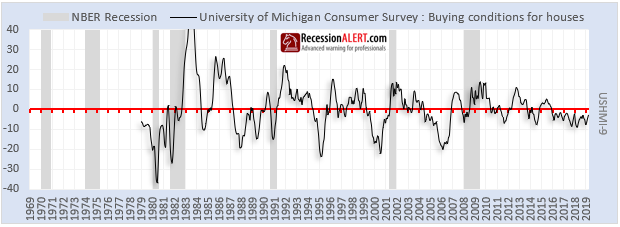
To ensure we remain focused on one of the most important predictors of US Recession, we have devised our own US Residential Housing Market Index (USHMI) as depicted below, which has an average lead of 12-14 months to economic recession:
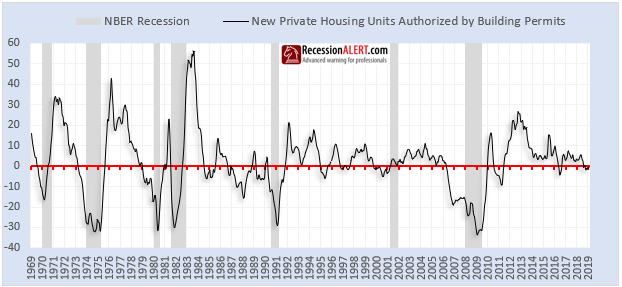
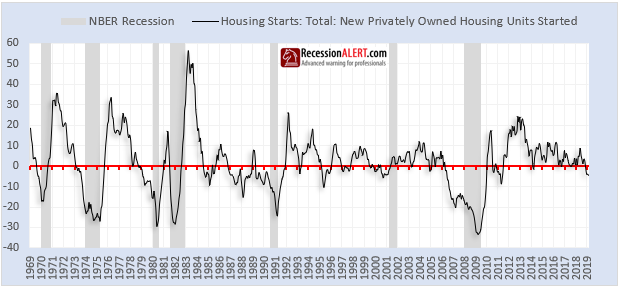
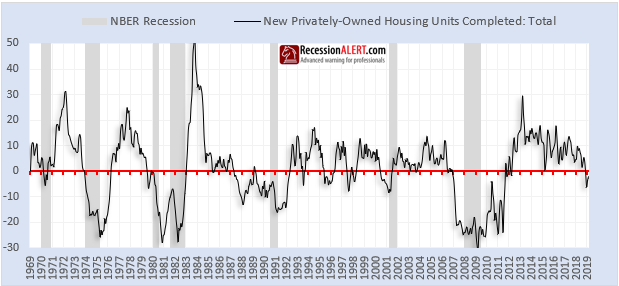
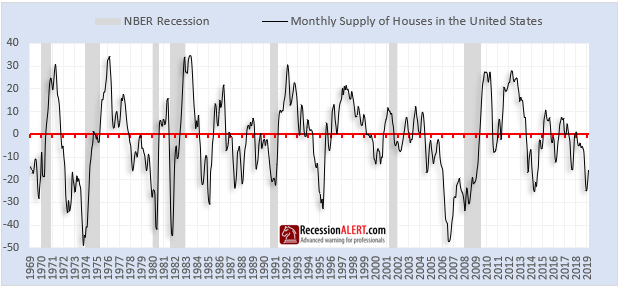
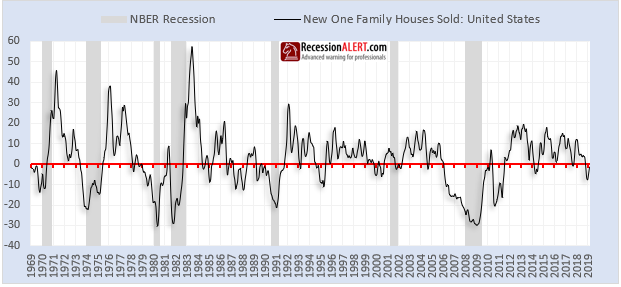
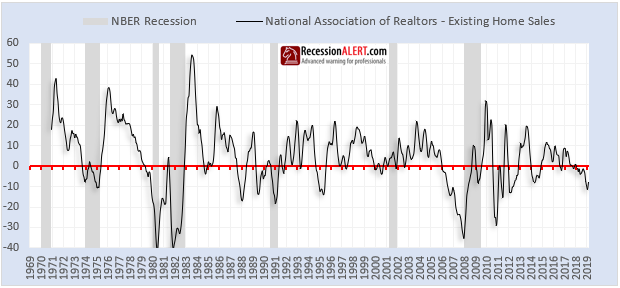
There are 8 components to the USHMI, which have an implied chronological order : Permits lead to Starts which lead to Completions which lead to sales supply which finally lead to new and existing home sales:
We also track the USHMI mainline (summation) index together with the diffusion showing what percentage of the eight components are in recession:
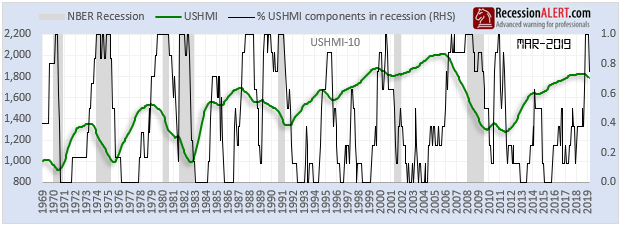
It is interesting to note from the mainline index that the residential housing market index only managed to recover about 75% of its losses since the 2008 Great Recession. This is of course in stark contrast to the lofty levels home prices find themselves in now. It is also clear that residential housing, as of this writing, has clearly peaked which of course significantly raises the odds of recession in 12-18 months time should the declines persists for another 2-3 months.
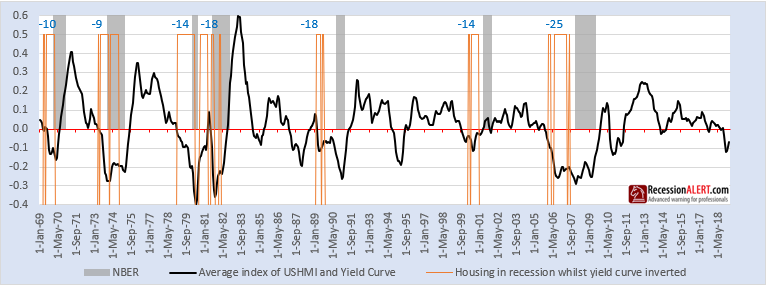
Apart from 3 false positives where a housing recession never led to an economic one, and a wider standard deviation of lead times, the USHMI is almost as good as the 10’s and 1’s yield curve in providing early warning of economic recession (average lead of 14 months vs. 16 months for yield curve), as the charts below demonstrate:
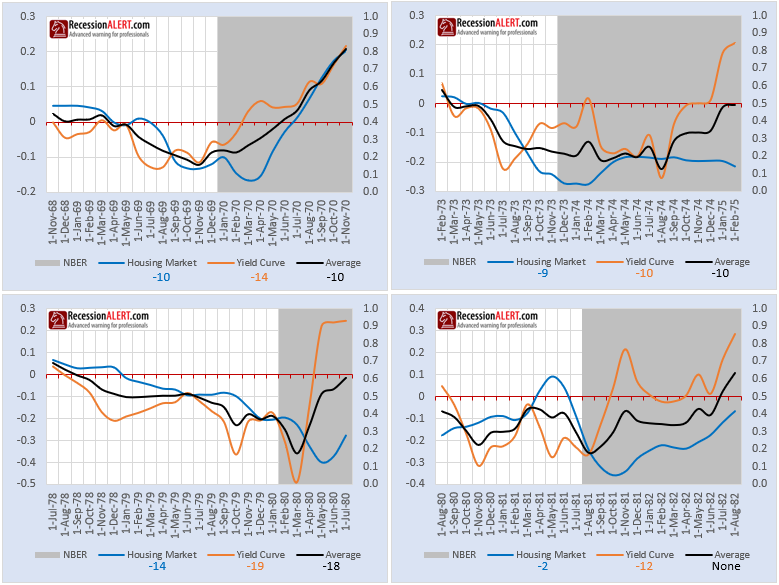
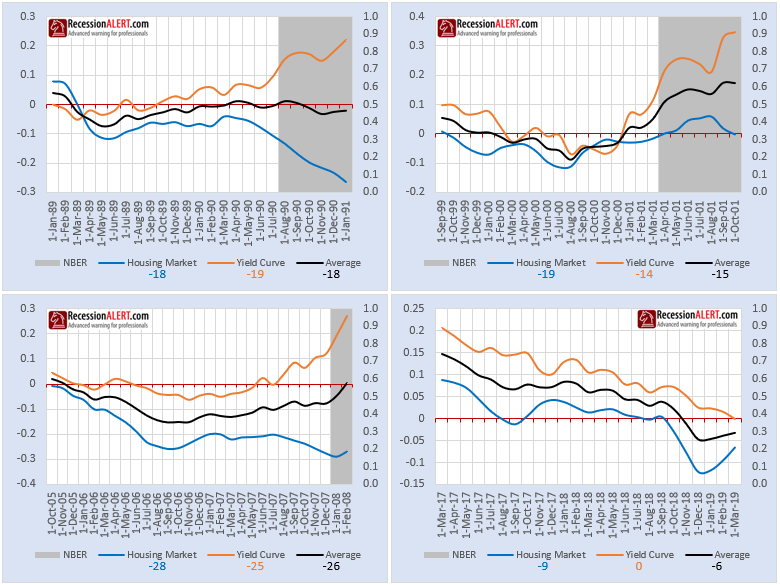
It appears the yield curve provided earlier warnings pre-1990 whereas the housing market seems to be providing earlier warnings post 1990. This suggests that using a combination of the two might be prudent. The last chart above shows the current situation, where the yield curve is sitting right on zero, on the cusp of an inversion.
Whilst one might be tempted to create a new, more diverse long leading index from the combination of the yield curve and the USHMI, it is actually more constructive to create a signal when both the housing market is in recession and the yield curve is inverted. The signal is shown below (orange line) together with the respective lead times (average 15 months) to economic recession. There are no false positives which is what makes this method a more attractive combination:
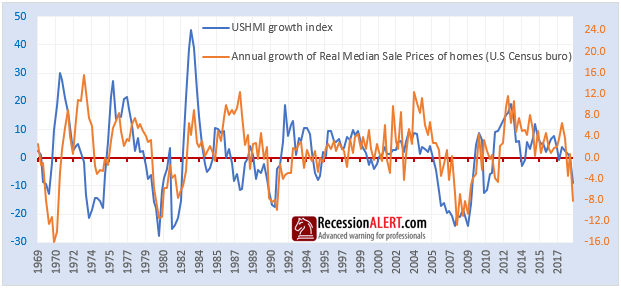
The USHMI is not just suited to gauging overall U.S economic health – it also generally leads real (after inflation) median sales prices of homes, which is of course of great interest to anyone that owns a house:
The USHMI report will be an addition to our standard monthly reports from now on.
Comments are closed.