
The global economy is currently in the depths of a synchronized global business-cycle contraction, first highlighted by us in June 2018. In March 2019 we followed up with Global Economic Activity slowing at the fastest pace since 2011.
The chart below highlights the Global Leading Economic Indicator together with the percentage of countries tracked that have a rising Leading Economic Indicator:

The percentage of countries with a rising LEI is an excellent 2nd-derivative, leading the global LEI consistently through the decades since 1967. The hopes last month that we were coming out the trough in a straight line were dashed when the blue line fell for the month of April and it is too early to call the business cycle LEI trough as yet.
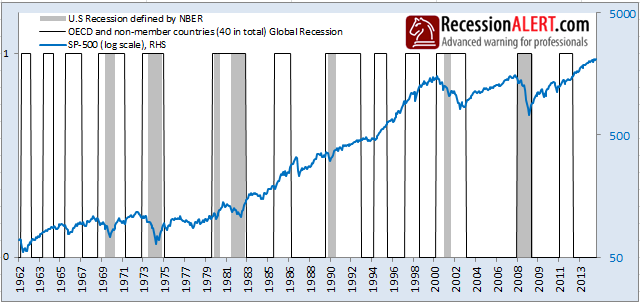
In a 2015 research note titled “Global slowdown, does it affect the U.S?” we showed that there was very little overlap between global recessions and U.S ones:
Does this mean U.S investors can ignore the economic woes of the rest of the world? Quite the contrary, we show that the Global LEI has a definite positive correlation with U.S Leading Economic Indicators and that it has a strong correlation on future expected U.S stock market returns.
1.Leading U.S Economic data
For leading U.S economic data we deploy our comprehensive U.S Monthly Leading Economic Indicator (USMLEI) as proxy and compare it to the Global LEI as shown below:

It becomes clear that the percentage of countries outside the U.S with rising LEI’s has a very close relationship with the US Leading Economic composite. Whilst a downturn in the global LEI can have a negative impact on the leading U.S data, it only pulled the leading U.S data into recession territory 7 times in 15 (just under 50% of the time.) In fact, when the USMLEI is vulnerable, a global downturn sucks the U.S into recession with the rest of the world. However if the U.S LEI is looking strong when a global downturn commences, the U.S manages to dodge a bullet. Also we note that on many occasions a trough in the global LEI can lead a trough in the US leading data by about 3 months.
The Global LEI is therefore useful to predict future direction of the US leading data, and indeed recessionary risk based on the vulnerability of the US leading data. The current global downturn, as signaled by the blue line above, commenced when the US leading data was strong and hence failed to pull the US into recession (so far at least.) The trough in the blue line led the trough in the USMLEI by 4 months.
2. U.S Stock market returns
Now for the surprising news to many – a global downturn/upturn precedes a U.S stock market downturn/upturn by about 4-6 months rather consistently, in fact more consistently than signals given by the US Leading Economic data.
For the Global LEI we stick with its leading derivative, the percentage of countries with rising LEI’s. For the U.S stock market we use the New York Stock Exchange (NYSE) as proxy:

The table above shows that just 22% of the NYSE consists of companies outside the US, whilst over 33% of the market-cap exists offshore. This might seem a very low offshore exposure but remember that plenty of the U.S listings on the NYSE generate hefty revenues and earnings outside the U.S as well. It stands to reason then, that gyrations of the global economy should have an impact on the NYSE Index. And indeed they do, as shown below:

This surprisingly strong correlation only really started in earnest since 2000 as shown below. It peaked at 0.58 since 2003 to 2008, then fell to 0.4 since 2012 but has been steadily rising since.

We can conclude that the Global Economy, more specifically the percentage of countries with rising LEI’s (the 2nd-derivative) – can be a good leading indicator for the NYSE. According to this theory, positive gains for the NYSE are forecast from April 2019 to October 2019, but this depends on the LEI 2nd-derivative maintaining its rise and the global LEI putting in a trough.
Comments are closed.