
Despite a steady rise in the SP-500 Index, clear and persistent financial stresses are starting to build up in the system. We construct a composite of the St. Louis Fed Financial Stress Index, the Cleveland Financial Stress Index, the Kansas City Financial Stress Index and the Chicago Fed National Financial Conditions Index as shown below:
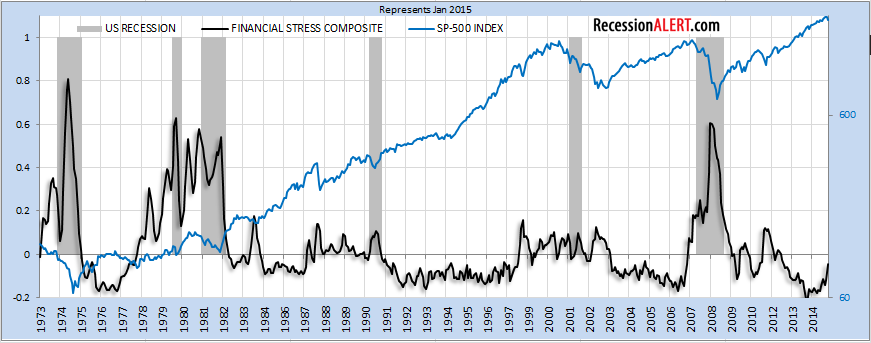
The average value of the composite, which begins in 1973, is designed to be zero. Thus, zero is viewed as representing normal financial market conditions. Values below zero suggest below-average financial market stress, while values above zero suggest above-average financial market stress. As a measure of financial stability, the composite exhibits two essential characteristics. Firstly, known periods of financial crisis correspond closely with peak periods of tightness in the composite, and secondly, the turning points of the composite coincide with well-known events in U.S. financial history. It is also useful to assess the current level of financial stress compared to the composites’ value during the past.
It is evident that the rise of the Financial Stress Composite above zero is a long-leading indicator for economic recession, but it also signifies a period of stock market volatility punctuated by frequent incidences of nasty stock market corrections. It is also clear that sustained periods when the Financial Stress Composite is below zero are mostly accompanied by low volatility U.S stock market “melt-ups”, with the recent 2012 to 2015 melt-up accompanied by historically low financial stress, being no exception.
It is probably premature to hit the panic button now. Also, a rise of the Financial Stress Composite above zero does not necessarily mean stock market gains are not possible, it just means that those gains are most likely going to come attached with considerable volatility, against a background of heightened risk for a non-trivial correction.
Of course, no stock market actions should be premised on readings of a single indicator alone (such as this one), and for this reason we should continue to examine readings on our Monthly Leading Economic Index, Long Leading Economic Index, Stock Market Health Composite, Recession Forecast Ensemble and our RecessionALERT Stock Market Valuation Index.
For the moment, the daily updated Stock Market Health Index available in your CHARTS menu is showing no cause for alarm, but most certainly looks like it is forming a top. The Diffusion is maxed-out with all six components in bull-market territory, but clearly technical price momentum, percentage of stocks in new long term rising trends, net advancing volume and weekly economic data have been fading for the last few months.
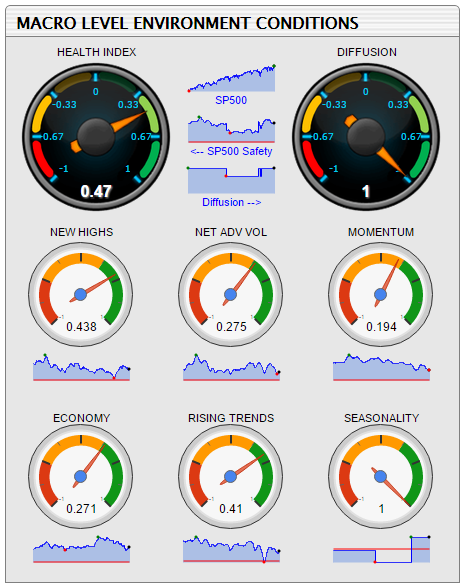
We are fortunate to have the tailwind of very benign seasonality at least until mid-April 2015, but it remains to be seen how all the remaining five stock market health components are going to be positioned to be able to endure the seasonality headwinds after this. If we find ourselves with five weak components and negative seasonality accompanied by an elevated Financial Stress Composite then serious consideration of some downside protection may be warranted. The timing of such protection measures could then be aided by the Fingerprints of a Market Top
NOTES:
The St. Louis Fed Financial Stress Index measures the degree of financial stress in the markets and is constructed from 18 weekly data series: seven interest rate series, six yield spreads and five other indicators. Each of these variables captures some aspect of financial stress.
The Cleveland Financial Stress Index is designed to track distress in the US financial system on a continuous basis giving the financial-system supervisors the ability to monitor stressful episodes as they are building in the economy. Such early detection is important because financial stress can quickly be amplified when stress is occurring in more than one market. The CFSI tracks stress in six types of markets: credit markets, equity markets, foreign exchange markets, funding markets (interbank markets), real estate markets, and securitization markets.
The Kansas City Financial Stress Index is a monthly measure of stress in the U.S. financial system based on 11 financial market variables.
The Chicago Fed National Financial Conditions Index measures over one hundred individual indicators for risk, liquidity and leverage in money markets, debt and equity markets and in the traditional and “shadow” banking systems.