
The SP-500 has rallied sharply since the 15th October bottom, recovering all her losses in a shorter time than it took to incur them. It was a very rare display of the opposite behavior to the norm where “the bull climbs the staircase and the bear comes down the elevator”, since in this case, the bear came down the elevator but the bull climbed up on a rocket. The question that now naturally arises is if this rally has gone too far too fast. In this technique note, we wish to point out the reliable signs of intermediate term market-tops to look out for to manage trading risk or a hedge strategy.
Firstly, if you are following the SP-500 Market Timing Strategy with the long entered on 17th October, you are encouraged to stick to the exit rules provided by this strategy and not be distracted by intermediate term top warnings. This strategy has a very specific objective to book 10-15% gains on the underlying SP-500 and it normally meets its objectives by tolerating a few draw-downs on the way. For now, we have surpassed the RATCHET stop meaning a healthy 6.3% of current gains are “locked in” providing us a suitable consolation prize even if our attempt at steeper gains should fail. You may of course opt to hedge these longs positions with some cheap put-options on escalating signs of an intermediate top. Let us discuss these escalating warning signs.
LEADING INDICATORS:
The first leading market-top warning signs you have already witnessed are the two short-term liquidity indexes from the Average Liquidity Index (ALIX). These are derived respectively from the McClellan Volume Oscillator and our HILO Breadth Index and both are now below zero warning of a top in the next 1-2 weeks. It is not uncommon for these warnings to be followed by even newer highs on the SP-500, although increased volatility is almost always an unavoidable by-product of these gains, such as witnessed by the previous market top in September that followed the classic playbook:
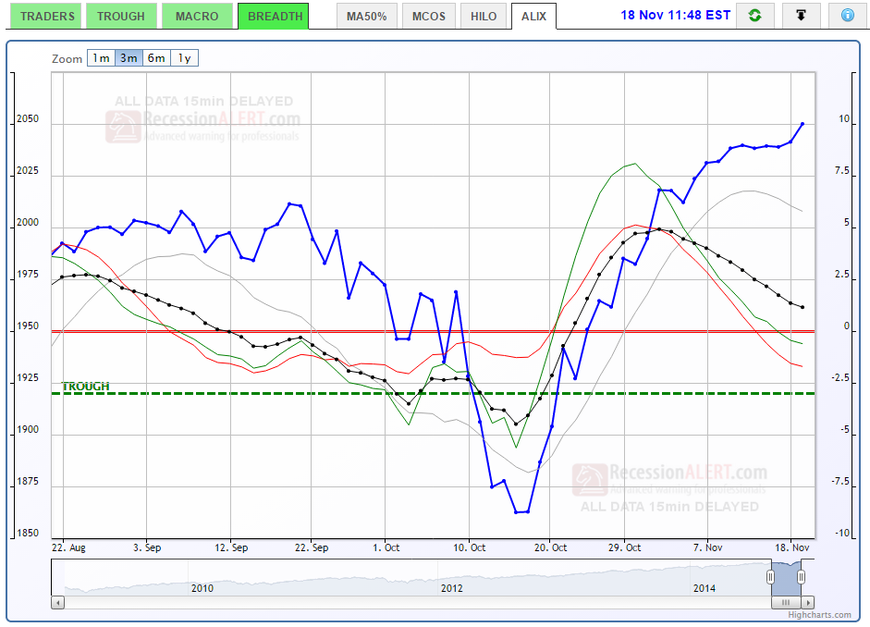
As we state in the information notes for ALIX (click the blue round “i” info button on top-right of chart to reveal this) it is probably best to wait for the ALIX composite (the black line with round dots on it) to drop below zero before considering protection strategies from a market top. This is likely to take at least another 3-7 trading days assuming breadth continues to deteriorate at current rates.You may well ask “How does the SP-500 manage to keep climbing on the back of declining short-term breadth indexes?” The answer lies in SELECTIVITY BEING IN PLAY. The SP-500 is being propped-up by fewer and fewer large-cap shares as short-term valuations become stretched and fewer bargains are to be had. This is of course a classic fingerprint of a market-topping process. The thin grey line in the chart, representing Medium Term Liquidity, or the third ALIX component, dropping below zero is a further escalation/confirmation of trouble to come, although some SP-500 index deterioration (not much) may already be underway by the time you witness this event. So to summarise, you get 4 warnings from ALIX, typically in the following sequence:
1. The Volume Oscillator Short-Term Liquidity Index falls below zero (red line)
2. The HILO Breadth Short-term Liquidity Index falls below zero (green line)
3. The ALIX composite falls below zero (thick black line)
4. The Medium-Term Liquidity Index falls below zero (grey line)
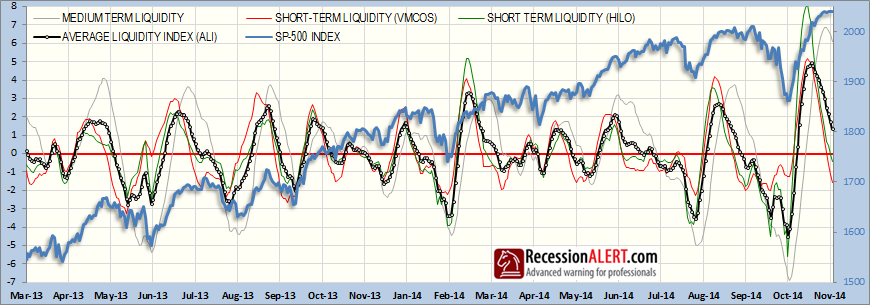
It is very rare not to see increased volatility and/or non-trivial stock market declines against the backdrop of all four these indexes being below zero, as depicted below:
SHORT-LEADING TO COINCIDENT INDICATOR
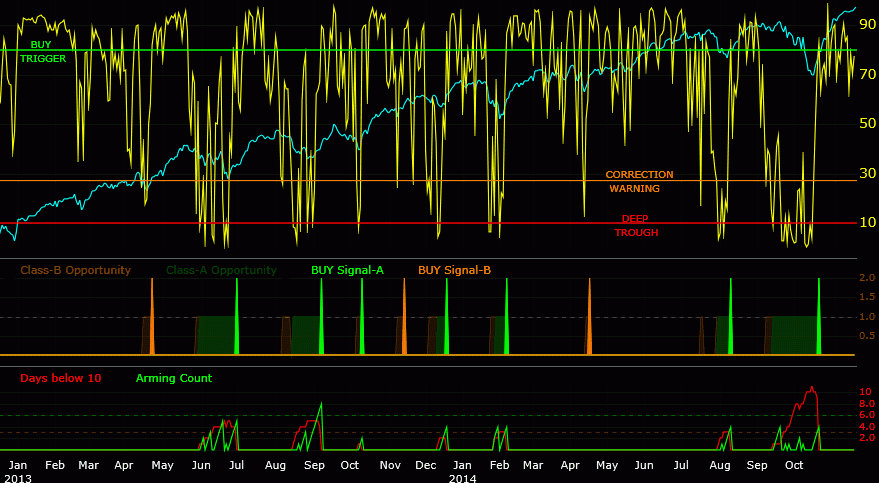
There is also the excellent Great Trough Breadth Signal we recently discussed in this blog posting and which provided us with a rare SP-500 BUY signal on 21st October. It is available on the CHARTS>TROUGH>GTR tab and updated every 15 minutes. When this indicator drops below the CORRECTION WARNING line, you have a very reliable warning of some increased volatility,more than likely accompanied by some non-trivial SP-500 declines. It is classified as a short-term-to co-incident indicator since sometimes it provides a short term (2-4 days) warning and on other occasions some small declines on the SP-500 may have set in already to trigger the warning. Due to occasional spurious single-day visitations of this index below the warning trigger, we like to see at least two days of the index below the warning trigger in a 5-day period before taking action. Right now, this is showing no cause for concern, but this can rapidly change as seen below:
COINCIDENT INDICATOR
Our SP-500 Selling Pressure Index provides very reliable co-incident warnings of further SP-500 declines. You can view it on the CHARTS>TROUGH>SPD tab and it is updated every 15 minutes. We categorize this as a “co-incident” signal since in most cases some small declines on the SP-500 have already commenced (we have passed the peak of the top) by the time warning signals are triggered. There are 7 components to this composite and whenever one of them surpass their respective triggers, the Selling Pressure Diffusion rises. Whenever the Selling Pressure Diffusion rises from 0 (no selling pressure) to more than zero, this is your top warning:
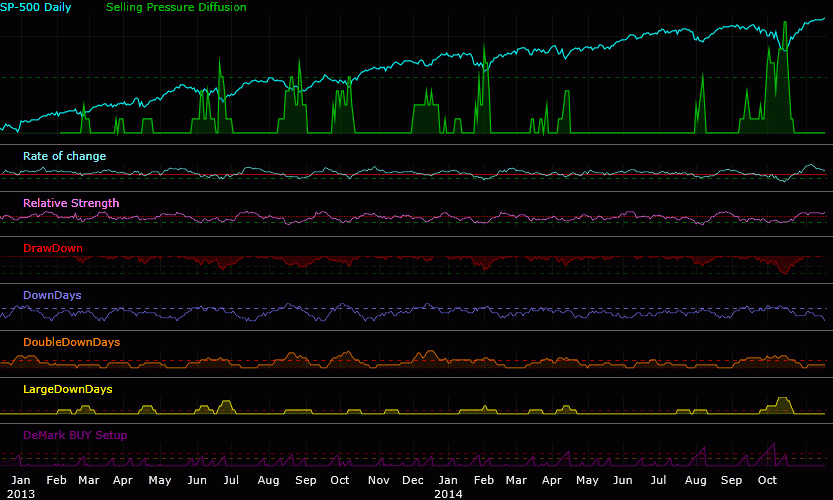
The components that initially trigger the first rise in the Selling Pressure Diffusion are normally the “LargeDownDays” index or the “DoubleDownDays” index, followed by the “DownDays” index. The DeMark, Relative Strength, rate of Change and Drawdown components require significant damage to already have occurred on the SP500 to trigger, and are there to amplify the Selling Pressure signal to represent extreme bouts of selling. They are therefore not useful for top warnings. After a period of low volatility (selling pressure diffusion on zero) you may view a rise in the Selling Pressure Diffusion from 0 to 1 as your first top warning, followed by a rise from 1 to 2 as your second top warning.
What makes this index particularly useful is that it not only presents you with a relative scale of the intensity of any correction, but is used to detect reliable trough reversals whenever it falls below the dotted line, in addition to delivering highly reliable warnings for non-trivial corrections. In fact some of our clients follow a strategy of buying the SP-500 on the BUY signals, selling 50% on the first top warning and selling the balance on the 2nd top warning. Essentially, whenever this indicator is flat-lining on zero, it is suggesting that the market is SAFE.
STATUS UPDATES & ALERTS
Subscribers can go view the overall status of all six of the metrics discussed above, by going to the CHARTS menu tab. A circular gauge on the right shows a value from 0 to 6 depending on how many of the six metrics we just discussed are warning of a stock market correction:

The counting strategy works as follows:
1. If the Great Trough Breadth Signal is below 30, add 1 to count
2. If Selling Pressure Diffusion is rising or flat and above zero, add 1 to count
3. Add 1 to count for each ALIX component <0 and falling.
This produces the following result:

As the gauge suggests, we would not read too much into readings of 1, start paying attention at readings of 2 and really take note of readings of 3 or more. Another interesting by-product of this short-term top counting gauge is that on most occasions a fall from levels of 5 or 6 are excellent trough markers, isolating many great entry points into the market.
Comments are closed.