
The Recession Forecasting Ensemble (RFE) is a collection of 6 powerful diversified recession forecasting methodologies that differ in data, mechanics, approach and theory to offer us an over-arching recession dating and forecasting methodology that is resilient to individual “model risk”. There is no “one size fits all” mathematical model that performs well in the past and is guaranteed to perform well into the future. Every recession is different and since recession calls are “high stakes” events, with costly consequences for either calling a recession when there is none (as with the recent ECRI call that cost investors who heeded it 28% in lost stock market gains) or failing to call a recession and getting caught in the average 30% recessionary draw-down, we need to be very sure when we make a call. The only way to do that is by consulting multiple robust models that are not too correlated with each other in makeup or methodology. If one, two or even three of these models “fail” we have the other models as backup.
The 6 components of the RFE are:
- The Co-incident SuperIndex (0-1 months lead, updated weekly)
- The Leading SuperIndex (3-4 months lead, updated weekly)
- The Recession Diffusion Index (0.5-1 months lead, updated weekly)
- The Recession Syndrome Diffusion Index (4-5 months lead, updated weekly)
- The Anxiety Survey Index (0-1.5 months lead, updated quarterly)
- The Headwinds Index (6-7 months lead, updated monthly)
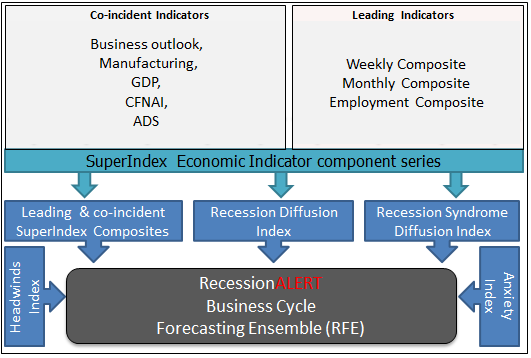
The top 4 components of the RFE, namely the Leading and co-incident SuperIndex composites, the Recession Diffusion Index and the Syndrome Diffusion Index are all made up from the 9 SuperIndex component composites, namely the Philly Fed Business Outlook Survey, a manufacturing conditions index, a monthly GDP index, the Chicago Fed National Activity Index, the Philly Fed ADS, a Weekly Leading Index, the e-Forecasting.com eLEI, our monthly leading index and an employment leading index. The Headwinds index is a stylized methodology applied to the monthly leading index and the Anxiety Index is created from surveys of professional forecasters.
1. Co-Incident SuperIndex [0-1 months average real-time lead to recession]
This is a weighted composite of the 9 SuperIndex sub-components that offers a co-incident timing to US business cycle expansions and contractions. The 5 co-incident SuperIndex sub-components obviously have higher weightings in the composite than the 4 leading sub-components.

2. Weekly Leading SuperIndex [3-4 months average real-time lead to recession]
This is a weighted composite of the 9 SuperIndex sub-components that offers a leading timing to US business cycle expansions and contractions. The 5 co-incident SuperIndex sub-components obviously have lower weightings in the composite than the 4 leading sub-components.

3. The Recession Diffusion Index [0.5 months average real-time lead to recession]
This measures each week how many of the 9 SuperIndex sub-components are in their respective recession territories. We have determined “golden thresholds” for each of the 9 sub-components below which they must fall to flag recession in the most accurate manner historically. The “golden threshold” is that measure for which the respective sub-component provides the best recession forecasting and dating capability – the least amount of false positives, the least amount of false negatives and the maximum “area under the curve” (AUC) sorting accuracy. When 4 or more SuperIndex sub-components (it does not matter if they are co-incident or leading) are flagging recession, then the Diffusion Index makes a hard recession call. It then calls the end of the recession when the diffusion index falls below 2.

4. The Recession Syndrome Index [4-5 months average real-time lead to recession]
The “Syndrome” methodology finds optimal values (syndrome thresholds) for each of the 9 SuperIndex sub-components, below which they must fall to contribute toward a “recession syndrome“. The sub-component falling below this threshold tells us nothing on its own, but when combined with other sub-components falling below their syndrome thresholds it becomes an extremely powerful recession forecasting tool. When 4 or more SuperIndex components fall below their syndrome thresholds they create a “Recession Syndrome” that allows us to trigger a recession call with an average 5 months lead warning. Similarly, when we are in a recession call and the number of components below their syndrome thresholds falls to 2 or less, we call the end of recession. A remarkable feature of this methodology is that it provides an average 5 months lead to recession with a low standard deviation.

5. The Headwinds Index [6-7 months average real-time lead to recession]
This model uses monthly leading index directional behavior (looking only at if it rose or fell) to derive how much “headwinds” the economy is accumulating and produces a “Headwinds index”. It only considers directional movement and does not look at levels or growth rates as is traditionally the norm. It then uses a regime-changing probability model to determine implied probabilities of recession in 6 months based on the level and trend (rising or falling regime) of the headwinds indicator.

6. The Anxiety Index [0-1.5 months average real-time lead to recession]
This is a recession probability index built from various surveys of professional forecasters, including Wall Street economists, corporate economists, independent economists and academics. The anxious index is a more accurate and reliable warning for recessions than individual economists’ forecasts, but what we really like about this index is that the data is never revised and thus we can build a true “real-time” prediction model based on real-time outside observations.

Putting it all together in the RFE Index
The RFE Diffusion Index shown below charts the number of models we discussed above (0 to 6) that are in their respective recession territories (making a recession call.) The more systems in recession territory, the higher the RFE index and the more confidence you have in your recession call. The same applies to calling the end of recessions -the more the RFE falls (declines) the higher the probability that recession has ended. The RFE allows you to manage a delicate balancing act between early warning and accuracy. It is an ideal mechanism to represent and manage recession risk. The optimal balance is to make a recession call when the RFE reaches 2 or more. One may then elect to steadily phase into cash with each rise of the RFE up until the point it is reading 5 or more, when you should be 100% hedged or in cash.

Another nice benefit from the RFE index is that we can correlate the value of its reading to average months to business cycle peak. When 1 model starts flagging recession we have an average 6 months real-time lead to recession. When 2 models flag recession we have 4 months lead to recession. When 3 models are flagging recession we have 3 months lead to recession. When 4 models are in recession territory we have 1 month lead to recession. When 5 or more models are in recession, we are already in recession. The advantage of using the RFE as opposed to any of the individual 6 models is that we eliminate “model risk” and achieve smaller standard deviations (variances) of expected average recession leads. We also have a staging mechanism to commence phasing stock market funds into and out of the market concomitant with risk. Although an RFE reading of 1 provides an average 6-months lead to recession, this has provided two false positives in the past. However it is still a very useful “shot across the bow” warning to you.
Macro-market timing with the RFE
Although we advocate a phased defensive-stance approach to the markets with successive increases in the RFE level, there is a powerful macro-market timing strategy you can deploy with the RFE that achieved 3 times the total return (TRI) of the SP-500 buy-and-hold strategy since 1968 by only being vested in the market 80% of the time. This market timing strategy has two simple rules:
- Move 100% into cash when the RFE reaches a level of 3 or more
- Invest in the SP-500 when you are in cash and the RFE falls by one level


External “sanity checking” for the RFE
We deploy two powerful “sanity checks” for the RFE. They are two additional diversified recession dating models that are not included in the RFE, but are consulted externally.The first is the GDP/GDI co-incident recession model which looks monthly at quarterly GDP and GDI updates. We look at these quarterly updates monthly as they are revised on a monthly basis.
The 2nd external sanity check is the highly robust “NBER Model” whereby we deploy a real-time (unrevised) data-set for the 4 co-incident variables the NBER watch for recession dating determination.
These two models are our “recession confirmation of last-resort“. If these models are not flagging recession you can be pretty sure we are not in recession. The reason they do not have much use in the RFE is that they have 1-2 month lag times to recession starts which is a bit late for the stock market timer or fund manager and adds no additional value to the performance of the RFE. They are useful as a “get out of jail” cards should the RFE fail spectacularly. Incidentally these two models are precisely what the NBER use in their recession dating determinations.
You mention: “Given that experts estimate that recessions are going to be occurring with higher frequency in the future … “. Please, which experts? Can you refer me to a paper/article(s) written on this? What is the evidence?
ECRI – https://www.businesscycle.com/ecri-reports-indexes/report-summary-details/economic-cycle-research-ecri-an-accurate-forecast