
MIB WEEKLY DIGEST
Week of Nov 2–6, 2026
Tuesday’s Democratic sweep of Congress turned into the AI trade’s newest risk: a 3.03% Dow relief rally on Wednesday gave way to Thursday’s 4.36% S&P 500 drop, its worst since April 2025, as chip stocks sank 12.25% on fears of curbs on the data-center build-out. Dell (−22.57%) and Micron (−22.01%) led the week’s losers despite strong AMD and Arista results, while Oracle’s $20 billion raise and Microsoft’s retreat from rented capacity raised the cost question. Brent fell 12.78% on Iran diplomacy, yet 165,000 payrolls lifted the odds of another Fed hike to 77%. The S&P 500 lost 2.68% and the Nasdaq 100 4.91%.
TABLE OF CONTENTS
A. WEEK AT A GLANCE
B. WEEK IN MARKETS
C. WEEK’S TOP STORIES (6)
D. WEEK IN THE ECONOMY (5)
E. WEEK IN EARNINGS (3)
F. NEXT WEEK SETUP
G. CHART OF THE WEEK
A. WEEK AT A GLANCE -> TOP
The S&P 500 lost 2.68% and the Nasdaq 100 4.91% in a week that turned on Tuesday’s midterm elections: a Democratic sweep of Congress set off a 3% Dow rally on Wednesday, then a 4.36% S&P 500 drop on Thursday as investors priced tougher rules for the AI build-out. Underneath, six of 11 sectors still rose, gold gained 4.89% and Brent fell 12.78% on Iran diplomacy. The policy backdrop hardened rather than eased, with a 165,000 payrolls beat leaving the odds of another Fed hike higher than a week earlier.
• Thursday’s rout defined the week: the S&P 500 fell 4.36%, its worst session since April 2025, the Philadelphia Semiconductor index 12.25%, and the VIX jumped 69% to its highest close since at least April 15.
• AI hardware filled the losers’ table: Dell (−22.57%) and Micron (−22.01%) led five chip and hardware names, while Amazon (+7.88%) topped the gainers as a likely winner from data-center curbs.
• Brent fell 12.78% to $97.98, on course for its largest weekly drop since 2020, as Iran diplomacy drained the war premium; Energy lost 11.45%, the worst sector.
• October payrolls rose 165,000 against 65,000 expected, with 84,000 of upward revisions; Polymarket’s odds of another 2026 hike ended at 77%, up 7 points on the week.
• Gold rose 4.89% and platinum 6.96% as the dollar slid after the election, while copper fell 3.66% with AI infrastructure.
• CVS fell 12.53% after announcing a plan to split into two companies, on the same day it raised its earnings guidance.
1. Politics became an AI risk factor — The same midterm result lifted Big Tech on Wednesday as a winner from data-center curbs and sank its suppliers on Thursday, adding a policy discount to AI hardware that no earnings print this week, including AMD’s $17 billion guide, could offset.
2. The cost of the build-out, not its demand, is now the question — Oracle’s equity raise, Meta’s wider bond spreads and Microsoft’s retreat from rented capacity priced AI financing higher in the same week AMD and Arista confirmed demand, and Apple’s tightly priced bond showed the squeeze falls specifically on AI spenders.
3. Cheaper oil, dearer money — Brent’s 12.78% fall and a lower 10-year yield did not soften the Fed: every labor release beat, three Fed presidents argued for tightening, and hike odds ended the week higher, so the bond market’s long end priced fiscal gridlock while its front end kept pricing December.
 — Leading economic indicators. Accurate market forecasts. Apply for membership at join.recessionalert.com
B. WEEK IN MARKETS -> TOP
This was the week the AI trade met politics. Monday’s resumed chip selling and Oracle’s $20 billion capital raise set the tone; Tuesday’s Democratic sweep of Congress then moved the tape twice, first into a Wednesday relief rally that lifted the Dow 3.03% and bid up Microsoft, Amazon and Apple as likely winners from data-center curbs, then into Thursday’s 4.36% S&P 500 drop, its worst session since April 2025, as the same curbs were priced as a threat to chipmakers and AI hardware. Beneath the headline loss, Consumer Cyclical, Communication Services and Basic Materials finished the week higher. The sharpest divergence ran through oil: Brent, on course for its largest weekly drop since 2020 per LSEG data cited by Reuters, fell on Iran-diplomacy hopes yet did nothing to soften the rate outlook, and Friday’s payrolls beat left Polymarket’s odds of another 2026 hike higher than a week earlier.
FRIDAY CLOSE & WEEK-ON-WEEK CHANGE — Fri, Nov 6, 2026:
MAJOR INDICES
The week’s index ranking is a map of AI exposure, with Thursday’s Nasdaq 100 collapse doing most of the damage while the Dow’s election rally and rout nearly cancelled. The S&P 500 finished 2.2 points ahead of the Nasdaq 100, clearing the broadening threshold: value and cyclicals gaining ground on growth. Dow Theory gave no weekly signal, but Wednesday’s relief rally went unconfirmed: the Dow’s 3.03% jump came with only a 1.12% gain in transports, which then fell harder than the Dow into Friday.
| Index | Fri Close | WoW Change | WoW % | Why It Moved (Week) |
|---|---|---|---|---|
| S&P 500 | 7,376.86 | −203.21 | −2.68% | Thursday’s 4.36% post-midterm AI rout erased Wednesday’s 1.58% relief rally and more; Friday’s chip bounce recovered only 0.31%. |
| Dow Jones | 51,285.73 | −484.58 | −0.94% | Least AI exposure of the six: Wednesday’s 3.03% election rally and Thursday’s 3.44% drop nearly cancelled, leaving a sub-1% weekly loss. |
| DJ Transportation | 19,774.87 | −554.46 | −2.73% | Monday’s airline-led gain on crude’s plunge faded; transports lagged Wednesday’s rally and fell harder than the Dow on Thursday and Friday. |
| Nasdaq 100 | 26,989.99 | −1,394.86 | −4.91% | Chips and AI hardware carried the loss: a 6.36% Thursday drop on data-center regulation fears left the Nasdaq Composite in correction, per Reuters. |
| Russell 2000 | 2,754.11 | −57.73 | −2.05% | Tracked the S&P 500 almost point for point through the election swing; small caps neither led the relief rally nor escaped Thursday’s rout. |
| NYSE Composite | 23,950.37 | −342.72 | −1.41% | The broader, less tech-heavy index lost under a third of the Nasdaq 100’s decline, with defensives and financials finishing the week higher. |
VOLATILITY & TREASURIES
A risk-off week in bonds as well as options: volatility rose while yields fell across the curve. The detail is in the path. The 2-year’s Thursday plunge was larger than its whole weekly decline, because Friday’s 165,000 payrolls beat clawed part of it back and lifted the dollar with it. Wednesday’s long-end rally, on bets a divided Washington will borrow less, largely held; the front end never stopped trading the December hike.
| Instrument | Fri Level | WoW Change | Why It Moved (Week) |
|---|---|---|---|
| VIX | 25.63 | +6.19 (+31.84%) | Collapsed to 16.57 on Wednesday as the election removed event risk, then jumped 69% on Thursday’s AI rout to its highest close since at least April 15. |
| 10-Year Treasury Yield | 4.856% | −6.7 bps | Wednesday’s 7.3 bp rally on bets a divided Congress borrows less, plus Thursday’s flight to safety, outweighed Tuesday’s 5.5 bp Election Day selloff and Friday’s payrolls bounce. |
| 2-Year Treasury Yield | 4.512% | −7.8 bps | Thursday’s 11.7 bp risk-off drop did most of the work; Friday’s payrolls beat and rebounding hike odds clawed back 4.8 bps. |
| US Dollar Index (DXY) | 102.30 | +0.42 (+0.41%) | Slipped through the election week on lower yields, touching 101.51 on Wednesday, then Friday’s 0.75% payrolls-driven gain left it higher on the week. |
COMMODITIES
Precious metals and copper split cleanly: gold, silver and platinum all gained while copper fell, so the metals read the week as a dollar-and-haven story rather than a growth one. The bid arrived on Wednesday as the dollar slid after the Democratic sweep and held through Thursday’s rout, when copper instead sold off with AI infrastructure. Bitcoin offered no shelter, falling with equities on Thursday and sitting out Friday’s tech bounce.
| Asset | Fri Price | WoW Change | WoW % | Why It Moved (Week) |
|---|---|---|---|---|
| Gold | $4,074.87/oz | $+189.90 | +4.89% | Rebounded from last Friday’s lowest close since at least April 15; Wednesday’s 3.34% jump on a weaker dollar after the election was its best day since August. |
| Silver | $51.935/oz | $+2.805 | +5.71% | Followed gold with more amplitude, led by Wednesday’s 5.17% dollar-driven gain; Thursday and Friday gave back under 2%. |
| Copper | $6.2595/lb | $−0.2375 | −3.66% | Missed the metals bid entirely: a 2.41% Election Day drop, then a 3.49% fall on Thursday alongside the AI-infrastructure selloff. |
| Platinum | $1,534.30/oz | $+99.90 | +6.96% | Hit its lowest close since at least April 15 on Tuesday, then rallied 4.93% on Wednesday’s weaker dollar and kept gaining into Friday. |
| Bitcoin | $75,823.00 | $−1,119.00 | −1.45% | Traded as a risk asset: a 4.16% post-election gain on Wednesday was wiped out by Thursday’s 5.20% drop with tech, and Friday was flat. |
ENERGY
Oil fell against equities for most of the week, dropping on Monday’s and Wednesday’s diplomacy and election headlines while the Dow rallied: the signature of a war-premium unwind, not a demand scare. Thursday reversed both, as tanker attacks lifted crude while stocks crashed. Brent fell further than WTI, narrowing the spread to about $7.39 from $9.41. Gas split by continent, Dutch TTF following crude down while Henry Hub rose.
| Asset | Fri Price | WoW Change | WoW % | Why It Moved (Week) |
|---|---|---|---|---|
| Crude Oil (WTI) | $90.59/bbl | $−12.34 | −11.99% | Monday’s 7.44% plunge on Trump’s “no rush” Iran remarks and Wednesday’s 8.38% post-election drop on bets a Democratic Congress hastens a war exit; Thursday’s tanker attacks recovered only part. |
| Crude Oil (Brent) | $97.98/bbl | $−14.36 | −12.78% | The same two diplomacy legs took it below $95 by Wednesday, its lowest close since August 31; on course for its largest weekly drop since 2020, per LSEG data cited by Reuters. |
| Natural Gas (Henry Hub) | $2.980/MMBtu | $+0.096 | +3.33% | Decoupled from crude, rising in three of five sessions; Goldman raised its gas forecasts on Tuesday and the IEA warned the global gas crunch could last well into 2027. |
| Natural Gas (Dutch TTF) | $28.072/MMBtu | $−5.688 | −16.85% | Tracked crude’s diplomacy unwind, with Monday’s 9.85% fall the largest leg, despite the IEA warning that Europe enters winter with its lowest storage in over a decade. |
S&P 500 SECTORS — WEEKLY ROTATION
A sectors-vs-market split: six of 11 sectors rose on the week while the S&P 500 lost 2.68%, because the two big losers were Technology and Energy. Technology’s decline was broad within hardware rather than one name: Dell, Micron, Lam Research, Applied Materials and Intel are the week’s five worst mega-caps. The leaderboard flatters breadth, though. Consumer Cyclical owes much of its gain to Amazon and Home Depot, two of the top five gainers. Energy, still the YTD leader, swung from a 10.57% one-month gain a week ago to a 5.63% loss.
| Sector | 1-Week | 1-Month | 3-Month | 6-Month | YTD | 12-Month |
|---|---|---|---|---|---|---|
| Communication Services | +2.58% | −11.90% | −11.26% | −18.02% | −10.51% | −6.58% |
| Consumer Cyclical | +2.55% | +3.94% | −3.40% | −4.27% | −3.75% | −6.29% |
| Basic Materials | +2.19% | −1.04% | −7.12% | −7.89% | +8.94% | +21.28% |
| Real Estate | +1.98% | +6.75% | −2.31% | −1.85% | +7.14% | +5.77% |
| Consumer Defensive | +1.29% | +8.44% | +7.11% | +5.60% | +15.55% | +18.20% |
| Financial | +1.09% | +2.91% | −3.26% | +8.27% | +5.06% | +10.47% |
| Healthcare | −0.12% | +9.08% | +6.69% | +22.25% | +15.09% | +20.15% |
| Utilities | −0.18% | +4.20% | −0.41% | −5.29% | +0.20% | −3.31% |
| Industrials | −2.37% | −5.19% | −11.00% | −9.85% | +3.11% | +4.01% |
| Technology | −7.06% | −14.80% | −9.80% | −4.95% | +11.48% | +7.50% |
| Energy | −11.45% | −5.63% | −0.21% | +4.66% | +32.59% | +35.34% |
TOP WEEKLY MOVERS:
The two tables are mirror images of one trade. All five decliners are AI-hardware names in Technology, the week’s second-worst sector, and all five were up more than 15% on the year, Dell and Micron by more than 140%, so the selloff landed on the year’s biggest winners; Dell’s one-month loss now exceeds 42%. The gainers are the AI build-out’s customers and bystanders: Amazon was bid as a likely winner from data-center curbs, while Berkshire, Disney and Home Depot drew defensive and rate-sensitive money. GE Aerospace, up in a sector that fell 2.37%, is the one idiosyncratic name.
TOP 5 WEEKLY GAINERS
| Ticker | Week | YTD | Year | Why It Moved |
|---|---|---|---|---|
| AMZN | +7.88% | +12.34% | +6.69% | Jumped more than 6% on Wednesday to a three-month high after the Democratic sweep, as investors bet that curbs on new data-center construction would entrench the incumbents’ scarce computing capacity and ease pressure on their cash flows, per Reuters; part of a reported $750 billion Big Tech rally that day. |
| GE | +7.10% | +4.94% | +5.89% | No single catalyst — broad-sector or momentum move. Most of the gain came in Monday’s 4.6% rise to its highest close in 20 sessions, on a day crude fell more than 7%; no company-specific news was found. |
| DIS | +5.24% | +2.62% | +5.67% | Rose about 4.2% on Wednesday to a 52-week high on its heaviest volume in 20 sessions, with no company announcement behind the move; fiscal fourth-quarter results are due November 17. |
| BRK-B | +5.24% | +13.58% | +15.76% | Defensive rotation out of AI stocks: rose more than 3% on Wednesday to a record close with no Berkshire filing or statement behind it, per 24/7 Wall St.; third-quarter results are due Saturday, November 7. |
| HD | +4.33% | −0.18% | −6.94% | Housing stocks rallied after the midterms on hopes of affordability action and lower mortgage rates: Home Depot gained 6.53% on Wednesday, with Lowe’s up 8%, per TIKR, then gave back part of it ahead of its November 17 results. |
TOP 5 WEEKLY DECLINERS
| Ticker | Week | YTD | Year | Why It Moved |
|---|---|---|---|---|
| DELL | −22.57% | +160.99% | +120.22% | Led the post-midterm AI-hardware selloff, down 8.82% on Wednesday and 14.89% on Thursday on fears that Democratic wins, including in data-center states such as Texas, would slow construction; no Dell-specific news, per Investing.com and TIKR. |
| MU | −22.01% | +141.76% | +189.51% | Fell 17.46% on Thursday as the chip rout coincided with a Bloomberg report that Micron had largely halted construction of its $3–4.5 billion Fab 11E in Taiwan amid a union pay dispute; Micron said its existing Taiwan operations run normally. |
| LRCX | −16.17% | +17.09% | +23.58% | Dropped 16.36% on Thursday to its lowest close since early January in the semiconductor rout, with Qualcomm’s weak outlook adding pressure; a $25 billion buyback announced Thursday helped an 8.23% Friday rebound. |
| AMAT | −14.71% | +29.47% | +42.47% | Fell 13.58% on Thursday with no company announcement, as the midterm-driven rotation out of chip stocks hit equipment makers; down 38.7% from October 7 to November 5, per Trefis, ahead of results on November 12. |
| INTC | −14.42% | +52.52% | +51.13% | Extended the slide that followed its October 29 guidance miss (fourth-quarter revenue of $15–16 billion against $17.08 billion expected) and BofA’s downgrade to Neutral: down 8.80% on Monday and about 6.3% on Thursday before a 7.71% Friday bounce. |
— Institutional-grade intelligence for serious investors. Apply for membership at join.recessionalert.comC. WEEK’S TOP STORIES -> TOP
The week resolves into three threads. The largest is the AI build-out losing its assumptions (stories #1, #4, #5): fresh demand evidence arrived just as financing grew dearer, the biggest renter of compute turned selective and Washington narrowed the China channel. The second is political (#2): within two sessions the midterm result reached energy, health care, defense and the AI supply chain. The third is a war premium draining out of oil on diplomacy that no government has yet confirmed (#3). CVS (#6) stands apart. The first two threads converged on Thursday, when politics became the AI trade’s newest risk.
BEARISH
1. The AI-Hardware Trade Breaks: Strong AMD and Arista Prints Fail to Hold, Then Thursday’s 12% Chip Rout Puts the Nasdaq Composite in Correction
The core facts:The selling resumed on Monday, when an early S&P 500 gain of 1.1% faded and Intel (−8.80%), AMD (−7.52%), Dell (−7.43%) and Micron (−5.78%) fell with no company news. Tuesday brought the first chip gain in five sessions and, after the close, two strong prints: AMD guided fourth-quarter revenue to about $17 billion, roughly 27% above the quarter just reported, and Arista beat its revenue estimate by nearly 10%. Neither held. AMD’s 7.49% after-hours gain faded to 1.01% on Wednesday as Dell, Micron and GE Vernova fell on the election result, and on Thursday the S&P 500 fell 4.36%, its worst session since April 2025, per Reuters. The Philadelphia Semiconductor index fell 12.25%, the Nasdaq Composite closed more than 10% below its October 6 record, and Micron (−17.46%), AMD (−17.26%), Lam Research (−16.36%), Dell (−14.89%) and Applied Materials (−13.58%) led the losses. Friday’s 4.2% semiconductor bounce left the Nasdaq 100 down 4.91% on the week.
Why it matters:The week separated AI demand from AI pricing. The two hardest demand data points of the week, AMD’s guide and Arista’s beat, could not stop the selling, so the market was no longer debating whether the spending exists but who will fund it and whether it will be permitted (story #4 and story #2). The damage was concentrated in the year’s biggest winners: all five of the week’s worst mega-caps are AI-hardware names, and Technology lost 7.06% while six sectors rose (see the sector rotation and weekly movers tables in Section B). The Fed is not offering cover: San Francisco’s Mary Daly called the repricing “painful” but “orderly” on Friday while repeating that policy must tighten further.
What to watch:Applied Materials and Cisco after the close on Thursday, November 12, the first AI-hardware reports since the rout, and whether the VIX, which ended the week at 25.63, can return below 20.
UNCERTAIN
2. Democrats Take Both Chambers: A 3% Dow Relief Rally on Wednesday, Then a Sector-by-Sector Repricing of Policy Risk
The core facts:Democrats won the House and the Senate in Tuesday’s midterms; NBC put the party on course for about 255 House seats, short of the 290 needed to override a veto. In Wednesday’s first session after the result, the Dow rose 3.03%, the VIX fell 20.45% to 16.57, the 10-year yield fell 7.3 bps and the dollar slipped. The winners were sorted by policy: Microsoft (+6.68%), Amazon (+6.12%) and Apple (+5.31%, a record) on bets that data-center curbs would favour incumbents; Centene (+12.64%) and HCA (+10.34%) on hopes of delaying Medicaid cuts and extending ACA subsidies; Home Depot (+6.53%) on housing. The losers too: Vistra (−13.83%) after a Democrat promising tighter data-center rules won the Texas governorship, Lockheed Martin (−6.88%) on fears of a smaller defense budget, and crude (−8%) on bets of a faster Iran-war exit. On Thursday the same result was priced as AI regulation risk, with Tesla falling 10.77% and SpaceX about 9% on political exposure. Reuters also noted that a Democratic Senate checks future Fed Board confirmations, with Senator Elizabeth Warren likely to chair the Banking Committee.
Why it matters:The market priced bargaining power, not legislation. Gridlock lowers the odds of further tax cuts and spending, which is why the long end rallied (see the Vol & Treasuries table in Section B), but the veto arithmetic means a tariff rollback, a Medicaid delay or a data-center moratorium still needs the President’s signature or Republican votes. The sector winners and losers are therefore holding probabilities that can reverse as soon as January’s Congress shows what it can actually pass. The two-day sequence also showed the same news being read as relief and then as threat: Big Tech gained on curbs Wednesday, while their suppliers took the loss on Thursday (story #1).
What to watch:First statements from incoming committee chairs on data-center permitting, defense and war funding; the incoming Texas administration’s position on permits; and the White House’s next step on Fed Governor Lisa Cook.
BULLISH
3. Diplomacy Drains Crude’s War Premium: Brent Falls 12.78% to $97.98 on Course for Its Largest Weekly Drop Since 2020, Though Hormuz Stays Contested
The core facts:On Monday President Trump told Axios he was in “no rush” to decide on resuming the Iran war, a Qatari mediator travelled to Tehran, and Brent fell 8.08%. On Tuesday overnight US strikes on Iran’s Qeshm Island failed to lift prices, while unconfirmed reports of progress swung Brent by more than $6 intraday. After Wednesday’s midterm result, which Trump and Vice President Vance both linked to the war and gasoline prices, Brent fell another 8.67% to $94.62, its lowest close since August 31, even as EIA data showed crude and distillate stocks falling. Thursday reversed part of it: Iran reported three more tankers damaged in the Strait of Hormuz and Brent rose 4.65%, as Tehran sent Washington a nuclear proposal via Qatar. On Friday Trump said “We have beaten Iran,” Bloomberg reported the sides moving closer to a breakthrough, Qatar said no comprehensive agreement had been reached, and Brent closed flat. OPEC+’s core seven had held December output steady on November 1, and Gulf crude exports rose 10% to 15.53 million barrels a day in October, per Bloomberg.
Why it matters:Oil moved from pricing a closed strait to pricing a negotiated reopening, the largest disinflationary force in the outlook and the reason Energy lost 11.45% on the week while airlines and consumer cyclicals held up (see the Energy and sector rotation tables in Section B). Two limits apply. The reopening is still an expectation: tanker attacks continued all week and every reported diplomatic step came with a denial or a qualifier. And cheaper oil did not soften rate expectations, with hike odds ending the week higher (Section D), so lower crude is helping headline inflation without changing the Fed’s path.
What to watch:Any confirmed timetable for reopening Hormuz; the Russia-Ukraine-US talks in Abu Dhabi on November 10–11; the EIA’s Short-Term Energy Outlook on November 10; and the OPEC+ meeting on November 29.
BEARISH
4. Who Pays for the Build-Out: Oracle’s $20 Billion Raise, Meta’s Wider Spreads and Microsoft’s Retreat From Rented AI Capacity
The core facts:On Monday Oracle filed to sell $10 billion of stock alongside $10 billion of bonds and fell 8.76%; it priced the shares at $116, selling 86.2 million against the 76.5 million its prospectus had assumed. The same day Marvell agreed to buy Lumentum in a $115 billion all-stock deal and fell 12.72%, followed on Tuesday by downgrades from BofA and TD Cowen over dilution. On Tuesday Meta launched a bond sale of at least $20 billion with 30-year bonds discussed about 0.9 percentage points wider than a similar Meta bond in April. Then the largest buyer of third-party compute stepped back twice: on Thursday the Financial Times reported Microsoft had declined a 700 MW expansion option at Nscale’s Texas site, and on Friday Bloomberg reported Microsoft is winding down its rental of AI capacity from Oracle, which said demand “remains strong.” Morgan Stanley downgraded Cisco on Thursday, warning that orders were pulled forward ahead of price increases. Against that, Anthropic’s amended IPO filing on Monday showed $895 billion of purchase commitments, almost all for compute.
Why it matters:The cost of capital for AI rose in every channel this week: equity (Oracle had to sell more shares than planned), credit (Meta paid more for long money) and paper-funded M&A (Marvell’s holders sold the dilution). At the same time the most important customer of rented capacity became selective, which is the question that turns a funding squeeze into a demand question for neoclouds and lessors. Apple’s roughly $7 billion bond, which drew about $31 billion of orders at tighter pricing, shows the funding window is open for borrowers not financing an AI capex program, a distinction the market is now drawing sharply.
What to watch:Pricing and demand for Nscale’s IPO; any Microsoft statement on which partnerships its reassessment covers; Cisco’s order growth on November 12; and Nvidia’s results later in November.
UNCERTAIN
5. Washington Narrows the China AI Channel as the Trade Truce Frays: Nvidia’s Reported 51% Rule, Oracle’s Tencent Cancellation and a Tense Bessent-He Call
The core facts:On Tuesday the Financial Times reported that Nvidia has told cloud providers using its chips to sell at least 51% of their services to non-Chinese customers, a rule passed on verbally and not confirmed by Nvidia. On Wednesday the FT reported that Oracle cancelled a roughly $7 billion agreement to lease AI chips to Tencent after US officials raised concerns, which Reuters could not verify. On Thursday the Commerce Department extended the suspension of its “Affiliates Rule” export controls, due to lapse November 9, to January 10, 2027, the same date to which the US-China trade truce was extended. On Friday Treasury Secretary Bessent and Trade Representative Greer told Vice Premier He Lifeng that China must implement its Busan commitments “fully and immediately,” naming rare earths, critical minerals and farm purchases, and Treasury “raised concerns about recent Chinese actions” without naming them.
Why it matters:Export policy is moving from chip sales to rented compute, the route Chinese firms have used to reach advanced hardware without buying it, and that caps one of the fastest-growing pools of AI demand outside the US. The Affiliates Rule extension spared chip-equipment makers a new licensing burden in the week they fell hardest, but tying it to the truce date means the January 10 deadline now carries both. The harder tone of Friday’s call puts rare earths, a supply-chain pressure point for chips, defense and autos, back on the risk list.
What to watch:A Chinese readout of Friday’s call and any Commerce Ministry statement on rare-earth licensing; Applied Materials’ China revenue share on November 12; and any Commerce rule on remote access to US AI chips.
UNCERTAIN
6. CVS Plans to Split Aetna and Caremark From Its Pharmacies, and the Stock Falls 12.53% on a Beat-and-Raise Day
The core facts:On Wednesday CVS Health announced plans to separate into two public companies: a healthcare solutions company holding Aetna, Caremark, CVS Specialty, Oak Street Health and Signify Health, led by CEO David Joyner, and CVS Pharmacy, holding about 9,000 stores, the mail pharmacy and MinuteClinic, led by Prem Shah. The split is intended to be tax-free and completed in the first half of 2028, subject to board approval and an effective Form 10; the release gave no figures for separation costs or debt allocation. The same morning CVS beat third-quarter estimates, with adjusted EPS of $2.09 against $1.65, and raised its full-year adjusted EPS guidance to at least $8.20. The shares fell 12.53% while Medicaid-focused insurers rallied.
Why it matters:The plan unwinds the vertical model CVS built by buying Aetna, and the market’s verdict was unusually clear: a double-digit fall on a day the company raised guidance and its peers rallied on the election. Investors appear to doubt that the separation creates value without knowing how the debt is divided, and a two-year timeline leaves the stock trading on that uncertainty. It also confirms that the integrated insurer-pharmacy model is under strain from within as well as from policy.
What to watch:The Form 10 filing and the naming of each company’s board, which will show the split of debt and dividends.
— Separating signal from noise since 2007. Apply for membership at join.recessionalert.comD. WEEK IN THE ECONOMY -> TOP
The week inverted the familiar cooling labor + sticky services tension: labor firmed while services prices stayed sticky, the hawk’s version of the same story. Every labor release beat, ending with 165,000 payrolls against 65,000 expected and 84,000 of upward revisions, while ISM services prices held at 73 and the survey’s chair warned that more pricing pressure is coming. Fed speakers took the cue, from Hammack’s call for a restrictive stance to Daly’s expectation that policy must tighten further. Markets resisted for one session only: Thursday’s AI rout cut Polymarket’s hike odds to 64% and the 2-year yield by 11.7 bps, but Friday’s jobs report restored most of both, leaving hike odds 7 points higher on the week even as Brent fell nearly 13%. Tuesday’s October CPI will decide whether a December hike moves from base case to near-certainty.
POLYMARKET ODDS — WEEK-ON-WEEK SHIFT:
| Market | Last Friday | This Friday | Δ |
|---|---|---|---|
| US Recession by end-2026 | 7% | 5% | −2.0 pp |
| Another Fed hike in 2026 | 70% | 77% | +7.0 pp |
| Fed rate cuts ≥1 in 2026 | 3% | 2% | −1.0 pp |
UNCERTAIN
Every Labor Print Beats, Capped by October Payrolls of 165,000 Against 65,000 Expected and Unemployment of 4.1% (BLS, ADP, Labor Department, Nov 3–6)
What they’re saying:Nonfarm payrolls rose 165,000 in October against a 65,000 consensus; August was revised to +186,000 and September to +60,000, a combined 84,000 more than first reported, and unemployment fell to 4.1% from 4.2%. Average hourly earnings rose 0.4% on the month and 3.1% on the year, against 0.3% and 2.9% expected. Earlier in the week September job openings came in at 7.523 million against 7.10 million (Tuesday), ADP private hiring at 86,000 against 69,000 (Wednesday), and initial claims at 189,000 against 196,000 (Thursday), while Challenger counted 43,994 announced job cuts, the lowest October total since 2023.
The context:Four consecutive beats removed the labor-cooling argument that would have let the Fed skip December: with revisions, payroll growth has averaged 137,000 a month over three months. The market read it as a policy event, not a growth one: the 2-year rose 4.8 bps and the dollar 0.75% on Friday (see the Vol & Treasuries table in Section B), and Polymarket’s hike odds rebounded to 77% (Polymarket table above). Two softer details: continuing claims rose to 1.718 million, and Challenger said “economic conditions” now leads the reasons for cuts.
What to watch:Weekly jobless claims on Thursday, November 12, after 189,000.
BEARISH
Hike Odds Whipsaw From 78% to 64% to 77% as Hammack, Barkin and Daly Argue for Tightening (Polymarket, Federal Reserve, Nov 4–6)
What they’re saying:Polymarket’s odds of another Fed hike in 2026, a market that settles at the December 8–9 FOMC, moved from 70% last Friday to 78% on Wednesday, fell to 64% during Thursday’s rout and rebounded to 77% on Friday; CME FedWatch put a December hike at 78.0% on Friday, from 66.9% on Thursday. Cleveland’s Beth Hammack, a 2026 voter, said policy “will need to move to a restrictive stance”; Richmond’s Tom Barkin said “the path on policy is straightforward, the issue is pace”; San Francisco’s Mary Daly said “we’re going to have to tighten policy further”; and New York’s John Williams said “Inflation is absolutely too high.”
The context:Thursday was the market testing for a Fed put under the AI selloff, and the answer came within a day: Daly called the tech repricing “painful” but “orderly,” and no official treated it as a reason to pause. The Bank of England’s first hike in three years on Thursday, to 4%, citing energy prices, added a G7 precedent. Hammack’s stated preference for “more frequent smaller adjustments” implies December need not be the last move, which is why the 2-year yield, though lower on the week, recovered 4.8 bps on Friday alone.
What to watch:Logan and Schmid on Tuesday, November 10, and Hammack, Daly and Williams again on Thursday, November 12, all after October CPI.
UNCERTAIN
ISM Prices Stay Above 70 in Both Surveys, While Productivity Jumps 3.6% and Unit Labor Costs Fall 0.7% (ISM, BLS, Nov 2–5)
What they’re saying:The ISM manufacturing prices index eased to 75.2 from 77.9 (Monday), and the services prices index was 73.0, above 70 for the seventh time in eight months, with services backlogs at 58.0, the highest since July 2022 (Wednesday). ISM chair Steve Miller said respondents have not yet passed costs on, which “indicates that more pricing pressure is on the way if oil and tariff cost impacts are not mitigated.” On Thursday, third-quarter productivity rose at a 3.6% rate against 2.8% expected and unit labor costs fell 0.7%; on Friday, Michigan’s year-ahead inflation expectations eased to 4.3% from 4.7%.
The context:Two forces pulled in opposite directions. Supply-side gains and a 12.78% weekly fall in Brent (see the Energy table in Section B) argue for cooling headline inflation, while survey prices, the 0.4% rise in hourly earnings and Hammack’s citation of 3.6% headline PCE inflation argue that the pipeline is still full. The Fed weighted the second set, and so, by Friday, did the bond market.
What to watch:October CPI on Tuesday, November 10 (headline 0.3% month on month expected after 0.6%, core 0.2% after 0.3%), and PPI on Friday, November 13 (0.4% expected).
BULLISH
Growth Tracks Above 3%: ISM Manufacturing Beats at 55.5 and GDPNow Holds at 3.4% After Touching 3.7% (ISM, Atlanta Fed, Census Bureau, Nov 2–4)
What they’re saying:The ISM manufacturing PMI rose to 55.5 from 54.5 against 54.6 expected, its 10th month of expansion, with production at 59, the highest since November 2021. September factory orders rose 1.8% against 1.2% expected. The Atlanta Fed’s GDPNow model lifted its fourth-quarter estimate to 3.7% from 3.2% on Monday, then trimmed it to 3.4% on Wednesday after ISM services eased to 54.5, just below the 54.8 forecast but with all 10 of its indexes in expansion. The September trade deficit narrowed to $105.0 billion against $108 billion expected.
The context:The economy is running warm enough to give the Fed’s hawks their growth argument: a fourth quarter tracking near 3.4% follows a third quarter at 3.4%, with no sign of the slowdown that would justify holding rates. The only cooling came at the margin, in services new orders, down 3.9 points to 55.9. Strong growth is also why the recession market fell to 5% (Polymarket table above).
What to watch:The next GDPNow update on Monday, November 9, which folds in Friday’s payrolls.
BEARISH
Tight Money Bites Where It Should: Residential Construction Falls 5.5%, Banks Tighten Commercial Real Estate and Nonbank Lending, and Card Borrowing Surges (Census Bureau, Federal Reserve, Nov 2–6)
What they’re saying:September construction spending fell 1.9%, with private residential spending down 5.5% to an $848.8 billion annual rate (Monday). The Fed’s October loan officer survey found banks tightened standards for all commercial real estate categories and for every type of loan to nondepository financial institutions it asked about, citing the “deteriorating financial strength” of nonbank borrowers, while demand weakened for business loans, commercial real estate and mortgages (Monday). Consumer credit rose $27.84 billion in September against $12 billion expected, with revolving credit growing at a 14.5% annual rate (Friday). Freddie Mac’s 30-year mortgage rate eased to 7.18% from 7.24% (Thursday).
The context:The aggregate data are strong, but the rate-sensitive corners show exactly where restraint is landing: housing, commercial property and the nonbank lenders that fund them, a direct read-through to private credit. Card balances growing about four times as fast as other consumer credit suggest some spending is being financed rather than earned. Housing stocks rallied on Wednesday on hopes for affordability action, but with mortgage rates still above 7% the sector’s fundamentals have not moved.
What to watch:October existing home sales on Thursday, November 12 (3.98 million expected), and the MBA 30-year mortgage rate on Wednesday, November 11.
— Know the probability before the market prices in the risk. Apply for membership at join.recessionalert.comE. WEEK IN EARNINGS -> TOP
TOP EARNINGS OF THE WEEK
BULLISH
1. Advanced Micro Devices (AMD): −11.05% on the week | A Record Data-Center Quarter and a $17 Billion Guide, Overwhelmed by the Sector Rout
The Numbers:Released AMC Tuesday, November 3. Revenue $13.38 billion (+45%) against a $13.10 billion estimate; non-GAAP EPS $2.09 (+74%) against $1.95. Data Center a record $8.55 billion (+97%); Client and Gaming $3.72 billion (−8%); Embedded $1.11 billion (+29%). Non-GAAP gross margin 56%. Fourth-quarter guide: revenue of about $17 billion, plus or minus 3%, at a gross margin of about 55%.
The Problem/Win:The guide implies roughly 27% sequential growth from the quarter just reported; CEO Lisa Su said growth will “accelerate further in the fourth quarter as we scale Helios and ‘Venice’ production.” The cost is margin: the guide steps gross margin down about a point as lower-margin Instinct GPUs become a larger share, and the PC-exposed Client and Gaming segment shrank.
The Ripple:The stock’s week traced the whole sector: −7.52% Monday, +7.49% after hours Tuesday, only +1.01% on Wednesday, −17.26% Thursday and +11.04% Friday. Analysts split, with target cuts from BofA and Mizuho and raises from Piper Sandler and JPMorgan.
What It Means:The print answered the demand question with numbers, and the market sold anyway, which shows how far the AI-hardware debate has moved from earnings to funding and policy. For holders, the line items to track are now the gross-margin glide path and the client segment, where AMD shares Intel’s PC exposure.
What to watch:Nvidia’s results later in November, for confirmation that accelerator demand is holding across suppliers.
BULLISH
2. AppLovin (APP): +31.04% on Thursday | Revenue Up 55% and a Guide Above Consensus on the Day the Nasdaq 100 Fell 6.36%
The Numbers:Released AMC Wednesday, November 4. Third-quarter revenue $2,185 million (+55%) against $2.07 billion expected; diluted EPS $4.30 against $4.03. Net income $1.44 billion (+72%); adjusted EBITDA $1.84 billion (+59%), an 84% margin. Fourth-quarter guide: revenue of $2,365–2,395 million, above the roughly $2.31 billion consensus one aggregator listed, and adjusted EBITDA of $1,995–2,025 million. The buyback authorization was raised by $3.2 billion to $3.6 billion.
The Problem/Win:A clean beat on every line and a guide that implies continued sequential growth, at margins few software businesses reach. The company bought back and withheld 4.1 million shares for $1.4 billion in the quarter.
The Ripple:The gain lifted AppLovin’s market value to about $119 billion from about $91 billion and brought target raises, including BTIG to $450 and Wedbush to $600, while chipmakers lost double digits around it.
What It Means:Investors are now separating companies that earn money from AI, here through advertising, from companies that must spend on AI infrastructure. On the week’s worst day, the first group was rewarded and the second punished, a split worth watching as the rotation continues.
What to watch:Whether the stock holds above $100 billion in market value as the AI selloff plays out.
UNCERTAIN
3. Qualcomm (QCOM): −9.49% on Thursday | A Revenue Beat and a $5 Billion Data-Center Target Lose to Margin Pressure and a Soft Outlook
The Numbers:Released AMC Wednesday, November 4. Fiscal fourth-quarter non-GAAP revenue $10.44 billion against $10.12 billion expected; non-GAAP EPS $2.17, one cent above consensus; GAAP EPS $1.17 against $1.37. Gross margin 52.4%, down 160 bps sequentially, per Rosenblatt. First-quarter GAAP EPS guidance came in below estimates, per Benzinga. Qualcomm set data-center revenue targets of $5 billion for fiscal 2027 and $15 billion for fiscal 2029, alongside a custom AI silicon deal with Amazon Web Services.
The Problem/Win:Handset headwinds and rising costs outweighed a data-center business that JPMorgan said exited fiscal 2026 at an annualized run rate of about $8 billion. Rosenblatt cut its fiscal 2027 EPS estimate to $9.54 from $10.42 and its target to $205; JPMorgan cut to $200, flagging “elevated margin pressure and the potential for a more pronounced handset slowdown.”
The Ripple:The shares had risen 5.33% in Wednesday’s regular session on SpaceX’s Starlink Mobile base-station award, so the reversal was sharp. Investing.com tied part of Lam Research’s 16.36% Thursday drop to the outlook, and the margin squeeze echoes the memory-cost pressure Apple cited on Tuesday in guiding December-quarter gross margin to 45%–46%.
What It Means:Memory costs have become an earnings line for device-chip makers and device makers alike. Qualcomm’s diversification is real but, by Rosenblatt’s description, “customer-derived,” resting largely on two hyperscalers, so the handset business still sets the multiple.
What to watch:Data-center revenue against the $5 billion fiscal 2027 target, and memory-driven handset build cuts into the holiday quarter.
WEEK AHEAD PREVIEW:
Q3 2026 earnings season is in its final stretch, with 88% of the S&P 500 reported as of November 6. Next week’s large-cap calendar is concentrated on Thursday, when AI hardware gets its first test since the post-midterm rout.
Brookfield Corporation (BN) — BMO, Thursday, November 12 — consensus EPS $0.69 ($101.47 billion market cap, just above the line); key focus: distributable earnings growth against its 15%-20% long-term target and progress on combining with its insurance business.
Cisco Systems (CSCO) — AMC, Thursday, November 12 — -1.95% today; consensus EPS $1.32, against company guidance of $1.32 to $1.34; key focus: whether orders were pulled forward ahead of price increases, as Morgan Stanley warned in its downgrade on November 5, and cloud-business margins.
Applied Materials (AMAT) — AMC, Thursday, November 12 — consensus EPS $4.06 and about $10.3 billion of revenue per one preview; key focus: China’s share of sales (28% last quarter) and export-control exposure, and whether equipment orders held through the chip selloff.
No company above $100 billion reports Monday, November 9 through Wednesday, November 11, or on Friday, November 13. The largest names on those days are Constellation Energy ($88.56 billion, Monday) and KKR ($86.60 billion, Monday), both below the line.
— US market commentary trusted by family offices and institutions. Apply for membership at join.recessionalert.comF. NEXT WEEK SETUP -> TOP
UPCOMING RELEASES:
| Date | Event | Why It Matters |
|---|---|---|
| Mon, Nov 9 | Fed Goolsbee Speech 10:00 AM | The first Fed speaker after Friday’s payrolls beat; any pushback on a December hike would stand out against this week’s hawkish chorus. |
| Mon, Nov 9 | Atlanta Fed GDPNow Q4 11:00 AM (prior 3.4%) | Folds in Friday’s jobs report; a move back toward Monday’s 3.7% would strengthen the hawks’ growth argument. |
| Mon, Nov 9 | Fed Barkin Speech 12:15 PM | Barkin called the path to higher rates “straightforward” this week; watch whether the jobs data changes his view on pace. |
| Tue, Nov 10 | ADP Employment Change Weekly 8:15 AM (prior 16.75K) | A high-frequency check on whether October’s hiring strength carried into November. |
| Tue, Nov 10 | Core Inflation Rate MoM Oct 8:30 AM (expected 0.2%, prior 0.3%) | The print most likely to settle December: 0.2% would temper hike odds near 77%, while 0.3% or more would push them toward certainty. |
| Tue, Nov 10 | Core Inflation Rate YoY Oct 8:30 AM (prior 2.6%) | Shows whether underlying inflation is drifting up while Fed speakers call it “too high for too long.” |
| Tue, Nov 10 | CPI Oct 8:30 AM (prior 336.94) | The index level behind the headline rate, the base for every month-on-month comparison the market will quote. |
| Tue, Nov 10 | CPI s.a Oct 8:30 AM (prior 336.30) | The seasonally adjusted level that produces the month-on-month change the Fed tracks. |
| Tue, Nov 10 | Inflation Rate MoM Oct 8:30 AM (expected 0.3%, prior 0.6%) | This week’s crude slide will not show up until November’s data, so October can still carry the energy shock. |
| Tue, Nov 10 | Inflation Rate YoY Oct 8:30 AM (prior 3.7%) | A headline holding near 3.7% keeps intact Hammack’s case that inflation has moved “in the wrong direction.” |
| Tue, Nov 10 | Fed Logan Speech 9:35 AM | Dallas’s Lorie Logan, a 2026 voter, gives one of the first Fed reactions to CPI, about an hour after the release. |
| Tue, Nov 10 | EIA Short-Term Energy Outlook 12:00 PM | The first official price forecast since Brent’s steep weekly drop; a lower 2027 path would ease headline-inflation assumptions. |
| Tue, Nov 10 | Fed Schmid Speech 1:30 PM | A second Fed read on CPI the same afternoon, before the market has digested the morning’s speakers. |
| Tue, Nov 10 | API Crude Oil Stock Change w/e Nov 7 4:30 PM (prior −5.267M) | A third straight draw would suggest physical supply is tighter than diplomacy-driven prices imply. |
| Wed, Nov 11 | MBA 30-Year Mortgage Rate w/e Nov 7 7:00 AM (prior 7.3%) | Tests whether the post-election Treasury rally reached borrowers, after housing stocks priced affordability relief. |
| Wed, Nov 11 | Monthly Budget Statement Oct 2:00 PM (prior −$27B) | The first deficit reading of fiscal 2027, for a Treasury that has just pledged to hold coupon auction sizes steady. |
| Thu, Nov 12 | Initial Jobless Claims w/e Nov 7 8:30 AM (prior 189K) | Layoffs have stayed scarce; a move above 200,000 would be the first crack in this week’s labor story. |
| Thu, Nov 12 | Fed Hammack Speech 9:00 AM | Hammack prefers “more frequent smaller adjustments”; her post-CPI view tests whether that means more than one hike. |
| Thu, Nov 12 | Existing Home Sales Oct 10:00 AM (expected 3.98M, prior 3.99M) | Housing’s response to mortgage rates above 7%, after September construction showed residential spending down 5.5%. |
| Thu, Nov 12 | Existing Home Sales MoM Oct 10:00 AM (prior 1.5%) | A decline would confirm that tight money is biting hardest in housing, whatever the election rally priced. |
| Thu, Nov 12 | Fed Goolsbee Speech 11:30 AM | Goolsbee’s second appearance of the week, this time with the October CPI in hand. |
| Thu, Nov 12 | EIA Crude Oil Stocks Change w/e Nov 7 12:00 PM (prior −0.865M) | The government count that confirms or contradicts Tuesday’s API figure, with Brent just below $100. |
| Thu, Nov 12 | EIA Gasoline Stocks Change w/e Nov 7 12:00 PM (prior −0.222M) | Gasoline prices, which President Trump blamed for the midterm losses, fall faster if stocks start to build. |
| Thu, Nov 12 | Fed Daly Speech 1:10 PM | Daly said this week policy must tighten further; listen for any view on the size of the next move after CPI. |
| Thu, Nov 12 | Fed Williams Speech 6:30 PM | The FOMC vice chair’s post-CPI read carries the most weight of the week’s Fed speakers. |
| Fri, Nov 13 | Core PPI MoM Oct 8:30 AM (expected 0.3%, prior 0.7%) | A pipeline check after ISM warned that costs not yet passed on mean “more pricing pressure is on the way.” |
| Fri, Nov 13 | PPI MoM Oct 8:30 AM (expected 0.4%, prior 1.3%) | Shows how much of the oil premium reached producers in October, before this week’s crude slide. |
| Fri, Nov 13 | Fed Daly Speech 12:00 PM | Daly’s second appearance closes a week of Fed speakers that will set December expectations. |
WHAT TO WATCH NEXT WEEK:
1. Does Tuesday’s CPI turn a December hike from base case into a certainty? Polymarket ended the week at 77% and CME FedWatch at 78%, both rebuilt by Friday’s payrolls; a 0.3% core print after a firm jobs report would leave the Fed’s speakers little reason to wait, while a soft one would give Thursday’s risk-off pricing a second chance.
2. Can AI hardware find a floor when Applied Materials and Cisco report on Thursday? They are the first sector reports since the rout put the Nasdaq Composite in correction; Applied Materials’ China share and Cisco’s answer to Morgan Stanley’s pull-forward warning will show whether demand, not just sentiment, has turned.
3. Will diplomacy deliver a reopened Strait of Hormuz before crude’s war premium is gone entirely? Brent has priced a deal that no government has confirmed while tanker attacks continue; the Abu Dhabi talks on Ukraine on November 10–11 and any reopening timetable will test how much of the drop can hold.
4. Does the $125 billion refunding find buyers at lower yields? The 3-year ($58 billion) on Monday, the 10-year ($42 billion) on Tuesday and the 30-year ($25 billion) on Thursday will show whether the post-election bet on less borrowing extends to real demand for duration.
— US market commentary trusted by family offices and institutions. Apply for membership at join.recessionalert.comG. CHART OF THE WEEK -> TOP
WHY THIS CHARTFriday’s chart wins because it asks the question the whole week ended on: was Thursday’s AI rout a crowded exit or the start of something worse? Monday’s Intel valuation, Tuesday’s loan survey, Wednesday’s midterm history and Thursday’s tariff arithmetic each illuminate one thread; this one takes the session where the political and AI threads collided and sets a dated test for it, so readers can check the answer for themselves in four weeks.
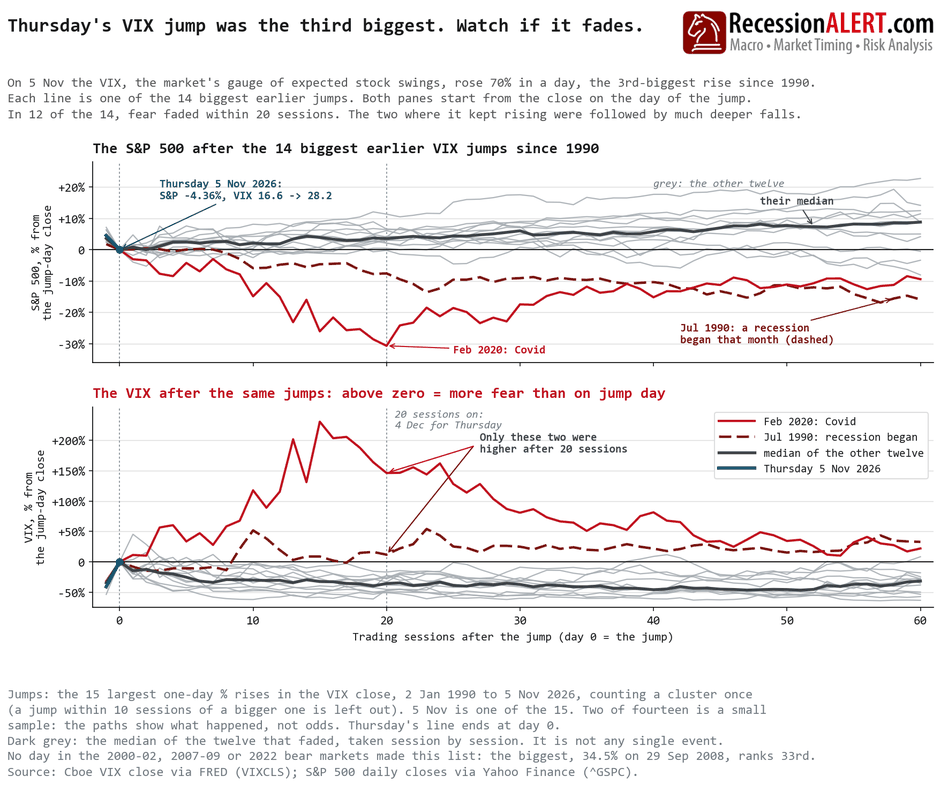
ORIGINAL CHART ANALYSIS — FROM FRIDAY’S MIBThursday’s VIX spike will be judged less by its size than by whether it fades. Of the fourteen biggest earlier one-day jumps since 1990, twelve saw the VIX — Wall Street’s gauge of expected stock swings — back below its jump-day close within 20 sessions. Most fade because they are shocks to positioning, not profits: crowded bets forced out, as when funds betting on calm markets blew up in February 2018 or traders who had borrowed cheap yen to buy higher-yielding assets were flushed out in August 2024. Selling like that is violent but finite; once the forced sellers are out, the scramble for protection ends and fear drains. The two still higher after 20 sessions, July 1990 and February 2020, had real-economy damage arriving behind the panic — a recession, a pandemic — and the S&P 500 went on to fall 17% and 31%. Thursday had the profile of a crowded exit — semiconductors -12.25% against -2.96% for the broad NYSE Composite — and the verdict comes on 4 December: is the VIX still above 28.18? But a fade is not an all-clear. November 2021’s jump faded on schedule, yet the S&P was 8% lower within 60 sessions and the 2022 bear market followed as a grind; like 2000-02 and 2007-09, it never produced a day big enough for this list, and in 2008 the VIX climbed from 23 to 80.86 without one. A fade can acquit the jump; it cannot acquit the grind. What it means: For households saving in stocks, history argues against selling into days like Thursday: the S&P 500 was higher a month later in 11 of 14 cases. The date to watch is 4 December. A VIX back below 28.18 by then would fit a crowded exit from chip and AI stocks, a problem for those shares rather than the whole market. A VIX still above it would turn the question to the economy, as in 1990 and 2020. Neither answer rules out a slow slide: the two worst bear markets since 1990 crept in rather than leapt.
MIB Weekly Digest Ver. 2.11
For professional investors only. Not investment advice.
© 2026 RecessionALERT.com

Comments are closed.