
Thin Loop. Rigid Lease.
One Recognition Date.
For eight months the same argument has circulated: hyperscalers fund AI labs, labs buy chips, chip revenue validates the hyperscalers. The loop is real. It is also thin — $46bn of equity cash against $879bn of purchase commitments, on the circulating chart’s own legend, and built from an instrument that cannot default, unlike the telecom precedent everyone cites in evidence. The binding constraint sits where nobody is drawing arrows: roughly $2.6tn of arm’s-length obligations that cannot be renegotiated, and an accounting recognition that lands from 2027. The loop is not the risk. The lease is.
- Two credible institutions put the circularity at 96% and at 13%. Both figures are correct — so what is each one actually measuring?
- Why is the part of this structure everyone is arguing about also the part that can most easily be unwound?
- If the loop is not the risk, what is — and when does it arrive?
On 13 August 2026 Michael Burry posted a network diagram showing roughly $879 billion of commitments made by the hyperscalers — the handful of firms that own and rent out the world’s large-scale computing capacity, principally Alphabet, Microsoft, Amazon, Meta and Oracle — circling through a single chip vendor. The claim attached to it was that Nvidia’s revenue is substantially self-funded: the company takes equity stakes in the AI labs, the labs use the money to buy its chips, and the resulting revenue validates a valuation that no independent customer has paid for. Rich Duprey wrote it up for 24/7 Wall St the same morning. Two days earlier CNBC had run a piece on Nvidia’s attempts to quiet the accusation, noting Wall Street was unconvinced it would work. Jensen Huang has called the label ridiculous.
None of this is new. Diagrams of this kind have circulated for roughly eight months, and they share a signature: very large headline numbers, dense webs of arrows, almost no distinction between one financial instrument and another, and virtually no primary sourcing. The genre has produced a great deal of argument and almost no adjudication. That is the gap this note is written into.
Start with the diagram itself, because it settles more than its author intended. The chart carrying the $879 billion figure also carries its own legend, and the legend contains a second number. Equity investment, cash deployed: $46 billion. Purchase commitment, multi-year: $879 billion. These are not the same instrument and they do not belong on the same axis. One is money that has left a bank account. The other is a contractual promise to spend, spread across several years, much of it contingent on infrastructure that does not yet exist. The ratio between them is nineteen to one. Equity is 5.2% of the commitment book.
That is not a rounding quibble. The strong version of the circularity claim — that vendors are funding their own demand — requires the two figures to be comparable, because it requires the cash going out to be doing the work of the revenue coming in. Independent confirmation is available and it points the same way. Nvidia’s widely reported $100 billion commitment to OpenAI, announced September 2025, was a letter of intent staged per gigawatt of deployment — gigawatts of electrical draw being how data-centre capacity is now measured, a single one roughly matching the demand of a mid-sized city — with $10 billion due on completion of the first. By February 2026 no contract had been signed and no money had moved. In March, Huang said the figure was “probably not in the cards.” What Nvidia actually deployed — roughly $30 to $40 billion across all its AI equity positions during 2026 — corroborates the $46 billion in the legend rather than the $879 billion in the headline.
This is the fifth note in a sequence that has come at the same subject from different angles. Structural Economic Changes Yield Challenges for Leading Indicators put the AI wealth effect among the three temporary supports holding up consumption, and recorded AI capital expenditure at 92% of first-half 2025 GDP growth. Bull Flows. Bear Physics. One Timeline. found Magnificent 7 capex running at roughly 90% of operating cash flow and named the late-1990s telecom buildout as the closest precedent — a comparison Section III tests directly, and does not leave where it found it. Three Borrowed Tailwinds. One Inflation Shock. No Fed Exit. did the GDP attribution arithmetic, separating the roughly 79% gross figure from an honest net-of-imports range of 30 to 70%. And Four Major Tops. One Recurring Pattern. Reef the Sails. carried hyperscaler circular capex — about $1.05 trillion of a $2.1 trillion backlog resting on OpenAI and Anthropic — as one leg of a five-leg market-top survey. This note takes that leg and gives it the limb it had outgrown.
Readers have been asking three versions of the same question. Is any of this real, or is it a chart-making exercise. If it is real, is it large enough to matter to a portfolio. And if it matters, is it a risk to be sidestepped or a dislocation to be bought. The answer to all three runs through a single distinction that almost nobody in the argument is drawing, and once it is drawn the rest of the note follows from it.
The method here is deliberate and it is the note’s value. Every circulating figure has been treated as a lead and nothing more, then walked to a filing, an issuer statement, or a central bank publication, and returned with a verdict: confirmed, overstated, or false. Two claims that appeared in earlier drafts failed that test and were removed rather than hedged: a widely circulated figure putting $1.19 of hyperscaler revenue against every $1 of depreciation, which could not be traced to any primary source; and a $175 billion ex-China annualised run-rate for generative AI, where the available estimates ranged from $85 billion to $185 billion, measured market size rather than run-rate, and nothing corroborated the ex-China framing. What survives is what a 10-K, a 10-Q or an issuer release will support.
The circular financing is real, built from an instrument that cannot trigger a credit event, and structurally the most renegotiable part of the AI buildout. The binding constraint sits somewhere else entirely: roughly $2.6 trillion of contractual and lease obligations disclosed in filings, owed at arm’s length to landlords, utilities and builders, non-cancellable, accelerating faster than the revenue meant to service them, and carrying an accounting recognition that lands in 2027 to 2029. The loop is not the risk. The lease is.
Two figures dominate the argument and they appear to contradict each other flatly. The Bank for International Settlements finds that circular financing accounts for approximately 96% of chip-maker commitments. UBS finds that the arrangement with OpenAI accounts for up to 13% of Nvidia’s projected 2026 revenue, against a consensus of roughly $272 billion, leaving the other 87% arm’s length. Bears quote the first. Bulls quote the second. Neither side quotes both, and the reason is that reconciling them dissolves the position each is defending.
Both numbers are correct. They are measuring different things, and the definition is where the whole eight-month argument has been quietly going wrong.
“Circular financing refers to a reciprocal investment structure in which hyperscalers take equity stakes in AI labs in exchange for the latter’s purchase commitments, thus rechannelling capital back to investors as revenue; arm’s length financing denotes flows that do not involve such circular financing.”
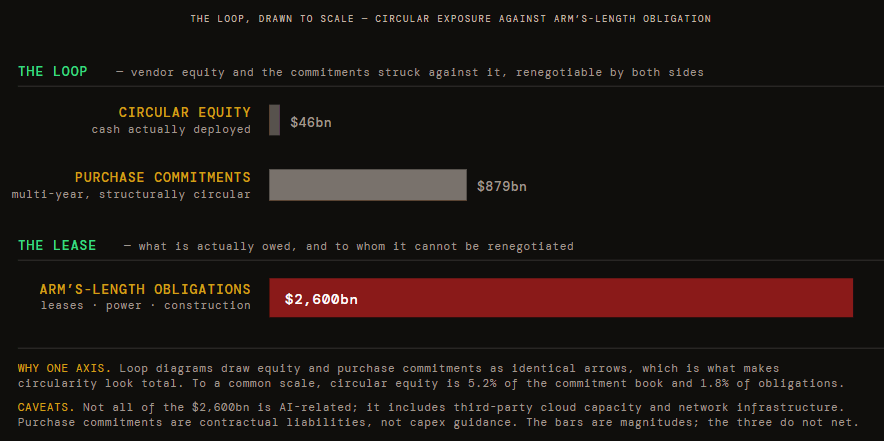
Read that carefully and the mechanism becomes visible. The BIS classifies a commitment as circular if it is structurally linked to a reciprocal equity arrangement — irrespective of how much cash has actually moved. On that test, AMD’s $90 billion arrangement counts as fully circular on the strength of a warrant. The measure is one of contamination: it asks what proportion of the forward order book is entangled with the vendor’s own balance sheet, not what proportion of it the vendor paid for. UBS is asking the second question, and measures the arrangement as a share of the revenue Nvidia is projected to earn across 2026.
One is a structural reading of tomorrow’s committed book. The other is a cash reading of today’s income statement. They are both right, and stacked side by side they say something neither says alone.
BIS, June 2026 — contamination by structure
UBS CIO — funding by cash
The loop is small in today’s revenue and close to total in tomorrow’s committed structure. That single sentence resolves most of what has been argued about since the turn of the year, and it explains why two informed people can read the same balance sheets and reach opposite conclusions without either of them being careless.
It also explains why the concentration matters more than the funding. In the third quarter of its 2026 fiscal year, Nvidia disclosed four direct customers each accounting for more than 10% of revenue — 22%, 15%, 13% and 11%, or 61% of $57 billion between them, against 36% a year earlier. Very little of that is circular in the cash sense. Almost all of it is concentrated in the small group of counterparties whose forward commitments the BIS measure describes. NewStreet Research estimates that every $10 billion Nvidia invests drives roughly $35 billion of GPU purchases or lease payments, meaning that within the demand its own investments generate, Nvidia funds about 29% and external capital the remaining 71%. Note the scope: that ratio applies to the slice of demand its equity creates, not to the order book as a whole. That is a company with a customer-concentration problem, not a company inventing its own revenue.
Every argument about vendor financing eventually reaches for the same precedent. In the closing phase of the telecom buildout, equipment makers lent their customers the money to buy equipment, booked the resulting sales as revenue, and watched the arrangement unwind when the customers failed. Lucent, Nortel and Cisco are the names invoked. The invocation is almost always made without the arithmetic, and the arithmetic is not what the people invoking it assume.
Lucent reported revenue of $38.3 billion in fiscal 1999. Its vendor financing — credit extended to customers specifically so that they could buy its products — ran to $8.1 billion committed, of which roughly $2.1 billion was drawn at the fiscal 2000 close. Committed vendor financing was therefore 21.1% of revenue. Nortel extended $3.1 billion and by 2001 was financing as much as 130% of equipment cost on some deals; Cisco promised $2.4 billion and wrote off roughly $900 million of bad customer loans. McKinsey later tallied about $25.6 billion across nine suppliers by the end of 2000 — the industry-wide figure, and the one worth holding on to. The Securities and Exchange Commission subsequently charged Lucent over $1.148 billion of improperly recognised revenue — worth stating because it is the one feature of 1999 with no analogue today. Nothing in the current structure is concealed or improperly booked; that difference recurs throughout this note.
Set the current case against that base rate honestly, and the first thing to say is that the ratio everyone reaches for does not survive being computed carefully. Lucent’s 21.1% is committed facility against realised revenue. Nvidia’s ~13% is a share of projected revenue attributable to one counterparty. Those are different numerators over different denominators, and the comparison flips depending on which pairing is chosen: measured on cash actually drawn, Lucent’s exposure was 5.5% of revenue against Nvidia’s 13% — today is larger. Measured on committed books, today’s $879 billion against ~$272 billion of projected revenue is a multiple, not a percentage.
So the base rate does not settle this, in either direction, and anyone citing it in either direction is selecting a pairing. McKinsey’s industry-wide tally is the closest thing to a like-for-like anchor — about $25.6 billion of vendor financing across nine suppliers by the end of 2000, against a telecom equipment market a fraction of today’s scale. What actually distinguishes the two episodes is not size at all. It is the instrument.
The precedent everyone cites settles nothing on size. It settles everything on instrument — and that is the comparison nobody is running.
Lucent and Nortel extended credit and loan guarantees. Those are recourse obligations: when the customer fails, the vendor holds a claim that does not pay, books an impairment, and the failure propagates through the vendor’s own balance sheet into its lenders. That is a mechanism for cascade. What Nvidia and its peers have extended is equity. Equity is sunk at the moment it is written. It cannot default, cannot be accelerated, cannot trigger a covenant, and cannot cross-contaminate a lender. If OpenAI were to fail tomorrow, Nvidia would mark its stake to zero and move on. Nobody today is lending customers the purchase price.
This concession is not decoration and it should be stated plainly rather than buried: on the specific question the circulating diagrams are asking — is this the telecom vendor-financing collapse again — the answer is no, and the people saying so are reading the instrument correctly. An analysis that could not say that would not be worth reading on the rest.
What the concession does not do is retire the risk. It relocates it. The fragility of 1999 lived in recourse vendor credit, which is precisely the instrument that has been replaced. The fragility of 2026 lives somewhere the telecom analogy never had to consider, because the telecom buildout leased comparatively little and pre-committed comparatively less: in non-cancellable long-dated leases, held by insurers and pension funds, against assets with a competitive life measured in months. Different instrument, different holder, and a duration mismatch the old episode never had to price. The remaining four sections are about that, and the reason the base-rate exercise had to come first is that the bear case cannot be taken seriously until the bull case has been given its best number.
Equity cannot trigger a credit event. Within the circular arrangements themselves there is no lender to be repaid and no obligation to accelerate, so that structure cannot produce the 2001 outcome on its own. Any analysis treating today’s equity stakes as equivalent to Lucent’s loan guarantees has mistaken the instrument, and will misjudge both the timing and the transmission of whatever does eventually go wrong. Lenders have not disappeared from this cycle — Section V is largely about where they went — but they sit outside the loop, at the lease and the special purpose vehicle, not inside it.
Big-four hyperscaler capital expenditure goes from roughly $410 billion in 2025 to about $725 billion guided for 2026, an increase of 77%. Estimates across the top five run from $690 billion to $755 billion depending on cohort and source. The number is read almost universally as capacity: more spending, therefore more compute, therefore more of whatever compute produces.
It is not all capacity. A material share of it is price.
Fabrication and memory capacity is fixed for eighteen to thirty-six months — the interval between deciding to build a fab and running wafers through it. Investment by the firms buying AI hardware has far outrun investment by the firms that make it. When demand rises against a supply curve that cannot move for three years, quantity cannot clear the market. Price does the rationing instead. This is not a market failure; it is the ordinary behaviour of a market with a fixed short-run supply, and it is the single most under-read feature of the capex headline.
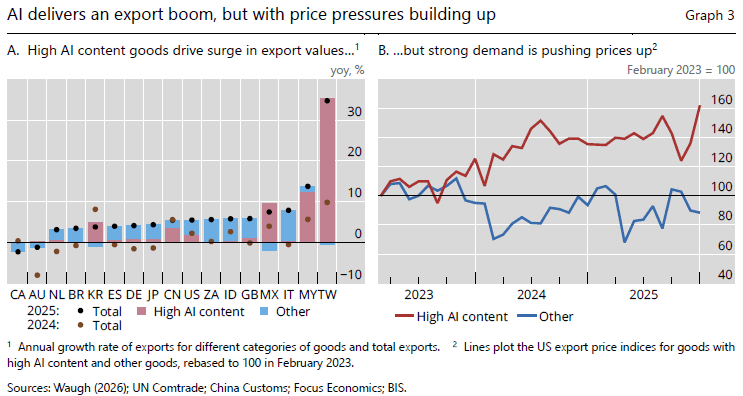
The evidence is unambiguous. Data centres now absorb roughly 70% of world memory output. DRAM contract prices — the negotiated prices at which memory is sold in bulk to large buyers, as distinct from spot — rose 93 to 98% quarter-on-quarter in the first quarter of 2026. United States export prices for high-AI-content goods sit at an index of 157 against 83 for everything else. The consequence is arithmetic: the roughly $700 billion expected to be spent in 2026 buys materially less silicon than the same sum would have bought in 2023. Some meaningful portion of the capex line that markets are reading as an expansion in capability is an expansion in the invoice.
The trade data shows the same thing from the other end, and it is what the chart above measures. Strip the AI column out of Taiwan’s exports and the export miracle turns negative: +35.3 percentage points from high-AI-content goods against −0.6 from everything else the country sells. Korea and Mexico print the same shape. What those economies have booked is substantially a price increase recorded as an export boom — which is the point that matters here, because the same price increase is sitting inside the capital expenditure figure at the other end of the transaction.
The invoice lands in America. AI-related goods were 23% of United States imports last year, and residential electricity prices are rising at roughly twice their normal pace as data-centre load competes with households for generation that was planned for neither. Concentration into a customer is survivable, because customers can be replaced. Concentration into a price is not, because there is nothing to replace.
There is a bull rebuttal here worth taking seriously, because it is the one most often made. Inference costs have collapsed — the cost of producing a million tokens at the performance of a 2021-era frontier model fell from roughly $60 to about $0.06 by 2024, a thousandfold improvement, which looks like decisive evidence that the technology’s economics improve with scale. The difficulty is that the headline series is a purchase mix rather than a price. Closed-model prices fell only 27% over the recent period while open-weight prices sit at a record high; almost nothing became cheaper, buyers moved. Closed models carried roughly 78% of tokens in December and carry 26% today while still taking 62% of spend. What collapsed was not cost. It was frontier pricing power — and the capital already committed depreciates regardless of what a token eventually fetches.
Capital expenditure has gone from roughly 40% of operating cash flow, the norm for the past decade, to between 94 and 100% in 2026. Amazon’s free cash flow turns negative on that arithmetic and Alphabet’s falls by around 90%. The spending is being financed externally for the first time in this cycle at precisely the moment each dollar of it buys less silicon than it did three years ago. Cost inflation and funding transition are arriving together, and the second is what turns the first from an operating problem into a balance-sheet one.
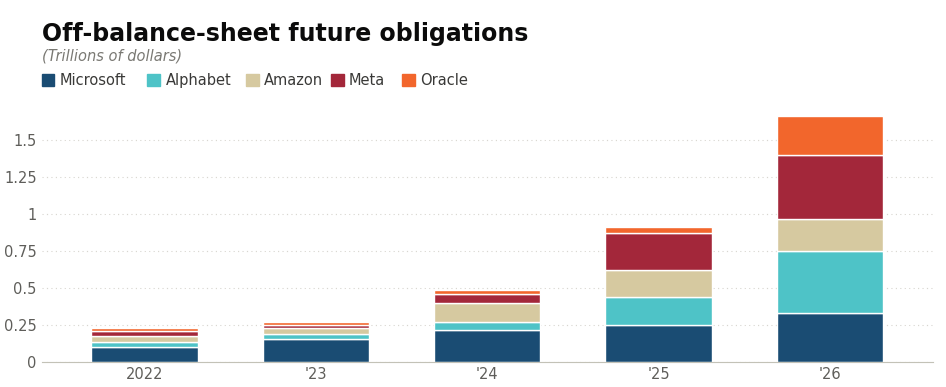
The chart above is Nikkei’s tally of what five hyperscalers owe off the balance sheet: long-term GPU and server contracts not yet delivered, plus data-centre leases not yet operational. Eightfold in four years, and at roughly $1.65 trillion it now exceeds the $1.35 trillion of debt the same companies actually record. Meta’s $420 billion is close to triple its own recorded debt.
It was also compiled before four of the five had reported second-quarter earnings, and Nikkei said plainly the figures would rise. They did. Sorted the other way — by what the obligations are rather than where they sit — purchase commitments and lease obligations disclosed in filings across the same five companies reached roughly $2.6 trillion on second-quarter vintage, compiled by Bloomberg Opinion from company reports, against about $1.67 trillion on first-quarter filings. Some $930 billion of obligation was added in a single quarter, and Alphabet alone supplied $478.6 billion of it — over half the increase across five companies.
One number needs disarming before it misleads. That $1.67 trillion first-quarter tally and the chart’s $1.65 trillion sit almost on top of each other, and they are not the same measure: the first is leases not yet commenced plus purchase and construction commitments, the second is undelivered equipment contracts plus leases not yet operational. Both happen to be off the balance sheet, both were struck before the second quarter closed, and their near-equality is a coincidence of scope rather than a sign that obligations plateaued. The only like-for-like comparison available is $1.67 trillion against $2.6 trillion, one quarter apart.
Nikkei published this under the headline “hidden debts,” and one qualification travels with that word — they make it themselves. None of this is concealed from regulators or auditors. It is disclosed in the annotations to quarterly statements, under existing accounting rules, by companies doing nothing improper. What has been deferred is the recognition, not the obligation — which sets what kind of problem this is. Not a fraud to be uncovered, but a schedule to be read.
Two caveats have to travel with that figure, and they are not throat-clearing. First, not all of it is AI-related: the disclosures include third-party cloud capacity, network infrastructure, general-purpose servers, and in Meta’s case Reality Labs hardware. Second, and more often confused, a purchase commitment is not capital-expenditure guidance. Guidance is a forecast and management revises it whenever it likes. A purchase commitment is a contractual liability that exists whether or not the demand it was signed against ever materialises. The financial press routinely treats the two as interchangeable and they are not remotely the same object.
Alphabet is the clearest single illustration because the disclosure is unambiguous. Purchase commitments and other contractual obligations stood at $332.4 billion at 31 March 2026. At 30 June they stood at $811 billion, of which $200.7 billion falls due within twelve months. That is an increase of $478.6 billion, or 144%, in three months. The rate of change is a far better description of what is happening than either static total, and it runs in the opposite direction to the equity market’s treatment of the same companies.
Now the part that inverts the whole argument. Most of that $2.6 trillion is not circular. It is leases owed to landlords, power purchase agreements owed to utilities, construction contracts owed to engineering firms, and wafer commitments owed to foundries. These are arm’s-length obligations to the real economy, owed to counterparties with no equity relationship to the payer and no reason to be accommodating.
That is worse, not better. A purchase commitment struck with an affiliate you part-own is the most renegotiable obligation on the page — both sides have an interest in restructuring, and the equity stake gives you a seat at the table. You cannot renegotiate your way out of a non-cancellable fifteen-year lease held by a pension fund whose entire reason for holding it is that it cannot be renegotiated. The circularity everyone is worried about is the most flexible part of the structure. The rigidity sits in the part nobody is drawing arrows around.
Oracle carries the mismatch in its most concentrated form. Its fiscal 2026 10-K discloses $273.31 billion off the balance sheet: $260 billion of leases not yet commenced plus $13.31 billion of unconditional purchase obligations, more than a thirty-fold increase in four years. “Not yet commenced” is a lease-accounting term, and it is the reason this exposure is invisible to most screens — under the standard, the liability books when the lessor hands over the asset, so a fifteen-year lease on a data centre still under construction sits in a footnote rather than on the balance sheet. What triggers recognition is a construction milestone, not a market event. Substantially all of it is data-centre property, commencing between the fourth quarter of fiscal 2026 and fiscal 2028, on terms of fifteen to nineteen years. The silicon it houses stays competitive for eighteen to thirty-six months — the same span, coincidentally, that it takes to build the fabs in Section IV, and a useful reminder that these are two unrelated clocks that happen to run at similar speed.
15–19 year term
Non-cancellable
$260bn at Oracle alone
Trigger is a milestone, not a market
$27.3bn at Meta, rated A+
Fully amortising
Annuity coupon
Chip-cycle risk
Meta’s Hyperion campus in Richland Parish, Louisiana shows the full structure in one transaction. A joint venture of roughly $27 to $30 billion with Blue Owl Capital, through a special purpose vehicle named Beignet Investor, funds the 2,250-acre site with Blue Owl taking 80% and Meta 20% — control without consolidation. The vehicle issued approximately $27.3 billion of fully amortising senior secured notes due 2049, rated A+, placed privately, with PIMCO reported to hold around $18 billion and BlackRock around $3 billion. The development was announced at $27 billion in 2025; on 13 July 2026 Meta said total investment in the facility is now expected to exceed $50 billion. And the 20% stake understates what Meta carries: it has contracted to guarantee investors’ losses should the data centre become unnecessary and the lease be terminated. The liability sits outside the balance sheet while the downside stays with Meta. Roughly $120 billion of comparable off-balance-sheet structures exist across the sector. The terminal holders of AI infrastructure risk are insurance general accounts, pension allocations, real-estate investment trusts, infrastructure funds and private-credit vehicles — institutions that bought an annuity-like coupon and are carrying a chip cycle.
“The terms of such deals are typically poorly disclosed, with risks of the same asset being pledged multiple times.”
The counterparty question resolves this into a single number. Oracle closed fiscal 2026 with remaining performance obligations — contracted revenue not yet delivered — of $638 billion, up 363% year on year. Approximately $300 billion of that — roughly half the entire backlog — rests on OpenAI: obligations approaching $60 billion a year from one private, pre-profit counterparty that has publicly confirmed revenue of about $2 billion a month, roughly $24 billion annualised, against an operating margin of −122% in the first quarter of 2026. S&P holds Oracle at the lowest investment-grade rung. Contracted is not the same as collectible, and a backlog is only as good as the balance sheet standing behind it.
The funding mix has changed to match. Incremental debt has gone from 9% of capital expenditure in fiscal 2024 to 32% for the twelve months to June 2026, with roughly $700 billion of borrowings outstanding across AI-linked issuers — a wider group than the five hyperscalers, and a narrower measure than the $1.35 trillion of total recorded debt those five carry between them. Goldman Sachs expects more than a third of AI investment to be debt-funded in 2027. JPMorgan projects $30 to $40 billion of annual data-centre securitisation in 2026 and 2027, against roughly $27 billion in 2025. CoreWeave priced the first investment-grade-rated deal collateralised by GPUs at $8.5 billion — taking GPU-backed debt from a $2.3 billion private-credit experiment to a publicly syndicated investment-grade asset class in about thirty months. Alphabet, for its part, ended thirty-three consecutive quarters of buybacks in the first quarter of 2026 and raised roughly $84.75 billion in June across notes, equity and a 6.25% mandatory convertible — against $240 billion of cash it declined to spend. The Bank for International Settlements gave the underlying mechanism a name in its March 2026 Quarterly Review: a special purpose vehicle or joint venture acquires or develops the data-centre assets, producing obligations economically akin to debt but residing largely outside the corporate balance sheet. The BIS calls this shadow borrowing, and described it three months before the filings caught up.
The companies’ own answer to all of this is that future earnings will exceed the obligations, and it deserves stating in their terms rather than in a sceptic’s. Publicly disclosed backlogs for cloud and related services at Microsoft, Alphabet and Amazon totalled roughly $1.45 trillion at the end of March. Matt Garman, chief executive of Amazon Web Services, has said the investment is “not speculative.” All five companies declined to comment on their off-balance-sheet totals. The backlog is real and it is large. It is also contracted revenue set against contracted cost, and Oracle is the standing reminder that a backlog inherits the credit quality of whoever signed it.
The part of this structure that generates the headlines is the part that can most easily be unwound. The part that generates no headlines — fifteen-to-nineteen-year leases, power contracts, construction commitments, all owed to counterparties outside the technology complex — is the part that cannot. Leverage is computed on the term of the debt and never on the half-life of what it financed. That is the mismatch, and it is a maturity-transformation problem wearing the costume of a technology story.
Nothing in this structure defaults dramatically. What it does instead is arrive on an income statement, on a schedule that is already set and can be read out of the filings today.
The four largest spenders — Alphabet, Microsoft, Amazon and Meta, the same group less Oracle — added $433.9 billion of property and equipment in the four quarters through March 2026 while recognising roughly $149 billion a year of depreciation against it. Depreciation is simply the accounting practice of spreading an asset’s cost across the years it is expected to be useful rather than expensing it at purchase — and on the five-to-six-year server schedules these companies use, that means the years 2027 through 2029 absorb today’s build as cost. The borrowing described in the previous section is best understood as pre-funding that crossover. This is the recognition in the title. It is not a date on a calendar — no filing discloses one — but a schedule already fixed by accounting convention, arriving across 2027 to 2029 whatever else happens. That is the note’s answer to the question of when, and it is a firmer answer than a date would be, because a date could be missed and a schedule cannot.
The strongest bull rebuttal is that the capital is already earning its return. Revenue attributable to hyperscaler AI now roughly clears depreciation expense, an inflection that had not occurred a year earlier: Alphabet Cloud grew 82% to $24.8 billion in the second quarter, Google Cloud runs at roughly $80 billion annualised, AWS at about $150 billion, and Azure’s AI run-rate at approximately $37 billion with 123% growth. McKinsey found 65% of organisations using generative AI in at least one business function in the first quarter of 2026, double the rate ten months earlier. The demand is real and it is compounding.
The difficulty is what the crossover is being measured against. It clears today’s recognised depreciation of roughly $149 billion, set against $433.9 billion of assets added in twelve months. The denominator is about to multiply. And Section IV compounds it: because a material share of that $433.9 billion is price rather than capacity, the depreciation arriving in 2027 is charged against less delivered capability than the same spend would have bought in 2023. The cost is booked in full; the capability it purchased is not what the headline implies. The crossover is being celebrated at the precise moment it is set to reverse, and no major neocloud — the newer operators that rent out GPU capacity alone, without the wider software business a hyperscaler carries — is profitable on a generally-accepted-accounting-principles basis today, with depreciation consuming roughly half of revenue at both CoreWeave and Nebius.
There is a second margin hope, and it fails on entirely different evidence. The dominant equity model underwrites margin expansion through headcount reduction — software eats the wage bill. Across roughly 21,600 United States firms, the opposite appears: those in the top third of AI spending added 12% to entry-level headcount in the two years following adoption, against the 10.2% they added overall. The roles most confidently predicted to go first grew fastest. And the threshold for entering that top third is $33.67 per worker per month, which is the more revealing figure — at these firms heavy adoption means leaning into growth and needing more hands to deploy the tools, not fewer.
The caveat belongs with the finding. This is an event study on self-selected adopters — larger, venture-backed, engineering-heavy firms already growing faster than their peers — so AI may be marking a winner rather than making one. The divergence also opens only around month five, which means a twenty-four-month window may be catching the complementary phase with substitution still to come. Taken at its weakest it remains firm-level evidence against the mechanism the trade depends on. AI cannot simultaneously be the employment shock policymakers fear and the headcount-cut windfall equity models assume. Underwrite one, and stop expecting the other.
Amazon shortened the useful life it assigns to servers from six years to five, citing “an increased pace of technology development, particularly in the area of artificial intelligence and machine learning.” This matters because the widely circulated bear claim is that the industry is extending useful lives to flatter earnings. At least one of the largest operators has done the opposite, in a filing, and shortening the schedule pulls recognition forward rather than pushing it out. The direction of the accounting risk is confirmed by the one company that moved; the magnitude claims circulating alongside it are not.
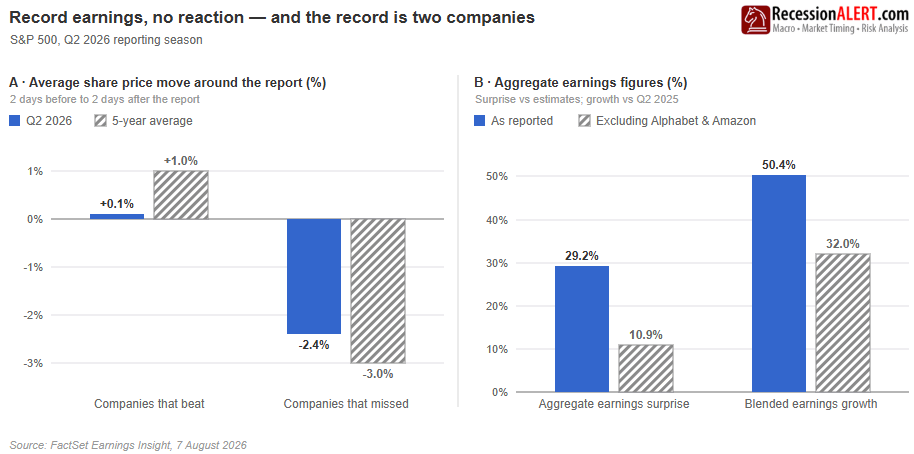
Earnings quality is already degrading, and it is measurable now rather than in 2027. Blended second-quarter earnings growth for the S&P 500 of 50.4% falls to 32.0% excluding Alphabet and Amazon — more than a third of index-level growth sitting in two income statements. Roughly $151 billion of the earnings behind that gap is “other income”: Alphabet’s $98 billion of unrealised gains on equity securities and Amazon’s $53.4 billion mark on its Anthropic stake, balance-sheet revaluations routed into the same earnings-per-share line as operations. FactSet’s record aggregate surprise of +29.2% collapses to +10.9% without them.
This is where the loop does its only measurable damage, and the note should own the point rather than step around it. Those marks are gains on stakes in AI labs — the circular positions Sections I to III spent their length cutting down to size. Being small does not make them inert. The claim is that the loop is too thin to threaten solvency, and $46 billion of deployed equity against $2.6 trillion of obligations is why. It is not too thin to distort reported earnings, because a mark does not need to be large relative to a balance sheet to be large relative to a quarter’s profit. The loop is an earnings-quality problem and the lease is a solvency one, and conflating the two in either direction is how the argument has gone wrong for eight months.
The market has noticed, in the only way that matters. The best aggregate earnings surprise since FactSet began tracking in 2008 bought the average beating company +0.1%, against a five-year norm of +1.0%, while the penalty for a miss held at −2.4% against a −3.0% norm. The payoff around a print has gone from roughly one-to-three against you to roughly one-to-twenty-four. At an 86% beat rate against a ten-year average of 76%, a beat carries no information. Q2 2021 printed 87%, five months before the top.
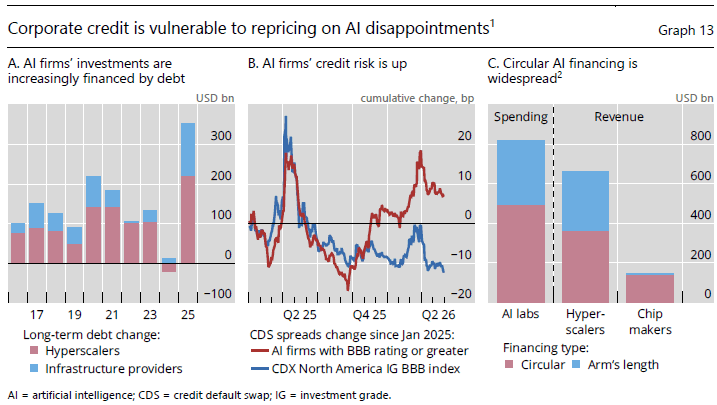
Credit is repricing ahead of equity, which is the historically reliable ordering. Five-year credit default swap spreads on investment-grade AI names — the annual cost, in basis points, of insuring against a default — decoupled from the broad CDX IG BBB benchmark, the standard index tracking the cost of insuring the lowest tier of investment-grade corporate credit, from January 2025. They widened while the benchmark ground about 15 basis points tighter, opening a 20 basis point gap while equity indices printed records. Single names accelerated sharply from late June: Meta from about 68 to roughly 92 basis points, the widest of the group; Broadcom from about 42 to 81; Nvidia from about 45 to 68; Amazon and Alphabet into the mid-60s. Panel A of the chart above supplies the reason. After a net paydown of roughly $40 billion in 2024, AI-linked issuers levered up by a record $340 billion in 2025, about double the 2020 peak. Panel C is the circular-financing split from Section II, with chip makers as the third bar — and it is not an accident that the BIS put it in the same graphic as the credit repricing. The contamination measure and the credit risk are the same book viewed from two angles.
The level deserves stating as plainly as the direction, because the direction is being oversold elsewhere. These remain investment-grade spreads. The investment-grade index sits around 80 basis points and high-yield around 270 to 285. Meta at 92 is roughly at the investment-grade average, not beyond it. This is the fastest repricing on record for this cohort; it is not distress, and anyone describing it as distress is describing a slope as though it were an altitude. What makes it informative is the decoupling from the benchmark, not the absolute number.
Credit moving first is the ordinary sequence, not a surprise. It is the market that reads balance sheets for a living, repricing an obligation before the accounting recognises it. What matters for positioning is that the equity market has now started doing the same thing — and it is doing it in a particular way.

Equity has begun the same adjustment as credit, and through rotation rather than decline. AI’s contribution to the S&P 500’s 2026 return went to zero and crossed negative: seven months, roughly nine percent, every basis point of it belonging to the other 490 names. The mechanism is a sign flip on capital expenditure — guidance that read as a demand signal in 2024 now reads as a claim on free cash flow, which is why 23 July erased approximately $780 billion from the Magnificent 7 in a single session. Across the repricing, Microsoft is down around 20% and Meta around 12% — multiple compression rather than any deterioration in demand. Equal weight now runs more than two percentage points ahead of cap weight, meaning the average S&P constituent has outperformed the index that the largest names dominate. Bloomberg’s valuation snapshots between 6 May and 8 June say the same thing from the other side: Anthropic, still private, +154%, against AMD +38%, Nvidia +4%, Google −6% and Amazon −10%. The payers repriced down and the receiver of their spending repriced up. Same dollar, opposite direction.
That is what makes this a positioning question rather than a warning. The repricing is not a forecast; it is seven months old and visible in the index. And one mechanism sets the clock on how far it runs. A contribution to growth is a first difference, not a level. AI capital expenditure currently supplies more than a quarter of United States growth, contributing about 1.1 percentage points — the arithmetic of a roughly $315 billion increment on a $410 billion base. Holding that contribution through next year requires another increment of the same size, layered on a base already 77% larger. Spending that merely goes flat — at an all-time record, with no bust, no writedowns and no glut — mechanically subtracts that contribution from nominal growth. The danger was never that the boom ends. It is that it steadies.
So the question this note was commissioned to settle — whether the circular financing is a risk or an opportunity — resolves as both, and the two are separable along a single axis that has nothing to do with the loop.
The instinct most readers arrive with is to sell the epicentre and buy the picks and shovels. In this cycle that fails, because the pick-seller is the epicentre: the dominant chip vendor has 61% of revenue in four customers and has taken equity in several of them. The defensible version of the same instinct splits the value chain not by position but by contract rigidity — by whether a counterparty gets paid because a contract says so, or because an order arrives. Read from that axis, three groups separate cleanly.
Contracted operators. Power generation, grid infrastructure and the operating owners of contracted capacity are paid regardless of whether the compute is ever profitably used. This is the exact mirror of what makes $2.6 trillion dangerous for the payer: rigidity is a liability on one side of a contract and an annuity on the other. The same clause that traps the hyperscaler pays the counterparty.
Not the terminal holders. A distinction Section V makes and this one depends on: being paid under a power contract is not the same as holding a 2049 amortising note secured on a single-purpose data centre. The operator earns a contracted return on an asset with alternative uses. The noteholder owns the duration and the residual, which is precisely the exposure Section V describes migrating into insurance and pension books. Own the cash flow, not the paper written against it — and note that a great deal of the paper is being distributed to institutions buying an annuity coupon rather than underwriting a chip cycle.
Order-book suppliers. Engineering and construction contractors, semiconductor capital equipment, and the original-design and contract manufacturers are not defensive despite sitting in the same supply chain. They hold orders, not contracts, and the BIS names construction contractors explicitly as carrying comparatively weak balance sheets and being exposed to any pullback in hyperscaler spending. Under the growth-contribution mechanism described above, they do not need a bust to be hurt. They need only a year in which spending stops rising.
The model layer. Foundation models earn no profit at all on iCapital’s decomposition of where a dollar of AI spending lands — hyperscalers take 29.7 cents, commercial chips 13.0, memory 5.8 — with the foundation-model layer carrying the entire demand story and requiring 17.3 cents of external funding per dollar of customer revenue simply to operate. A layer that must raise capital to serve the customers it already has is not where contract rigidity lives.
The circular financing is real and too small to be the thing that matters. The exposure that matters is contractual rigidity, and it is being mispriced in both directions at once: the market has begun discounting the payers of $2.6 trillion of obligations, visibly and measurably, while the corresponding repricing of the counterparties who receive them is not something the evidence here establishes either way — and that asymmetry of attention is itself the opportunity to test. Portfolios positioned for an AI unwind through technology-sector underweights are hedging the wrong instrument on the wrong timetable.
The asymmetry available is to own the contract, not the order book — favouring contracted, non-cancellable cash flows in power, grid and infrastructure over order-dependent suppliers whose revenue requires the spending to keep rising, and treating the recognition window of 2027 to 2029 as the point at which reported earnings rebase to a level no current forecast contains. This is a rotation to be positioned for, not a crash to be avoided.
The thesis is wrong under three identifiable conditions. If the obligations prove cancellable in practice — material renegotiation or termination of the long-dated leases without penalty — the rigidity the whole argument rests on disappears, and this is the risk that would hurt most, though the private placement of the paper with insurers and pension funds argues strongly against it, since those holders bought duration precisely because it could not be broken. If AI revenue compounds fast enough that 2027 to 2029 depreciation is absorbed without margin compression, the recognition date stops being an event; the current crossover data makes this possible but requires growth to hold as the denominator climbs: $433.9 billion of additions on a five-year schedule adds roughly $87 billion a year of new depreciation for each year the build is sustained, so the ~$149 billion currently recognised roughly doubles within three years of continued spending at this pace and keeps climbing after that. And if AI’s contribution to index return turns positive and sustains while credit spreads re-tighten, the rotation reading is simply wrong and this note is early rather than timely. The base case survives because it does not require anything to break — only for a contractual schedule already disclosed in filings to run on time.
Eight months of argument have been conducted about the part of this structure that can be unwound by mutual consent. The obligations that cannot — the leases, the power contracts, the construction commitments owed at arm’s length — were disclosed the whole time, in footnotes, to counterparties who will be paid whatever happens to the technology. The thesis does not require anything to break. It requires only that a schedule already sitting in the filings runs on time.

Real, and materially smaller than the headline it travels under. The diagram that triggered the argument carries both figures in its own legend: $46 billion of equity cash actually deployed against $879 billion of multi-year purchase commitments, a ratio of nineteen to one. Independent confirmation runs the same way — Nvidia’s widely reported $100 billion commitment to OpenAI was a letter of intent staged per gigawatt of deployment, and by February 2026 no contract had been signed and no money had moved, with actual deployment across all its AI equity positions running to roughly $30 to $40 billion. Equity is 5.2% of the commitment book. The strong version of the claim — that vendors are funding their own demand — requires those two numbers to be comparable, and they are not.
Contamination in one case, funding in the other. The Bank for International Settlements classifies a commitment as circular if it is structurally linked to a reciprocal equity arrangement, irrespective of how much cash has moved — on that test AMD’s $90 billion arrangement counts as fully circular on the strength of a warrant. It is asking what proportion of the forward order book is entangled with the vendor’s own balance sheet. UBS is asking a different question: how much of the revenue Nvidia is projected to earn across 2026 the arrangement accounts for. The loop is small in today’s revenue and close to total in tomorrow’s committed structure, and quoting either number without the other is precisely how eight months of argument has run in circles.
No — but not for the reason usually given, and the base-rate arithmetic settles nothing in either direction. Lucent’s much-cited 21.1% is committed facility measured against realised revenue; Nvidia’s ~13% is a share of projected revenue attributable to a single counterparty. Compare cash actually drawn instead and Lucent’s exposure was 5.5% of revenue against Nvidia’s 13%, which makes today larger, so anyone citing the comparison in either direction is selecting a pairing. What genuinely separates the two episodes is the instrument: Lucent and Nortel extended credit and loan guarantees, recourse obligations that default and cascade through the lender, whereas today’s circularity is equity — sunk when written, non-recourse, incapable of triggering a credit event. Nobody today is lending customers the purchase price.
Because a purchase commitment struck with an affiliate you part-own is the most renegotiable obligation on the page — both sides have an interest in restructuring, and the equity stake buys a seat at the table. The obligations that cannot be renegotiated are the ones owed at arm’s length: fifteen-to-nineteen-year data-centre leases owed to landlords, power purchase agreements owed to utilities, construction contracts owed to engineering firms, wafer commitments owed to foundries. Those counterparties hold no equity in the payer and have no reason to accommodate one. Oracle carries $273.31 billion of it off the balance sheet, on leases running fifteen to nineteen years against silicon that stays competitive for eighteen to thirty-six months. The circularity everyone worries about is the flexible part of the structure; the rigidity sits where nobody is drawing arrows.
Because small is not the same as inert, and the two claims answer different questions. $46 billion of deployed equity against $2.6 trillion of obligations is why the loop cannot threaten solvency — that much is settled by the arithmetic. It can still distort a quarter’s reported profit, because a mark does not need to be large relative to a balance sheet to be large relative to earnings: Alphabet’s $98 billion of unrealised gains on equity securities and Amazon’s $53.4 billion mark on its Anthropic stake are the difference between blended second-quarter S&P earnings growth of 50.4% and 32.0% without them. The loop is an earnings-quality problem. The lease is a solvency one. Conflating the two in either direction is the error this note exists to correct.
Roughly $2.6 trillion of contractual purchase commitments and lease obligations disclosed in the filings of five hyperscalers, against about $1.67 trillion a quarter earlier — some $930 billion added in three months, over half of it Alphabet’s alone. Most of it is not circular in any sense: leases, power, construction and wafers, owed outside the technology complex entirely. The timing is set by accounting convention rather than by markets, because a lease liability books at commencement, when the lessor hands over the asset, which makes the trigger a construction milestone rather than a market event. Against $433.9 billion of property and equipment added in four quarters and roughly $149 billion a year currently recognised as depreciation, the cost arrives across 2027 to 2029. No filing discloses a date; what the filings disclose is a schedule, which is the firmer answer, because a date can be missed and a schedule cannot.
Every one of these questions has the same root. The argument has been conducted in aggregates, about instruments that behave nothing like one another — and the obligation that actually binds was never hidden, only unread.
RecessionAlert Market & GeoNote Series — full prior catalogue: concentration mechanics, capex accounting, GDP attribution, market-top syndrome, labour-market signals
RecessionAlert Chart of the Day — 21 AI-related entries, June to August 2026; in-house analysis on capex intensity, pre-operational leases, price-not-production, credit decoupling, earnings quality and the firm-level labour-market evidence on AI adoption. Charts reproduced from third-party sources are credited to their originator in line.
Bank for International Settlements — Annual Economic Report 2026, Chapter I “Progress and peril”, June 2026: definition of circular financing, disclosure and supplier-fragility commentary, and Graph 13 on corporate credit repricing. Graph 3 on AI export values and prices, reproduced separately.
Alphabet Inc. — Form 10-Q, quarters ended 31 March and 30 June 2026; Q2 2026 earnings release
Oracle Corporation — Form 10-K, fiscal year ended 31 May 2026; leases not yet commenced, unconditional purchase obligations, remaining performance obligations
NVIDIA Corporation — Form 10-Q, fiscal 2026; customer concentration disclosure
Amazon.com Inc. — Form 10-K, 2025; change in estimated useful life of servers
Meta Platforms Inc. — Form 10-Q, quarter ended 31 March 2026
Lucent Technologies — Form 10-K, fiscal 1999; SEC v. Lucent Technologies (revenue recognition)
Bureau of Economic Analysis — Q1 2026 GDP, third estimate
UBS Chief Investment Office — circular share of Nvidia 2026 revenue; gigawatt project capital decomposition
Morgan Stanley Research — pre-operational lease tally, July 2026; hyperscaler issuance projections; AI infrastructure value-chain analysis
Goldman Sachs — debt-funded share of AI investment, 2027
JPMorgan — data-centre securitisation issuance projections, 2026–2027
FactSet — incremental debt as a share of capex; earnings surprise and beat-rate data, Q2 2026
NewStreet Research — investment-to-purchase multiplier on Nvidia equity positions
CreditSights — hyperscaler capex and lease commitment estimates
iCapital Investment Strategy Group — “Tokenomics: The Economics of the AI Boom”, 31 July 2026; value-chain profit decomposition
McKinsey & Company — generative AI adoption survey, Q1 2026; telecom vendor-financing tally, 2000
Bloomberg — private valuation snapshots, 6 May and 8 June 2026; five-year CDS spreads; Bloomberg Opinion hyperscaler obligation compilation
Nikkei Asia — Kohei Yamada, “Five US tech giants’ hidden debts soar to $1.65tn on opaque AI funding”, 21 July 2026; off-balance-sheet study covering undelivered GPU and server contracts and data-centre leases not yet operational
Moody’s Ratings — February 2026 report on the expansion of commitments for leases yet to commence
Financial Times — single-name credit default swap analysis, August 2026
CNBC — Nvidia–OpenAI agreement status, 3 February 2026; Huang remarks, 4 March 2026; circular financing coverage, 11 August 2026
Fortune — Alphabet and Amazon equity-stake contributions to reported profit, April and July 2026
24/7 Wall St — Rich Duprey, 13 August 2026 (trigger coverage)


Comments are closed.