
The U.S economy appears unstoppable right now. Just about every leading and co-incident indicator you can think of is pointing to positive growth. Among the hundreds of indicators we follow for our models on a daily basis, we have discovered a few that are displaying worrying trends and flagging a future recession. It should be pointed out that a handful of indicators flagging recession should not mean we have to push the panic button. A large raft of indicators all concurring is what you should be looking for, and right now a large raft of indicators is confirming economic growth. Nonetheless it is interesting to observe, in a plethora of positive economic indicators, those which are saying otherwise.
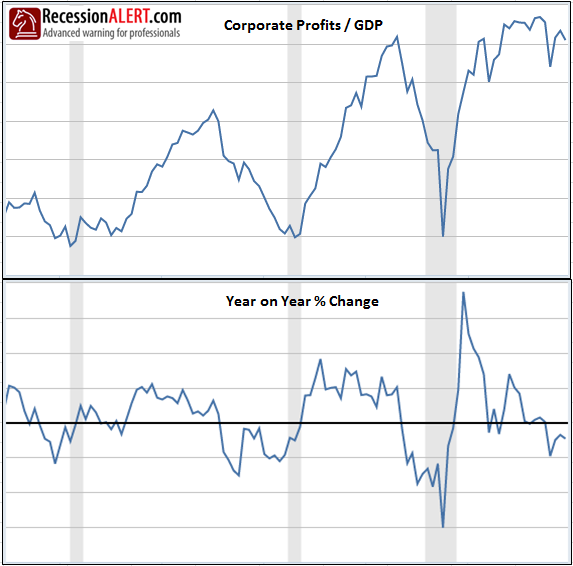
1. Corporate Profits
Corporate profits with inventory valuation adjustment (IVA) and capital consumption adjustment (CCA) relative to GDP has peaked over a year ago which is normally a reliable long leading indicator for economic recession.
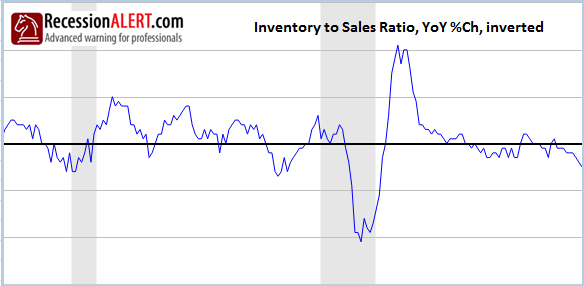
2. Inventory to Sales Ratio
Inventories outpaced sales in a dramatic fashion in the last few month with inverted year-on-year growth plunging below zero which is normally also a long leading indicator of recession. An increase in inventory to sales ratio from one month to the next indicates that either inventory is growing more rapidly than sales or that sales are dropping. No matter which situation is causing the problem, an increase in the inventory to sales ratio signals an oncoming cash flow problem for corporate America:
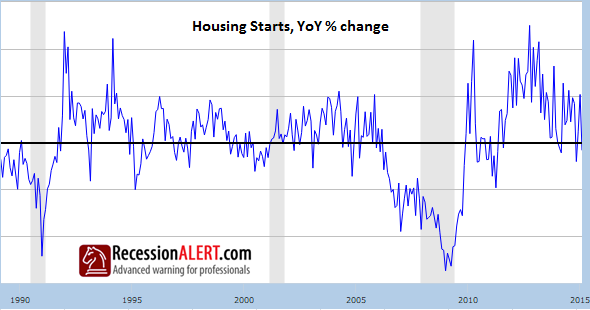
3. Housing Market Weakness
Housing starts growth has been weakening for some time, another long leading indicator of recession:
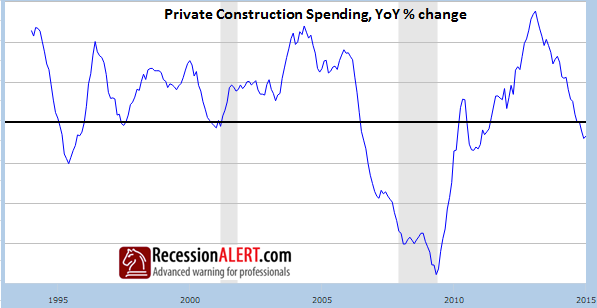
Private construction spending has plunged:
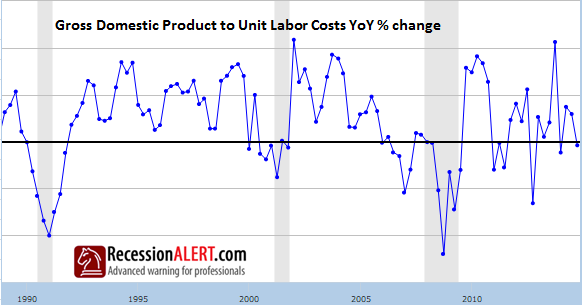
4. Gross Domestic Product to Unit Labor Costs
Another reliable long leading recession indicator favoured by Geoffrey H. Moore, this is now in vulnerable territory:
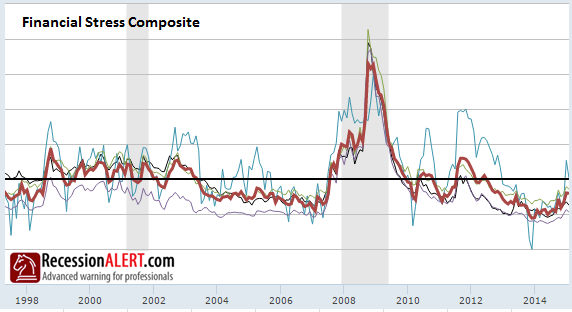
5. Elevated Financial Stress levels
This composite, discussed over here represents a vast, broad array of financial metrics that measure financial stress. It is the broadness of this indicator that makes its rise particularly worrisome since in effect we have a large swathe of indicators more or less in consensus:
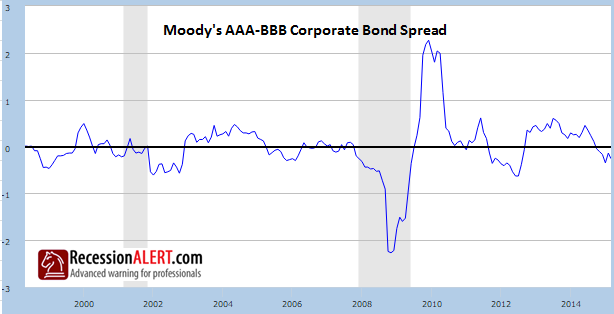
6. Corporate Bond Spreads
Whilst this is one of the hundreds of indicators that are present in the Financial Stress Composite above, it warrants being shown on its own due to its popularity:
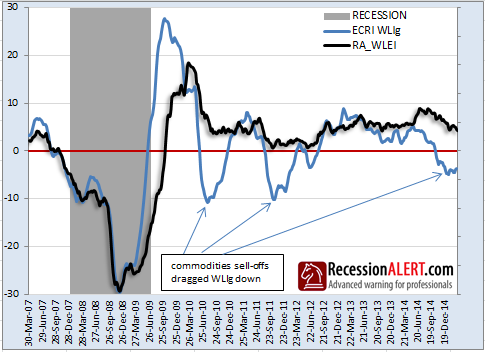
7. The ECRI Weekly Leading Index (WLI)
For the third time in this economic expansion, the ECRI WLIg growth metric is flagging an emphatic recession. This is most likely due to this indicator having a heavy commodities weighting. Whilst this bears careful observation, we also track our own weekly published leading indicator, the WLEI, which consists of over 50 weekly published time series. Whilst this is not flagging outright recession, it certainly has put in an emphatic peak.
8. Valuations are becoming stretched
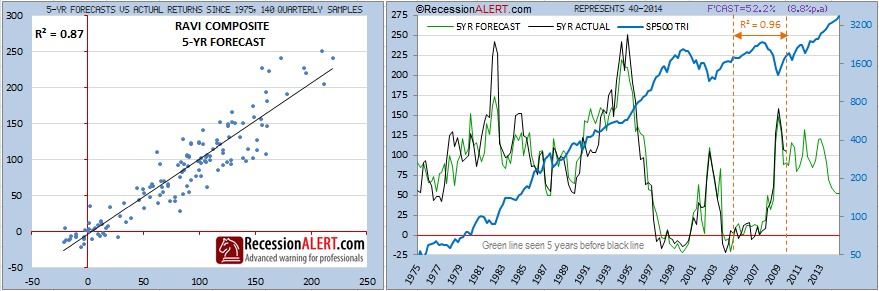
Note the emphasis on “becoming”. As we show here, we do not believe the stock market is as overvalued as it currently would have you believe, but its certainly on its way there with a 5-year forecast of 52.2% or 8.8% compound growth upside. As you can see below, the 5-year forecast trend has peaked and is all downhill from here.
Comments are closed.